Micron Technology, Inc. (MU) and Microchip Technology Incorporated (MCHP) are two prominent players in the semiconductor industry, each specializing in innovative memory and embedded control solutions. While Micron focuses on advanced memory and storage products, Microchip excels in microcontrollers and mixed-signal integrated circuits. Their overlapping markets and distinct innovation strategies make this comparison essential. In this article, I will help you determine which company offers the most compelling investment opportunity.
Table of contents
Companies Overview
I will begin the comparison between Micron Technology, Inc. and Microchip Technology Incorporated by providing an overview of these two companies and their main differences.
Micron Technology, Inc. Overview
Micron Technology, Inc. specializes in designing, manufacturing, and selling memory and storage products globally. Operating through four segments, it offers DRAM, NAND, and NOR memory products targeting cloud servers, enterprise, mobile devices, and automotive markets. Headquartered in Boise, Idaho, Micron is a major player in the semiconductor industry with a market capitalization of $373B and employs 48,000 people.
Microchip Technology Incorporated Overview
Microchip Technology Incorporated develops and sells embedded control solutions including microcontrollers, microprocessors, and related analog and interface products. It serves automotive, industrial, communications, and consumer sectors with a broad product range from microcontrollers to FPGA and memory products. Based in Chandler, Arizona, Microchip has a market cap of $40B and a workforce of 22,300 employees.
Key similarities and differences
Both companies operate in the semiconductor industry and focus on memory and embedded technologies, but Micron centers on memory and storage devices while Microchip provides microcontrollers, analog components, and embedded solutions. Micron’s business is more concentrated on data storage across multiple markets, whereas Microchip’s portfolio includes control and interface products for diverse applications. Market cap and employee size also reflect Micron’s larger scale compared to Microchip.
Income Statement Comparison
This table compares the key income statement metrics for the fiscal year 2025 of Micron Technology, Inc. and Microchip Technology Incorporated, providing a clear financial snapshot for investors.

| Metric | Micron Technology, Inc. (MU) | Microchip Technology Incorporated (MCHP) |
|---|---|---|
| Market Cap | 373B | 40B |
| Revenue | 37.4B | 4.4B |
| EBITDA | 18.5B | 1.0B |
| EBIT | 10.1B | 290M |
| Net Income | 8.5B | -0.5M |
| EPS | 7.65 | -0.005 |
| Fiscal Year | 2025 | 2025 |
Income Statement Interpretations
Micron Technology, Inc.
Micron Technology displayed a strong upward trend in revenue, growing from $27.7B in 2021 to $37.4B in 2025, with net income rising sharply from $5.9B to $8.5B. Margins improved notably, with gross margin near 40% and net margin at 22.8%. The latest year showed robust growth, with revenue and net income surging significantly alongside expanding profitability.
Microchip Technology Incorporated
Microchip Technology’s revenue declined from $5.4B in 2021 to $4.4B in 2025, accompanied by a net loss of $2.7M in 2025 after profits in prior years. Gross margin remained favorable at 56%, but net margin fell to slightly negative, reflecting deteriorating profitability. The most recent year marked a reversal with declines in revenue, earnings, and margins, signaling challenges.
Which one has the stronger fundamentals?
Micron Technology exhibits stronger fundamentals, supported by consistent revenue growth, expanding net income, and improving margins. In contrast, Microchip Technology suffers from declining revenue and net losses, with unfavorable margin trends. Overall, Micron’s financial performance is favorable, while Microchip faces significant headwinds reflected in its income statement metrics.
Financial Ratios Comparison
The table below presents the latest key financial ratios for Micron Technology, Inc. (MU) and Microchip Technology Incorporated (MCHP) based on their most recent fiscal year data.
| Ratios | Micron Technology, Inc. (MU) FY 2025 | Microchip Technology Inc. (MCHP) FY 2025 |
|---|---|---|
| ROE | 15.8% | -0.01% |
| ROIC | 12.1% | -0.03% |
| P/E | 15.9 | -52021 |
| P/B | 2.51 | 3.67 |
| Current Ratio | 2.52 | 2.59 |
| Quick Ratio | 1.79 | 1.47 |
| D/E (Debt-to-Equity) | 0.28 | 0.80 |
| Debt-to-Assets | 18.5% | 36.9% |
| Interest Coverage | 20.7 | 1.18 |
| Asset Turnover | 0.45 | 0.29 |
| Fixed Asset Turnover | 0.79 | 3.72 |
| Payout Ratio | 6.1% | -1951 |
| Dividend Yield | 0.38% | 3.75% |
Interpretation of the Ratios
Micron Technology, Inc.
Micron Technology shows mostly favorable financial ratios, including a strong net margin of 22.84% and a return on equity (ROE) of 15.76%, indicating efficient profitability. However, some ratios such as asset turnover and fixed asset turnover are unfavorable, suggesting less efficient asset use. The dividend yield is low at 0.38%, reflecting modest shareholder returns.
Microchip Technology Incorporated
Microchip Technology’s ratios are mixed, with unfavorable net margin (-0.01%) and ROE (-0.01%), indicating operational challenges. Its interest coverage is weak at 1.15, raising concerns about debt servicing. Despite these issues, it maintains a solid dividend yield of 3.75%, supported by a favorable fixed asset turnover ratio of 3.72, which may appeal to income-focused investors.
Which one has the best ratios?
Micron Technology presents a stronger overall ratio profile, with more favorable profitability and liquidity metrics compared to Microchip Technology. While Micron struggles with asset efficiency, its profitability and financial stability surpass Microchip’s slightly unfavorable global ratio evaluation marked by negative returns and weaker interest coverage.
Strategic Positioning
This section compares the strategic positioning of Micron Technology, Inc. and Microchip Technology Incorporated including Market position, Key segments, and disruption:
Micron Technology, Inc.
- Leading memory and storage manufacturer with significant market cap; faces high semiconductor industry competition.
- Diverse product portfolio: DRAM, NAND, NOR memory; segments include compute, mobile, storage, and embedded units.
- Exposure to evolving memory and storage technologies; must innovate to maintain position in fast-changing semiconductor field.
Microchip Technology Incorporated
- Focuses on embedded control solutions with smaller market cap; competes in specialized microcontroller markets.
- Concentrated on microcontrollers, microprocessors, analog and interface products, plus technology licensing.
- Faces technological shifts in embedded systems and licensing; must adapt to diverse applications and security demands.
Micron Technology, Inc. vs Microchip Technology Incorporated Positioning
Micron’s strategy is diversified across memory and storage segments, supporting broad market coverage but facing intense competition. Microchip’s focus on embedded controls and licensing narrows its scope, possibly limiting market reach but specializing in niche applications.
Which has the best competitive advantage?
Micron shows a slightly favorable moat with growing profitability, indicating improving competitive advantage. Microchip’s very unfavorable moat and declining profitability suggest a weakening competitive position despite specialization.
Stock Comparison
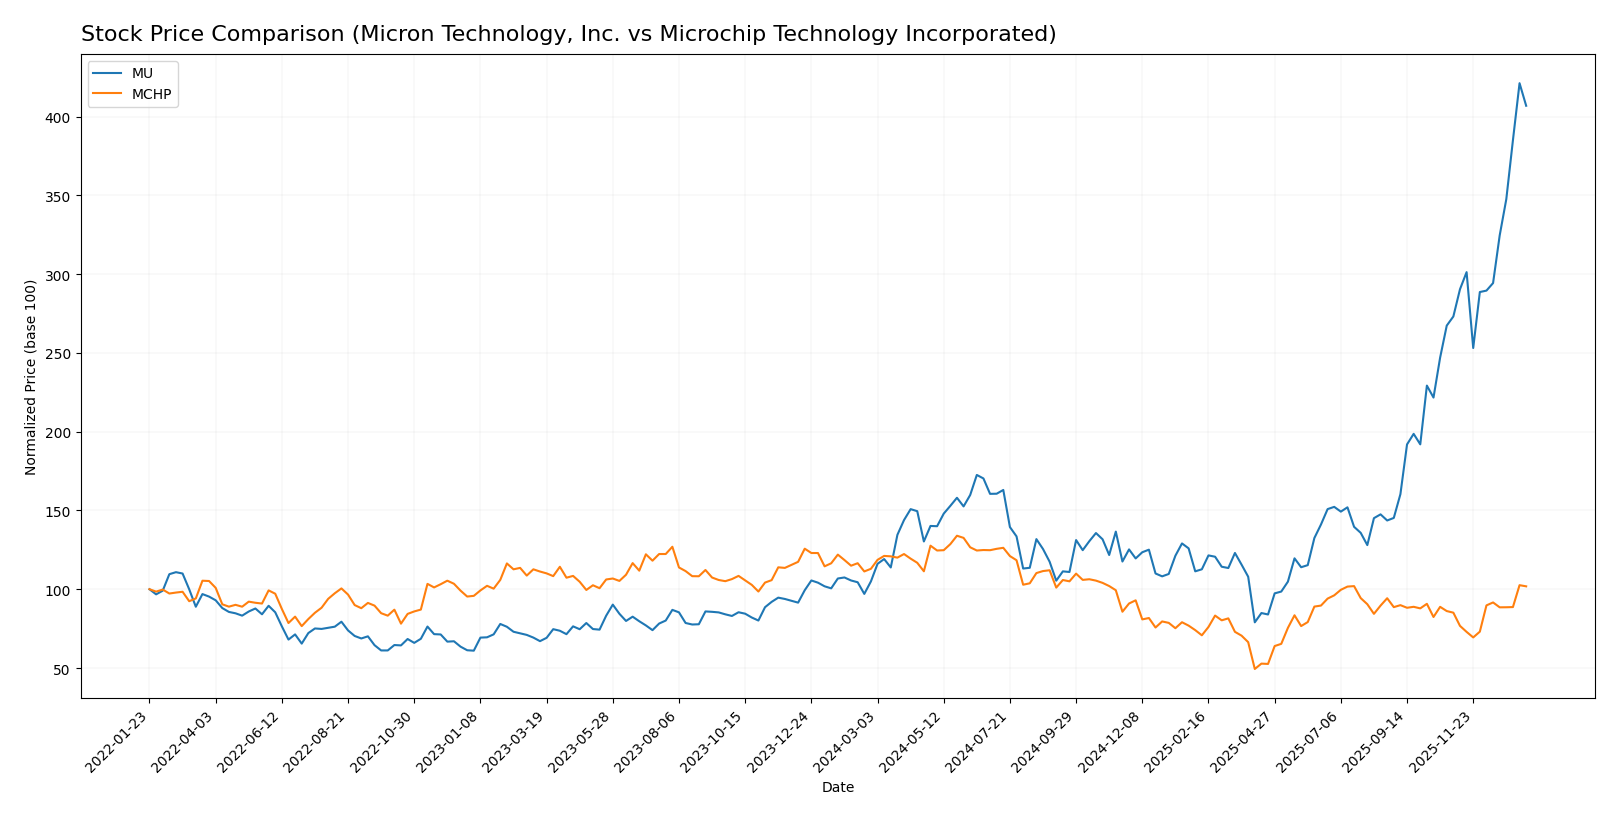
The stock prices of Micron Technology, Inc. (MU) and Microchip Technology Incorporated (MCHP) over the past year reveal contrasting trajectories, with MU showing strong gains and MCHP facing declines tempered by recent recovery signals.
Trend Analysis
Micron Technology, Inc. (MU) experienced a bullish trend over the past 12 months with a price increase of 287.62%, marked by acceleration and a high volatility level (std deviation 57.56). The stock reached a high of 345.09 and a low of 64.72.
Microchip Technology Incorporated (MCHP) showed a bearish trend over the same period, declining by 9.85% with accelerating movement and moderate volatility (std deviation 14.38). The stock’s high was 98.23 and its low 36.22.
Comparing the two, MU delivered the highest market performance with a significant bullish trend, while MCHP’s overall bearish trend reflects weaker market gains despite recent positive momentum.
Target Prices
Analysts present a balanced target consensus for Micron Technology, Inc. and Microchip Technology Incorporated based on current market expectations.
| Company | Target High | Target Low | Consensus |
|---|---|---|---|
| Micron Technology, Inc. | 450 | 190 | 328.22 |
| Microchip Technology Incorporated | 85 | 60 | 76.5 |
The consensus target price for Micron (328.22) is slightly below its current price of 333.35, suggesting modest risk. Microchip’s consensus (76.5) is just above its current price of 74.68, indicating moderate upside potential.
Analyst Opinions Comparison
This section compares analysts’ ratings and grades for Micron Technology, Inc. (MU) and Microchip Technology Incorporated (MCHP):
Rating Comparison
MU Rating
- Rating: B, classified as Very Favorable overall.
- Discounted Cash Flow Score: 1, indicating a Very Unfavorable valuation based on cash flows.
- ROE Score: 4, Favorable, showing efficient profit generation from shareholders’ equity.
- ROA Score: 5, Very Favorable, demonstrating effective asset utilization to generate earnings.
- Debt To Equity Score: 3, Moderate, indicating balanced financial risk.
- Overall Score: 3, Moderate financial standing.
MCHP Rating
- Rating: C-, also classified as Very Favorable overall.
- Discounted Cash Flow Score: 3, a Moderate valuation based on future cash flow projections.
- ROE Score: 1, Very Unfavorable, indicating low efficiency in generating profits from equity.
- ROA Score: 1, Very Unfavorable, reflecting poor asset utilization to generate earnings.
- Debt To Equity Score: 1, Very Unfavorable, suggesting higher financial risk and reliance on debt.
- Overall Score: 1, Very Unfavorable financial standing.
Which one is the best rated?
Based strictly on the provided data, MU holds a higher overall rating and better scores in ROE, ROA, and debt management. MCHP scores lower across most categories, indicating a less favorable financial profile.
Scores Comparison
Here is a comparison of the Altman Z-Score and Piotroski Score for both companies:
MU Scores
- Altman Z-Score: 10.50, indicating a safe zone with very low bankruptcy risk.
- Piotroski Score: 7, categorized as strong financial health.
MCHP Scores
- Altman Z-Score: 4.00, indicating a safe zone with low bankruptcy risk.
- Piotroski Score: 3, categorized as very weak financial health.
Which company has the best scores?
MU shows a higher Altman Z-Score and a stronger Piotroski Score, indicating better overall financial stability and strength compared to MCHP based on the provided data.
Grades Comparison
Here is a detailed comparison of the latest reliable grades from recognized grading firms for both companies:
Micron Technology, Inc. Grades
The table below lists recent grades assigned to Micron Technology, Inc. by reputable financial institutions.
| Grading Company | Action | New Grade | Date |
|---|---|---|---|
| Keybanc | Maintain | Overweight | 2026-01-13 |
| B of A Securities | Maintain | Buy | 2026-01-13 |
| Lynx Global | Maintain | Buy | 2026-01-12 |
| Mizuho | Maintain | Outperform | 2026-01-09 |
| UBS | Maintain | Buy | 2026-01-07 |
| Piper Sandler | Maintain | Overweight | 2026-01-07 |
| Piper Sandler | Maintain | Overweight | 2025-12-18 |
| Barclays | Maintain | Overweight | 2025-12-18 |
| Keybanc | Maintain | Overweight | 2025-12-18 |
| Wolfe Research | Maintain | Outperform | 2025-12-18 |
Micron Technology consistently receives positive grades, mostly “Buy,” “Overweight,” or “Outperform,” indicating a strong favorable outlook by analysts.
Microchip Technology Incorporated Grades
Below is the table summarizing recent grades for Microchip Technology Incorporated from established grading companies.
| Grading Company | Action | New Grade | Date |
|---|---|---|---|
| B. Riley Securities | Maintain | Buy | 2026-01-12 |
| Mizuho | Maintain | Outperform | 2026-01-09 |
| Wells Fargo | Maintain | Equal Weight | 2026-01-07 |
| JP Morgan | Maintain | Overweight | 2026-01-06 |
| Morgan Stanley | Maintain | Equal Weight | 2026-01-06 |
| Needham | Maintain | Buy | 2026-01-06 |
| Rosenblatt | Maintain | Buy | 2026-01-06 |
| Stifel | Maintain | Buy | 2026-01-06 |
| Cantor Fitzgerald | Upgrade | Overweight | 2025-12-16 |
| B of A Securities | Maintain | Neutral | 2025-12-05 |
Microchip Technology’s grades range from “Buy” and “Overweight” to “Equal Weight,” showing a moderately positive but more mixed sentiment compared to Micron.
Which company has the best grades?
Micron Technology shows a stronger and more consistent pattern of favorable grades, predominantly “Buy” and “Overweight,” while Microchip Technology exhibits some variability with “Equal Weight” and “Neutral” ratings. This suggests that Micron currently holds a stronger consensus among analysts, which may influence investor confidence and portfolio decisions.
Strengths and Weaknesses
The table below summarizes key strengths and weaknesses of Micron Technology, Inc. (MU) and Microchip Technology Incorporated (MCHP) based on their financial performance, innovation, market presence, and profitability.
| Criterion | Micron Technology, Inc. (MU) | Microchip Technology Incorporated (MCHP) |
|---|---|---|
| Diversification | Focused on memory products (DRAM and NAND) with growing revenue in DRAM segment | Primarily semiconductor products with technology licensing; less diversified |
| Profitability | Strong profitability with 22.8% net margin and 15.8% ROE, growing ROIC trend | Negative net margin and ROE, declining ROIC, indicating value destruction |
| Innovation | Moderate innovation with steady product sales growth in high-demand memory markets | Innovation challenges reflected in negative profitability and shrinking returns |
| Global presence | Significant global footprint in memory markets, large revenue scale | Global but smaller scale and less diversified product segments |
| Market Share | Large market share in DRAM and NAND markets | Smaller market share focused on niche semiconductor markets |
In summary, Micron Technology demonstrates solid profitability with a slightly favorable moat due to its growing ROIC and leading position in memory products. Microchip Technology faces challenges with declining returns and profitability, resulting in a very unfavorable moat status. Investors should weigh MU’s strong fundamentals and market position against MCHP’s financial difficulties and risk profile.
Risk Analysis
Below is a comparative table of key risks for Micron Technology, Inc. (MU) and Microchip Technology Incorporated (MCHP) based on the most recent 2025 data:
| Metric | Micron Technology, Inc. (MU) | Microchip Technology Incorporated (MCHP) |
|---|---|---|
| Market Risk | High beta (1.503) implies higher sensitivity to market fluctuations | High beta (1.445) also indicates significant market volatility risk |
| Debt level | Low debt-to-equity (0.28) and debt-to-assets (18.45%) suggest manageable leverage | Higher debt-to-equity (0.8) and debt-to-assets (36.85%) increase financial risk |
| Regulatory Risk | Moderate; operates globally in semiconductors with some exposure to trade restrictions | Moderate; similar global exposure with embedded systems focus |
| Operational Risk | Unfavorable asset turnover indicates potential inefficiencies | Low net margin and interest coverage (1.15) reflect operational and financial challenges |
| Environmental Risk | Typical semiconductor industry concerns about resource use and waste | Similar sector risks with additional manufacturing footprint considerations |
| Geopolitical Risk | Exposure due to global supply chains and US-China tensions | Similar exposure, with reliance on international markets and supply chains |
Micron’s most impactful risks are market volatility and operational efficiency, but its strong balance sheet reduces financial distress risk. Microchip faces higher financial risk given its elevated debt and weak profitability, making it vulnerable to interest cost pressures and operational inefficiencies in a competitive semiconductor market environment.
Which Stock to Choose?
Micron Technology, Inc. (MU) shows a strong income evolution with consistent revenue and net income growth, favorable profitability metrics, a healthy debt level (net debt to EBITDA 0.3), and a very favorable rating, supported by solid financial ratios and robust cash flow.
Microchip Technology Incorporated (MCHP) experienced declining income with negative net margin and profitability, higher debt burden (net debt to EBITDA 4.7), and a very unfavorable rating. Its financial ratios reflect challenges, despite some favorable asset turnover and dividend yield figures.
Investors with a growth-oriented profile may find MU’s improving profitability and favorable ratings appealing, while those more cautious might view MCHP’s financial struggles and unfavorable metrics as signals to wait for clearer recovery signs. The differing income and ratio profiles suggest distinct risk tolerances and investment strategies.
Disclaimer: Investment carries a risk of loss of initial capital. The past performance is not a reliable indicator of future results. Be sure to understand risks before making an investment decision.
Go Further
I encourage you to read the complete analyses of Micron Technology, Inc. and Microchip Technology Incorporated to enhance your investment decisions: