In the dynamic semiconductor sector, Microchip Technology Incorporated (MCHP) and indie Semiconductor, Inc. (INDI) stand out for their distinct approaches and market focus. Microchip excels in embedded control solutions across diverse industries, while indie targets automotive semiconductors and software for advanced driver systems. This comparison explores their innovation strategies and market potential to help you identify which stock might best enhance your investment portfolio today.
Table of contents
Companies Overview
I will begin the comparison between Microchip Technology Incorporated and indie Semiconductor, Inc. by providing an overview of these two companies and their main differences.
Microchip Technology Incorporated Overview
Microchip Technology Incorporated develops, manufactures, and sells embedded control solutions worldwide. It offers a broad portfolio that includes microcontrollers, microprocessors, analog and interface products, memory products, and specialized solutions for automotive, industrial, and communications markets. Founded in 1989 and headquartered in Chandler, Arizona, Microchip holds a strong position in the semiconductor industry with a market cap of approximately 40.2B USD and over 22K employees.
indie Semiconductor, Inc. Overview
indie Semiconductor, Inc. focuses on providing automotive semiconductors and software solutions aimed at advanced driver assistance, connected car technology, and electrification. The company also supplies photonic components for optical sensing and communication markets. Founded in 2007 and based in Aliso Viejo, California, indie Semiconductor operates with a market cap near 857M USD and employs around 920 people, positioning itself as a specialized player in automotive semiconductors.
Key similarities and differences
Both companies operate within the semiconductor industry and serve technology-driven markets, but their business models diverge in scale and focus. Microchip offers a diversified product range across multiple sectors including automotive and industrial, while indie Semiconductor concentrates primarily on automotive applications and emerging technologies like photonics. Microchip’s larger market cap and workforce reflect its established global footprint, compared to indie’s more niche and growth-oriented profile.
Income Statement Comparison
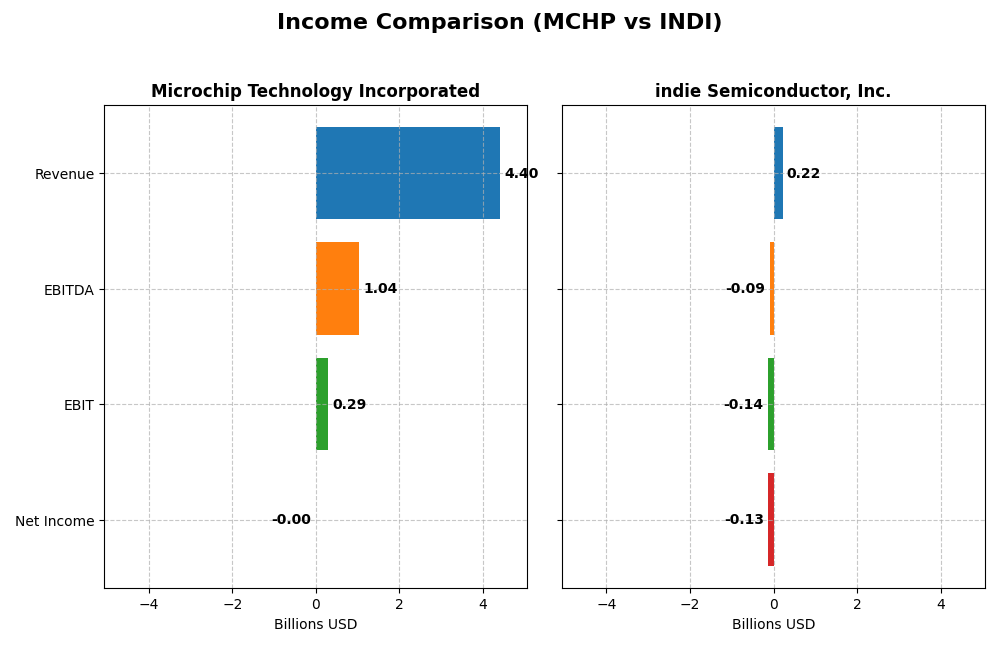
The table below presents a side-by-side comparison of the most recent fiscal year income statement metrics for Microchip Technology Incorporated and indie Semiconductor, Inc.
| Metric | Microchip Technology Incorporated | indie Semiconductor, Inc. |
|---|---|---|
| Market Cap | 40.2B USD | 857M USD |
| Revenue | 4.40B USD | 217M USD |
| EBITDA | 1.04B USD | -94M USD |
| EBIT | 290M USD | -137M USD |
| Net Income | -0.5M USD | -133M USD |
| EPS | -0.005 USD | -0.76 USD |
| Fiscal Year | 2025 | 2024 |
Income Statement Interpretations
Microchip Technology Incorporated
Microchip Technology’s revenue and net income have shown a declining trend from 2021 to 2025, with revenue dropping from 5.44B in 2021 to 4.40B in 2025 and net income turning negative in the most recent year. Gross margins remain favorable at 56.07%, but net margin collapsed to -0.01%. The latest fiscal year saw a sharp decline in profitability and revenue, with negative earnings per share indicating operational challenges.
indie Semiconductor, Inc.
indie Semiconductor’s revenue grew substantially over the overall period but declined slightly by 2.91% in the last year to 217M. Gross margin is favorable at 41.68%, though EBIT and net margins are deeply negative, reflecting ongoing losses. Despite a 6.17% EPS growth last year, the company remains unprofitable with a net margin of -61.2%, suggesting continued investment in growth and development at a cost to profitability.
Which one has the stronger fundamentals?
Microchip Technology shows a stronger gross margin and more stable revenue base historically but faces recent significant declines and losses, impacting net margin negatively. indie Semiconductor presents rapid revenue growth and improved EPS but remains deeply unprofitable with negative EBIT and net margins. Both show risks: Microchip in recent deterioration, indie in sustained losses despite growth.
Financial Ratios Comparison
The following table presents a side-by-side comparison of key financial ratios for Microchip Technology Incorporated (MCHP) and indie Semiconductor, Inc. (INDI) based on their most recent fiscal year data.
| Ratios | Microchip Technology Incorporated (MCHP) FY 2025 | indie Semiconductor, Inc. (INDI) FY 2024 |
|---|---|---|
| ROE | -0.007% | -31.73% |
| ROIC | -0.027% | -19.25% |
| P/E | -52,021 | -5.35 |
| P/B | 3.67 | 1.70 |
| Current Ratio | 2.59 | 4.82 |
| Quick Ratio | 1.47 | 4.23 |
| D/E (Debt-to-Equity) | 0.80 | 0.95 |
| Debt-to-Assets | 36.85% | 42.34% |
| Interest Coverage | 1.18 | -18.37 |
| Asset Turnover | 0.29 | 0.23 |
| Fixed Asset Turnover | 3.72 | 4.30 |
| Payout ratio | -1951.4% | 0% |
| Dividend yield | 3.75% | 0% |
Interpretation of the Ratios
Microchip Technology Incorporated
Microchip shows a mixed ratio profile with strong liquidity indicated by a 2.59 current ratio and favorable fixed asset turnover at 3.72. However, profitability ratios like net margin, ROE, and ROIC are slightly negative, raising concerns about earnings quality and operational efficiency. The company pays dividends with a 3.75% yield, supported by a moderate payout ratio, but some caution is warranted due to coverage risks.
indie Semiconductor, Inc.
indie Semiconductor displays predominantly weak profitability metrics, including a highly negative net margin of -61.2% and ROE of -31.73%. Liquidity appears robust with a 4.82 current ratio, yet interest coverage is deeply unfavorable. The company does not pay dividends, reflecting its ongoing losses and reinvestment focus in R&D, typical of a high-growth phase with no buyback programs reported.
Which one has the best ratios?
Microchip Technology presents a slightly unfavorable overall ratio profile but maintains better profitability and dividend returns compared to indie Semiconductor. indie Semiconductor’s ratios are more unfavorable, reflecting significant losses and operational challenges. Therefore, Microchip’s ratios are relatively stronger, especially in liquidity and shareholder returns, despite some profitability weaknesses.
Strategic Positioning
This section compares the strategic positioning of Microchip Technology Incorporated and indie Semiconductor, Inc. regarding market position, key segments, and exposure to technological disruption:
Microchip Technology Incorporated
- Large market cap (~40B), established with broad competitive pressures.
- Focus on diverse semiconductor products, licensing, and embedded systems.
- Exposure includes mature embedded solutions with varied product range.
indie Semiconductor, Inc.
- Smaller market cap (~857M), facing high volatility with significant beta.
- Concentrated on automotive semiconductors and software for advanced driver assistance.
- Focused on automotive tech, photonics, and connected car software, niche exposure.
Microchip Technology Incorporated vs indie Semiconductor, Inc. Positioning
Microchip adopts a diversified approach across multiple semiconductor segments, supporting stability but facing broad competition. indie Semiconductor concentrates on automotive and photonics, which may limit scale but targets specialized growth areas.
Which has the best competitive advantage?
Both companies show very unfavorable MOAT evaluations with declining ROIC below WACC, indicating value destruction and weak competitive advantages based on available data.
Stock Comparison
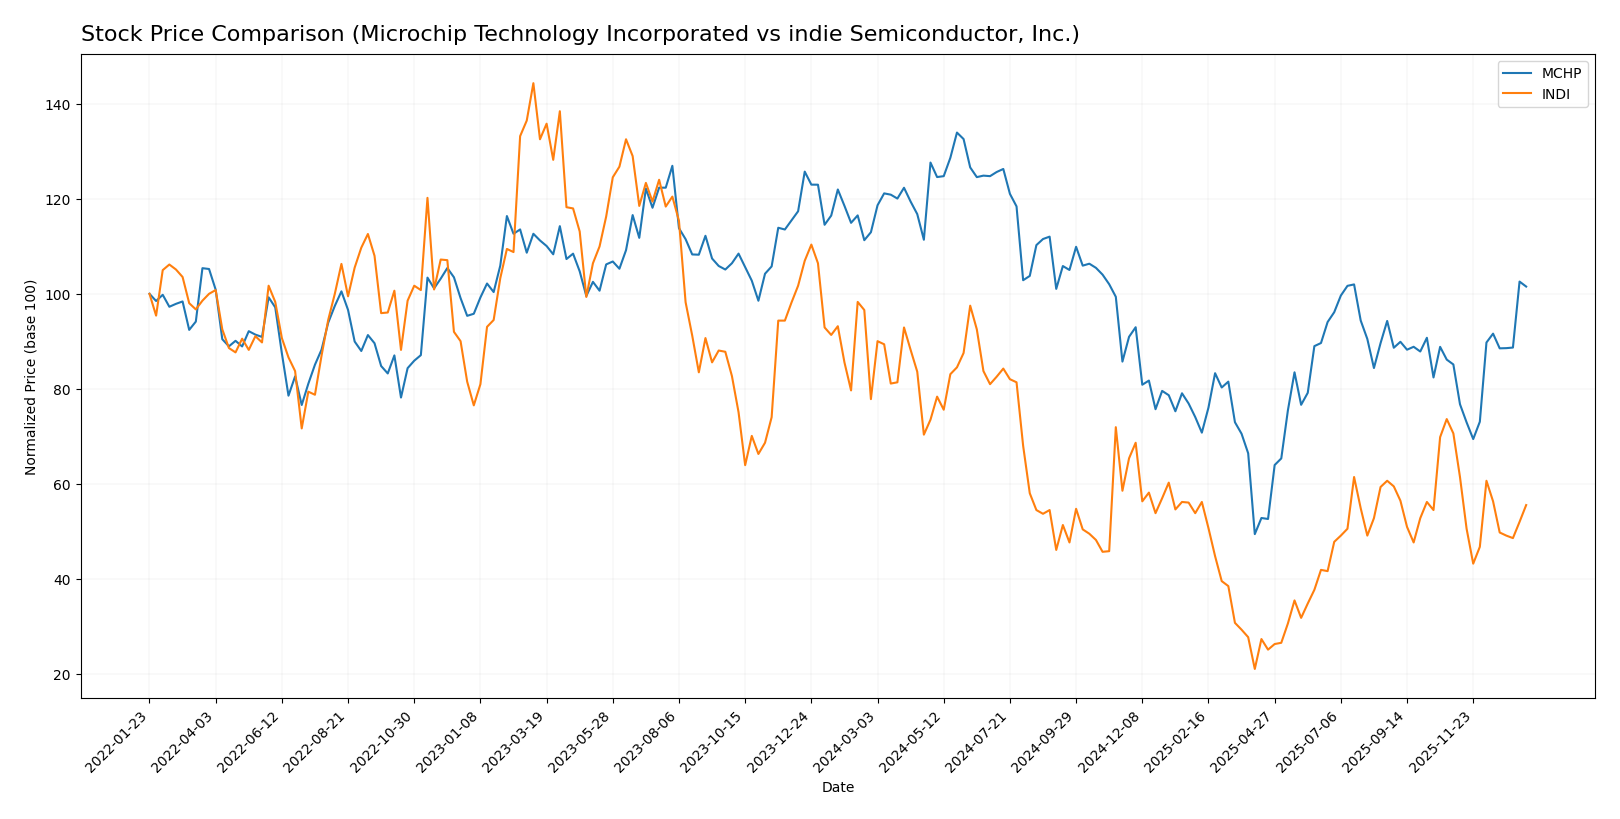
The past 12 months have seen divergent stock price dynamics between Microchip Technology Incorporated and indie Semiconductor, Inc., with Microchip showing signs of recovery after a prolonged decline, while indie Semiconductor continues a marked downturn.
Trend Analysis
Microchip Technology Incorporated’s stock experienced a bearish trend over the past year, declining by 10.13% with accelerating downward momentum, though it showed a recent 19.27% rebound from November 2025 to January 2026. indie Semiconductor, Inc. displayed a more pronounced bearish trend with a 28.67% drop and decelerating losses, continuing to decline by 21.38% in the recent two and a half months. Comparing both, Microchip delivered the stronger market performance, exhibiting a notable recent recovery contrasting indie Semiconductor’s persistent decline.
Target Prices
The current analyst consensus provides clear target price ranges for both Microchip Technology Incorporated and indie Semiconductor, Inc.
| Company | Target High | Target Low | Consensus |
|---|---|---|---|
| Microchip Technology Incorporated | 85 | 60 | 77.44 |
| indie Semiconductor, Inc. | 8 | 8 | 8 |
Analysts expect Microchip’s stock to appreciate slightly above its current price of 74.45 USD, while indie Semiconductor’s target price of 8 USD suggests potential upside from its current 4.23 USD market price.
Analyst Opinions Comparison
This section compares the analysts’ ratings and grades for Microchip Technology Incorporated and indie Semiconductor, Inc.:
Rating Comparison
MCHP Rating
- Rating: Both companies have a C- rating, considered very favorable.
- Discounted Cash Flow Score: MCHP scores 3, indicating a moderate valuation based on future cash flows.
- ROE Score: MCHP has a score of 1, reflecting very unfavorable profit generation from equity.
- ROA Score: MCHP scores 1, showing very unfavorable asset utilization.
- Debt To Equity Score: MCHP scores 1, signaling very unfavorable financial risk due to debt levels.
- Overall Score: MCHP has an overall score of 1, categorized as very unfavorable.
INDI Rating
- Rating: Both companies have a C- rating, considered very favorable.
- Discounted Cash Flow Score: INDI scores 1, indicating a very unfavorable valuation based on future cash flows.
- ROE Score: INDI also has a score of 1, reflecting very unfavorable profit generation from equity.
- ROA Score: INDI scores 1, also indicating very unfavorable asset utilization.
- Debt To Equity Score: INDI scores 1, similarly indicating very unfavorable financial risk from debt.
- Overall Score: INDI also has an overall score of 1, categorized as very unfavorable.
Which one is the best rated?
Both MCHP and INDI share the same C- rating with an overall score of 1, indicating very unfavorable conditions. MCHP has a moderately better discounted cash flow score, but all other scores are identical, so neither is distinctly better rated based on these data.
Scores Comparison
Here is the comparison of the Altman Z-Score and Piotroski Score for Microchip Technology and indie Semiconductor:
MCHP Scores
- Altman Z-Score: 4.00, indicating a safe zone with low bankruptcy risk.
- Piotroski Score: 3, classified as very weak financial strength.
INDI Scores
- Altman Z-Score: 0.12, indicating a distress zone with high bankruptcy risk.
- Piotroski Score: 2, also classified as very weak financial strength.
Which company has the best scores?
Based strictly on the data, MCHP shows a significantly better Altman Z-Score, indicating stronger financial stability, while both have similarly weak Piotroski Scores. MCHP’s scores overall suggest lower bankruptcy risk.
Grades Comparison
Here is a detailed comparison of the latest grades assigned to Microchip Technology Incorporated and indie Semiconductor, Inc.:
Microchip Technology Incorporated Grades
The following table summarizes recent analyst grades for Microchip Technology Incorporated:
| Grading Company | Action | New Grade | Date |
|---|---|---|---|
| Piper Sandler | Maintain | Overweight | 2026-01-15 |
| B. Riley Securities | Maintain | Buy | 2026-01-12 |
| Mizuho | Maintain | Outperform | 2026-01-09 |
| Wells Fargo | Maintain | Equal Weight | 2026-01-07 |
| JP Morgan | Maintain | Overweight | 2026-01-06 |
| Morgan Stanley | Maintain | Equal Weight | 2026-01-06 |
| Stifel | Maintain | Buy | 2026-01-06 |
| Rosenblatt | Maintain | Buy | 2026-01-06 |
| Needham | Maintain | Buy | 2026-01-06 |
| Cantor Fitzgerald | Upgrade | Overweight | 2025-12-16 |
Overall, Microchip Technology Incorporated shows a predominantly positive rating trend, with multiple buy and overweight grades and no downgrades.
indie Semiconductor, Inc. Grades
Below is a summary of recent analyst grades for indie Semiconductor, Inc.:
| Grading Company | Action | New Grade | Date |
|---|---|---|---|
| UBS | Maintain | Neutral | 2025-11-10 |
| Benchmark | Maintain | Buy | 2025-06-25 |
| Benchmark | Maintain | Buy | 2025-06-11 |
| Benchmark | Maintain | Buy | 2025-05-21 |
| Benchmark | Maintain | Buy | 2025-05-13 |
| Craig-Hallum | Maintain | Buy | 2025-05-13 |
| Keybanc | Maintain | Overweight | 2025-05-13 |
| Benchmark | Maintain | Buy | 2025-04-09 |
| Benchmark | Maintain | Buy | 2025-02-21 |
| Keybanc | Maintain | Overweight | 2025-02-21 |
indie Semiconductor, Inc. maintains a generally favorable outlook with mostly buy and overweight ratings, alongside a single neutral rating, and no sell or downgrade actions.
Which company has the best grades?
Microchip Technology Incorporated has received a higher number of buy and overweight grades from a broader range of analysts, indicating stronger consensus support compared to indie Semiconductor, Inc., which shows mostly buy ratings but fewer recent updates. This may influence investor confidence and perception of stability.
Strengths and Weaknesses
Below is a comparison table highlighting key strengths and weaknesses of Microchip Technology Incorporated (MCHP) and indie Semiconductor, Inc. (INDI) based on their recent financial performance and strategic positioning.
| Criterion | Microchip Technology Incorporated (MCHP) | indie Semiconductor, Inc. (INDI) |
|---|---|---|
| Diversification | Strong revenue base with $4.27B in semiconductor sales plus $131M from technology licensing (2025). | Smaller scale with $203M in product sales and $14M in services (2024), less diversified. |
| Profitability | Negative net margin (-0.01%) and declining ROIC, indicating value destruction. | Significantly negative net margin (-61.2%) and ROIC, also destroying value. |
| Innovation | Moderate innovation with licensing revenue, but declining profitability suggests challenges. | Limited scale and negative profitability imply innovation efforts have yet to yield returns. |
| Global presence | Established global presence with significant semiconductor market share. | Smaller footprint, likely more regional or niche in scope. |
| Market Share | Large market share in semiconductor products, generating multi-billion USD revenue. | Much smaller market share with revenues under $250M total. |
Key takeaways: Both companies currently show declining profitability and negative returns on capital, reflecting value destruction. MCHP benefits from larger scale and more diversified revenue streams, whereas INDI remains smaller with less diversification but potential for growth. Caution is advised due to their unfavorable financial metrics.
Risk Analysis
The following table summarizes the key risks for Microchip Technology Incorporated (MCHP) and indie Semiconductor, Inc. (INDI) based on their latest financial and market data:
| Metric | Microchip Technology Incorporated (MCHP) | indie Semiconductor, Inc. (INDI) |
|---|---|---|
| Market Risk | Moderate (Beta 1.445; semiconductor cyclical) | High (Beta 2.54; volatile small cap) |
| Debt Level | Moderate (Debt-to-Equity 0.8; interest coverage 1.15) | Moderate to High (Debt-to-Equity 0.95; negative interest coverage) |
| Regulatory Risk | Moderate (Global semiconductor regulations) | Moderate (Automotive semiconductor industry regulations) |
| Operational Risk | Moderate (Large scale manufacturing complexity) | High (Growth-stage company, execution risk) |
| Environmental Risk | Moderate (Manufacturing emissions, compliance) | Moderate (Emerging technologies, supply chain impact) |
| Geopolitical Risk | Moderate (Global supply chain exposure) | Moderate (Global automotive markets exposure) |
In synthesis, indie Semiconductor faces the highest risk due to its distressed financial position (Altman Z-score in distress zone), significant operational risk, and negative profitability metrics. Microchip shows moderate market and operational risks but maintains a safer financial position (Altman Z-score in safe zone). Debt servicing is a concern for both, particularly for indie Semiconductor with a negative interest coverage ratio. Investors should prioritize risk management and consider Microchip for more stability, while indie Semiconductor carries higher volatility and execution risk.
Which Stock to Choose?
Microchip Technology Incorporated (MCHP) shows a declining income trend with a 42% revenue drop in 2025 and an overall negative net margin growth. Its financial ratios are slightly unfavorable, with a negative ROE and ROIC, but it maintains a strong current ratio and dividend yield. Debt levels are moderate with a neutral to unfavorable rating, and the company is rated very favorably overall despite some weak profitability metrics.
Indie Semiconductor, Inc. (INDI) exhibits a mixed income evolution: strong overall revenue growth but persistent net losses and unfavorable margins, including a -61% net margin in 2024. Financial ratios are mostly unfavorable, highlighted by negative ROE and ROIC, though liquidity ratios like quick ratio are favorable. Debt management is neutral, but the company’s overall rating is very favorable despite financial distress signals.
For investors, MCHP might appear more stable given its stronger dividend yield and better liquidity, despite unfavorable profitability trends and a declining moat. INDI’s metrics suggest higher risk with persistent losses and distress-zone bankruptcy risk. Risk-averse investors may find MCHP’s profile more aligned with stability, while those with a tolerance for volatility and a growth focus might see potential in INDI’s revenue expansion despite its challenges.
Disclaimer: Investment carries a risk of loss of initial capital. The past performance is not a reliable indicator of future results. Be sure to understand risks before making an investment decision.
Go Further
I encourage you to read the complete analyses of Microchip Technology Incorporated and indie Semiconductor, Inc. to enhance your investment decisions: