Home > Comparison > Consumer Cyclical > WYNN vs MGM
The strategic rivalry between Wynn Resorts, Limited and MGM Resorts International shapes the competitive landscape of the Gambling, Resorts & Casinos industry. Wynn operates as a luxury integrated resort developer with highly curated assets, while MGM commands a broader portfolio with diversified regional and international casinos. This head-to-head reflects a contest between premium exclusivity and expansive scale. This analysis will identify which corporate approach delivers superior risk-adjusted returns for a diversified investor portfolio.

Table of contents
Companies Overview
Wynn Resorts and MGM Resorts dominate the global gambling and luxury hospitality markets with distinct strategic plays.
Wynn Resorts, Limited: Luxury Integrated Resort Pioneer
Wynn Resorts stands out as a premium integrated resort operator. It generates revenue from expansive casino floors, luxury hotel rooms, and high-end amenities across Las Vegas, Macau, and Boston. In 2026, Wynn focuses on enhancing guest experiences through exclusive casinos, upscale dining, and expansive convention spaces to sustain its elite market position.
MGM Resorts International: Diversified Hospitality and Gaming Leader
MGM Resorts operates a diverse portfolio of casino and entertainment resorts primarily in the U.S. and Macau. Revenue streams span gaming, hotel accommodations, entertainment, and online sports betting via BetMGM. The company’s 2026 strategy emphasizes expanding digital gaming platforms and broadening its convention and leisure offerings to capture varied customer segments.
Strategic Collision: Similarities & Divergences
Both firms compete fiercely in luxury casino gaming and hospitality but differ in scope and approach. Wynn pursues a high-end, exclusive resort experience while MGM embraces a broader, multi-channel gaming ecosystem including digital betting. Their battle centers on premium leisure and convention markets. Investors face contrasting risk profiles: Wynn’s focused luxury appeal versus MGM’s scale and digital innovation.
Income Statement Comparison
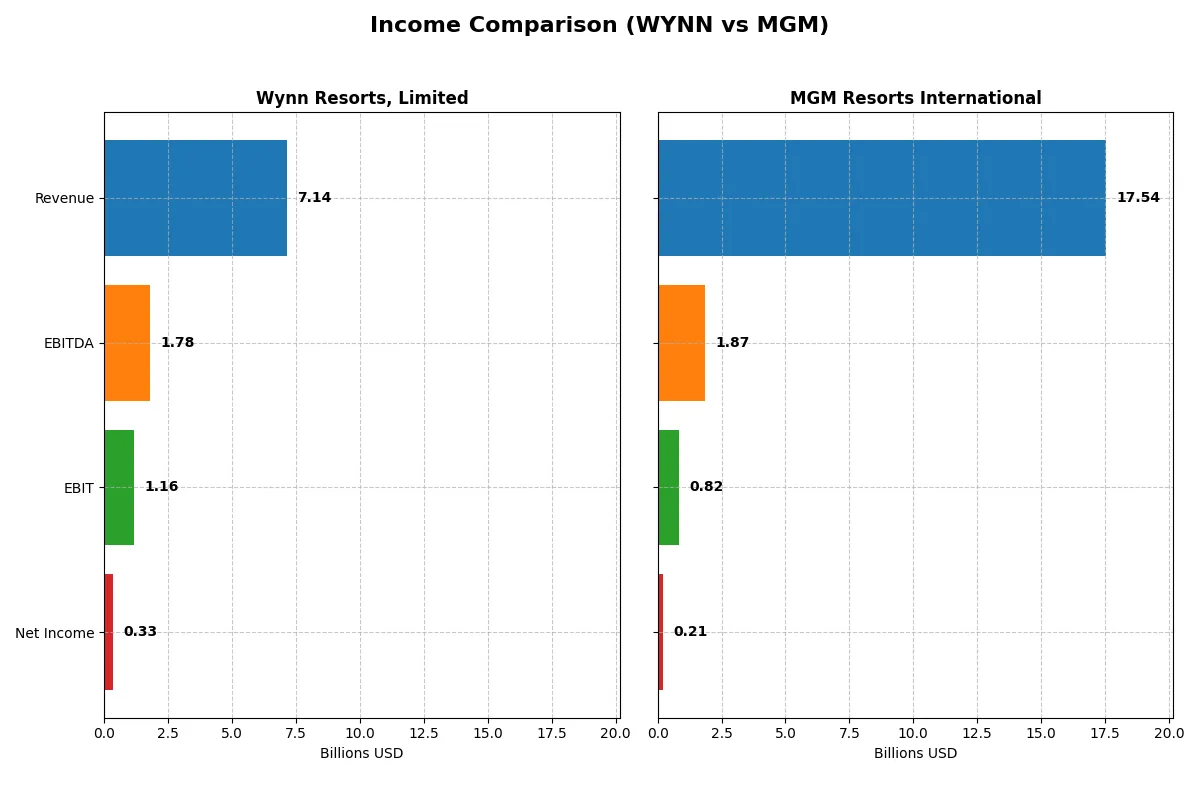
This data dissects the core profitability and scalability of both corporate engines to reveal who dominates the bottom line:
| Metric | Wynn Resorts, Limited (WYNN) | MGM Resorts International (MGM) |
|---|---|---|
| Revenue | 7.14B | 17.54B |
| Cost of Revenue | 4.80B | 9.75B |
| Operating Expenses | 1.18B | 6.79B |
| Gross Profit | 2.34B | 7.79B |
| EBITDA | 1.78B | 1.87B |
| EBIT | 1.16B | 0.82B |
| Interest Expense | 0.63B | 0.43B |
| Net Income | 0.33B | 0.21B |
| EPS | 3.16 | 0.77 |
| Fiscal Year | 2025 | 2025 |
Income Statement Analysis: The Bottom-Line Duel
This income statement comparison reveals which company operates with greater efficiency and profitability in a competitive market landscape.
Wynn Resorts, Limited Analysis
Wynn’s revenue grew steadily to 7.14B in 2025, up from 3.76B in 2021, reflecting strong top-line momentum. Net income followed suit, rising to 327M in 2025 after a loss in 2021, though it declined from 480M in 2024. Gross margin remains favorable at 32.7%, but net margin slipped to 4.6%, signaling margin pressure despite operational gains.
MGM Resorts International Analysis
MGM outpaced Wynn in revenue, reaching 17.54B in 2025, up from 9.68B in 2021, but net income fell sharply to 206M in 2025 from 1.25B in 2021. Its gross margin is robust at 44.4%, yet net margin is low at 1.2%, reflecting heavy costs and declining profitability. The latest year shows weakened EBIT and net income, indicating deteriorating operational efficiency.
Margin Strength vs. Profitability Trajectory
Wynn displays superior net margin improvement and consistent net income growth over five years, signaling better fundamental resilience. MGM commands higher revenue and gross margin but suffers from steep net income declines and margin compression. For investors, Wynn’s improving profitability profile offers a more attractive risk-reward balance than MGM’s scale with faltering profits.
Financial Ratios Comparison
These vital ratios act as a diagnostic tool to expose the underlying fiscal health, valuation premiums, and capital efficiency of Wynn Resorts (WYNN) and MGM Resorts (MGM):
| Ratios | Wynn Resorts (WYNN) | MGM Resorts (MGM) |
|---|---|---|
| ROE | 0% (not reported) | 8.5% |
| ROIC | 0% (not reported) | 2.6% |
| P/E | 38.1 | 46.9 |
| P/B | 0 | 4.0 |
| Current Ratio | 0 | 1.23 |
| Quick Ratio | 0 | 1.20 |
| D/E (Debt-to-Equity) | 0 | 23.1 |
| Debt-to-Assets | 0 | 1.36 |
| Interest Coverage | 1.85 | 2.31 |
| Asset Turnover | 0 | 0.42 |
| Fixed Asset Turnover | 0 | 0.60 |
| Payout ratio | 31.7% | 0% |
| Dividend yield | 0.83% | 0% |
| Fiscal Year | 2025 | 2025 |
Efficiency & Valuation Duel: The Vital Signs
Financial ratios serve as a company’s DNA, exposing hidden risks and revealing operational strengths critical for investment analysis.
Wynn Resorts, Limited
Wynn shows weak profitability with a 0% ROE and modest 4.6% net margin, signaling operational challenges. The stock trades at a stretched 38.1 P/E, reflecting high market expectations. Dividend yield is low at 0.83%, indicating limited shareholder returns, suggesting reinvestment focuses on stability rather than growth or buybacks.
MGM Resorts International
MGM posts a higher ROE of 8.5% but a low 1.2% net margin, indicating thin profitability. Its valuation is more stretched at a 46.9 P/E and an elevated 3.98 P/B ratio. MGM pays no dividend, likely prioritizing debt management amid heavy leverage and cautious capital allocation.
Valuation Stretch vs. Profitability Strain
Wynn’s lower valuation and minimal shareholder yield contrast with MGM’s higher profitability but heavier debt load and premium multiples. Wynn fits investors seeking moderate valuation risk; MGM suits those tolerating leverage for potential operational improvement. Both face substantial challenges reflected in their ratio profiles.
Which one offers the Superior Shareholder Reward?
I see that Wynn Resorts pays a modest dividend yield of 1.47% in 2025 with a sustainable payout ratio near 28%. It combines dividends with moderate buybacks, supporting steady shareholder returns. MGM Resorts, by contrast, pays no dividends but aggressively repurchases shares, boosting total return through capital allocation. Historically, Wynn balances income and growth, while MGM prioritizes reinvestment via buybacks. In 2026, I judge Wynn’s dual approach more sustainable and attractive for investors seeking both yield and capital appreciation.
Comparative Score Analysis: The Strategic Profile
The radar chart reveals the fundamental DNA and trade-offs of Wynn Resorts and MGM Resorts, highlighting their financial strengths and weaknesses:
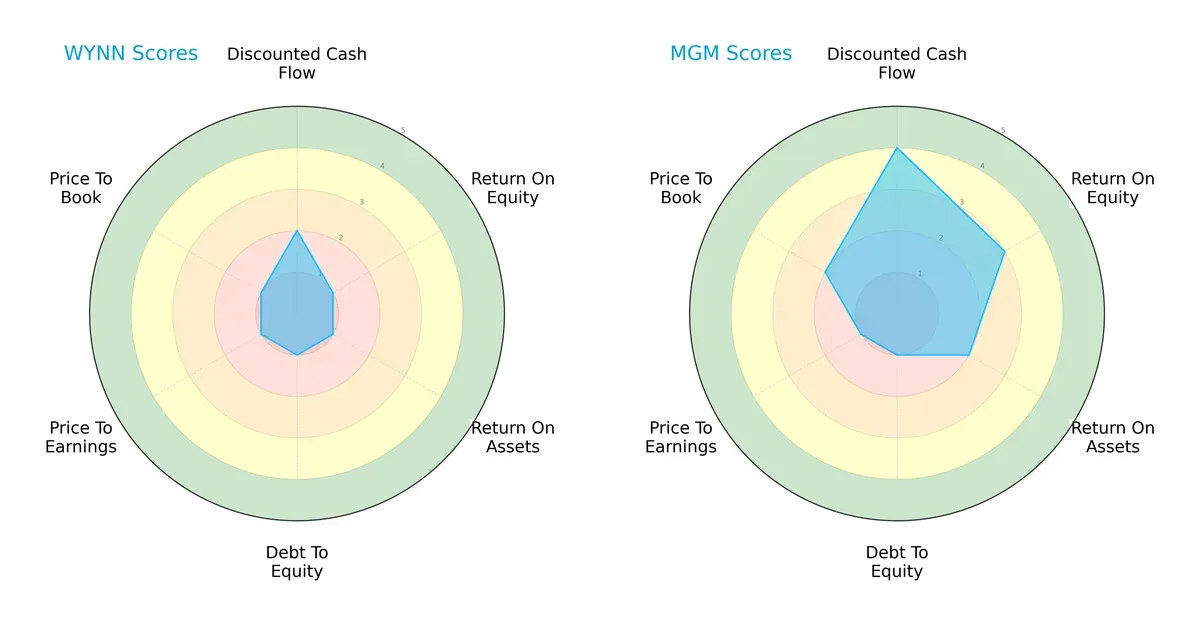
MGM outperforms Wynn in discounted cash flow (4 vs. 2) and return on equity (3 vs. 1), showing a stronger ability to generate shareholder returns. Wynn lags across most metrics, including ROA and valuation scores, indicating a less balanced profile. MGM’s moderate ROA and price-to-book scores suggest it leverages its assets more efficiently but still faces valuation challenges. Overall, MGM presents a more balanced financial profile, while Wynn relies on weaker fundamentals without a clear competitive edge.
Bankruptcy Risk: Solvency Showdown
Both Wynn (1.28) and MGM (0.74) fall into the distress zone on the Altman Z-Score scale, signaling elevated bankruptcy risk in this cycle:
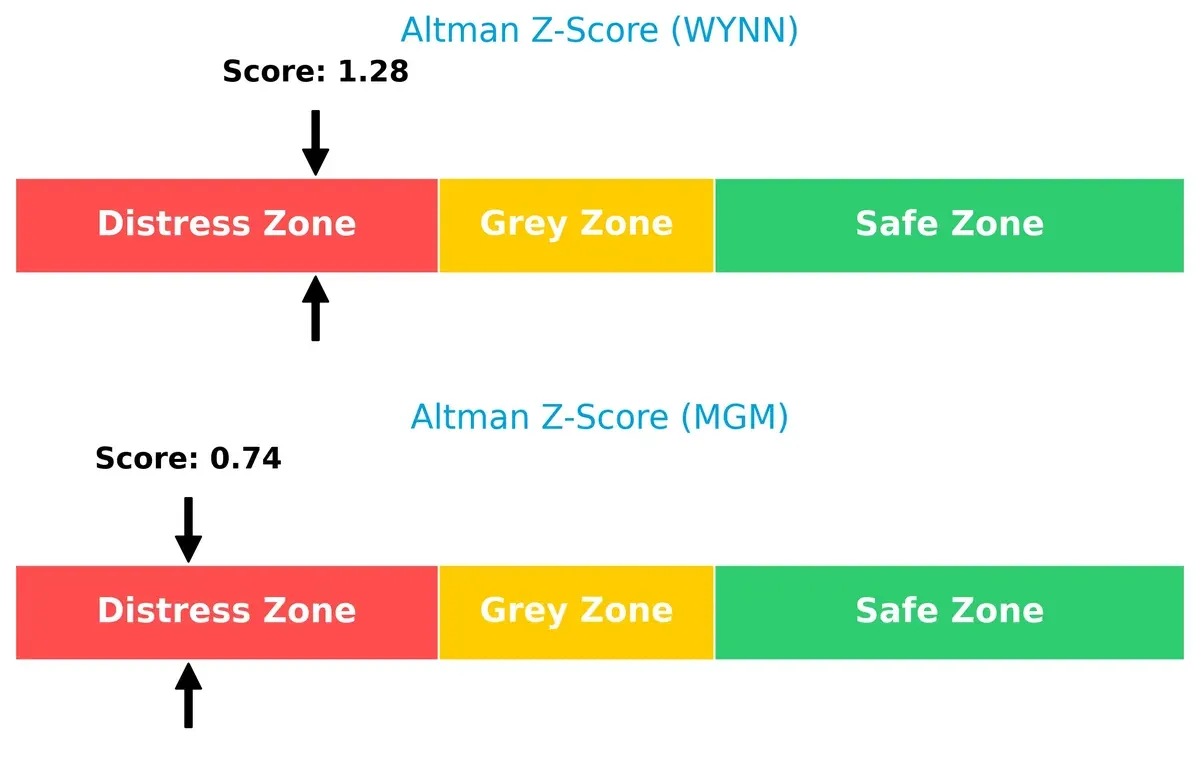
Wynn’s higher Z-Score implies a marginally better solvency position than MGM, but both companies face significant financial pressure. These scores warrant caution, as neither firm currently demonstrates robust long-term survival odds under typical market stress.
Financial Health: Quality of Operations
Wynn and MGM score 5 and 6 respectively on the Piotroski F-Score, indicating average financial health for both firms:
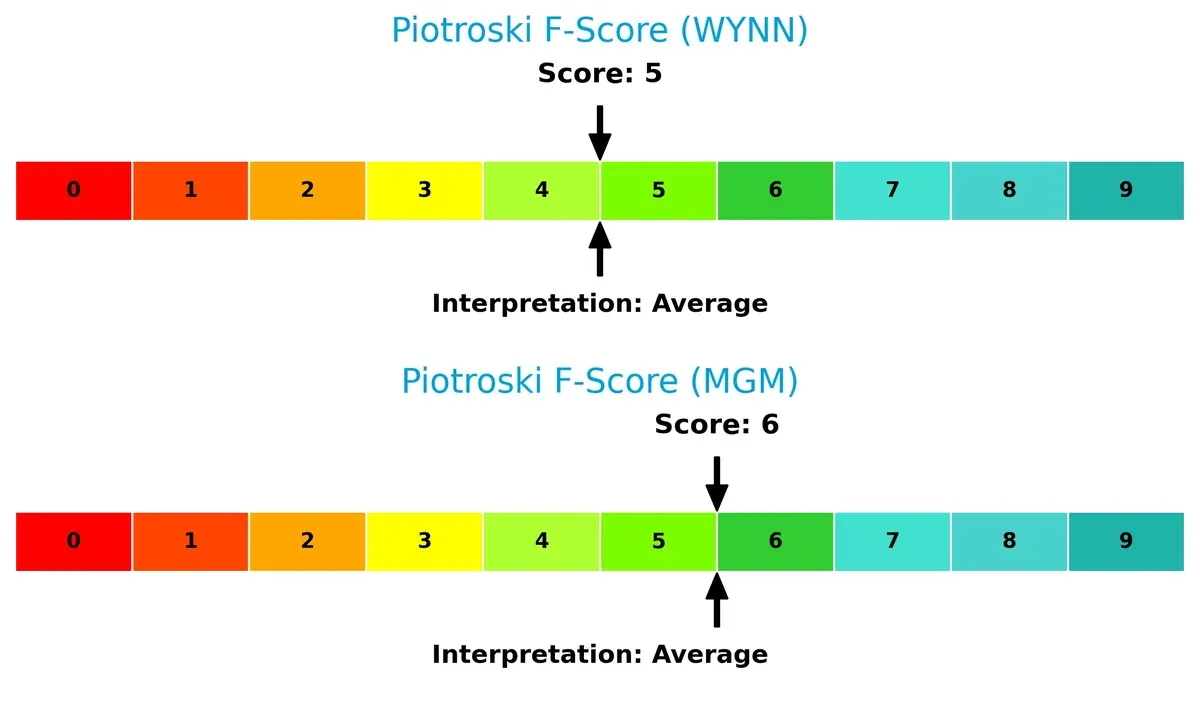
MGM edges ahead slightly, reflecting marginally better operational quality and internal financial discipline. Neither company exhibits red flags, but their moderate scores suggest limited strength in profitability, liquidity, or efficiency metrics. Investors should watch for improvements in internal fundamentals before considering either as a strong quality play.
How are the two companies positioned?
This section dissects the operational DNA of WYNN and MGM by comparing their revenue distribution and internal dynamics—strengths and weaknesses. The goal is to confront their economic moats to reveal which model delivers the most resilient, sustainable competitive edge today.
Revenue Segmentation: The Strategic Mix
This visual comparison dissects how Wynn Resorts and MGM Resorts diversify their income streams and where their primary sector bets lie:
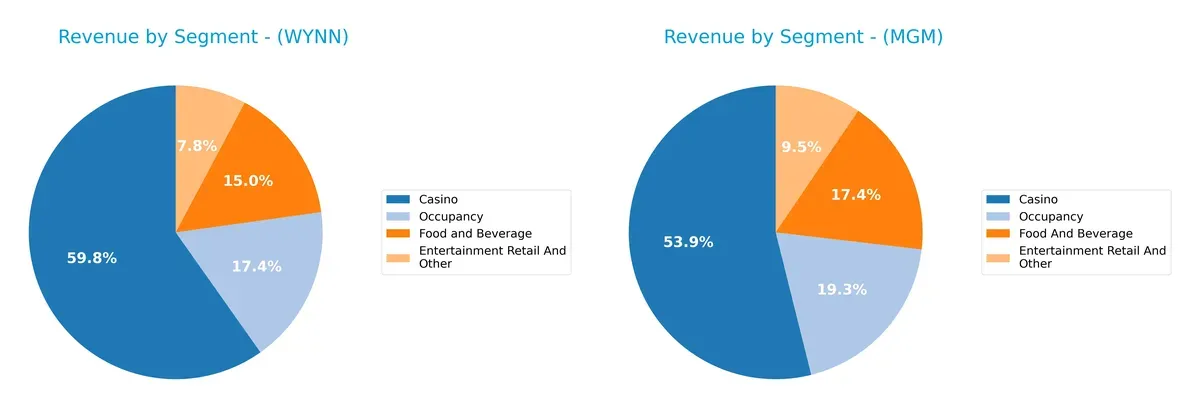
Wynn anchors 4.3B in Casino revenue, with 1.2B in Occupancy and 1.1B in Food and Beverage, showing moderate diversification. MGM dwarfs this with 8.8B in Casino, but also generates 3.7B Occupancy and 3.1B Food and Beverage, reflecting a broader revenue base. Wynn’s concentration in Casino signals higher single-segment risk, while MGM’s balanced mix supports ecosystem lock-in and resilience against sector-specific downturns.
Strengths and Weaknesses Comparison
This table compares the Strengths and Weaknesses of Wynn Resorts and MGM Resorts based on diversification, profitability, financials, innovation, global presence, and market share:
Wynn Strengths
- Diversified revenue streams across Casino, Food & Beverage, Occupancy, and Entertainment
- Strong presence in Macau and Boston Harbor markets
- Favorable debt-to-equity and debt-to-assets ratios
MGM Strengths
- Largest casino revenue among peers
- Favorable weighted average cost of capital (WACC)
- Positive quick ratio indicates liquidity
- Significant presence in Las Vegas Strip and China markets
Wynn Weaknesses
- Unfavorable net margin, ROE, ROIC, and liquidity ratios
- High PE ratio with weak profitability metrics
- Low interest coverage ratio and asset turnover
MGM Weaknesses
- Unfavorable profitability ratios including net margin, ROE, and ROIC
- High debt-to-assets ratio over 135%
- Elevated PE and PB ratios with weak dividend yield
- Interest coverage and asset turnover remain weak
Wynn shows better leverage management and geographic diversification, but struggles with profitability and liquidity. MGM leads in scale and market share but faces heavy indebtedness and profitability challenges. Both companies must address operational efficiency to strengthen their financial health.
The Moat Duel: Analyzing Competitive Defensibility
A structural moat is the sole shield for long-term profits against relentless competition erosion. Here’s how Wynn Resorts and MGM stack up:
Wynn Resorts, Limited: Luxury Experience and Geographic Diversification
Wynn’s moat hinges on premium brand appeal and diversified luxury resorts in Macau and Las Vegas. Its stable margins and growing ROIC underscore efficient capital use. Expansion in Macau and Boston deepens its moat in 2026.
MGM Resorts International: Scale with Integrated Gaming and Entertainment
MGM leverages scale and integrated resorts including iGaming, contrasting Wynn’s luxury niche. However, declining ROIC and shrinking margins signal weakening competitive defenses. Growth depends on digital betting expansion and China market recovery.
Luxury Brand Power vs. Scale Efficiency: The Moat Showdown
Wynn’s growing ROIC and diversified luxury footprint create a deeper, more sustainable moat. MGM’s scale faces margin pressure and value destruction. Wynn is better positioned to defend market share in 2026.
Which stock offers better returns?
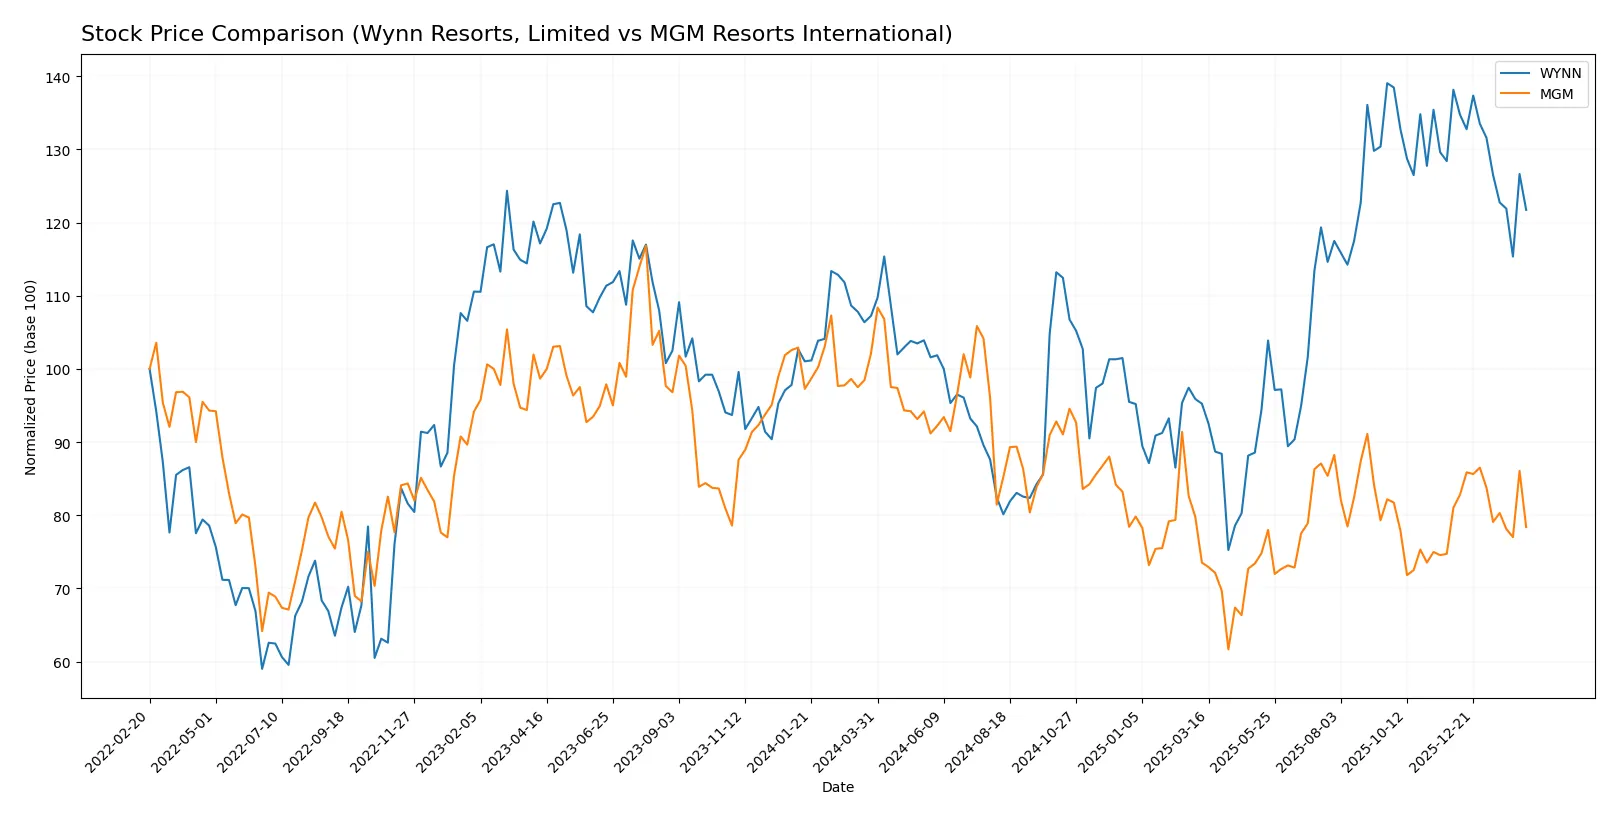
The past year shows contrasting price movements for Wynn Resorts and MGM Resorts, with Wynn gaining significantly before recent pullbacks, while MGM faces steady declines amid shifting trading volumes.
Trend Comparison
Wynn Resorts’ stock rose 13.51% over the past year, signaling a bullish trend despite decelerating gains and recent short-term losses of 11.88%. Volatility remains elevated with a 16.17% standard deviation.
MGM Resorts’ stock declined 23.23% over the last 12 months, confirming a bearish trend with decelerating loss pace. Its recent drop of 3.26% shows continued weakness and low volatility at 4.1%.
Wynn Resorts outperformed MGM Resorts with a positive 13.51% gain versus MGM’s 23.23% loss, delivering the highest market returns among the two over the past year.
Target Prices
Analysts present a cautiously optimistic consensus for Wynn Resorts and MGM Resorts, reflecting growth potential with some valuation risk.
| Company | Target Low | Target High | Consensus |
|---|---|---|---|
| Wynn Resorts, Limited | 133 | 155 | 145.22 |
| MGM Resorts International | 33 | 62 | 41.86 |
Wynn’s consensus target of 145.22 suggests a 28% upside from the current 113.39 price, indicating strong growth expectations. MGM’s 41.86 target implies a 23% potential gain from 34.14, showing moderate analyst confidence amid sector volatility.

Don’t Let Luck Decide Your Entry Point
Optimize your entry points with our advanced ProRealTime indicators. You’ll get efficient buy signals with precise price targets for maximum performance. Start outperforming now!
How do institutions grade them?
Wynn Resorts, Limited Grades
Here are the latest grades from reputable institutions for Wynn Resorts, Limited:
| Grading Company | Action | New Grade | Date |
|---|---|---|---|
| Macquarie | maintain | Outperform | 2026-02-13 |
| Stifel | maintain | Buy | 2026-02-13 |
| Wells Fargo | maintain | Overweight | 2026-02-13 |
| UBS | maintain | Buy | 2026-01-16 |
| Barclays | maintain | Overweight | 2026-01-16 |
| Morgan Stanley | maintain | Overweight | 2026-01-16 |
| Stifel | maintain | Buy | 2025-12-08 |
| Macquarie | maintain | Outperform | 2025-12-08 |
| JP Morgan | maintain | Overweight | 2025-12-08 |
| Jefferies | maintain | Buy | 2025-12-08 |
MGM Resorts International Grades
Below are recent grades from credible grading companies for MGM Resorts International:
| Grading Company | Action | New Grade | Date |
|---|---|---|---|
| Citigroup | maintain | Neutral | 2026-02-09 |
| Stifel | maintain | Buy | 2026-02-06 |
| JP Morgan | maintain | Neutral | 2026-02-06 |
| Macquarie | maintain | Outperform | 2026-02-06 |
| Truist Securities | maintain | Hold | 2026-02-06 |
| Morgan Stanley | downgrade | Underweight | 2026-01-16 |
| Truist Securities | downgrade | Hold | 2026-01-13 |
| Truist Securities | maintain | Buy | 2026-01-02 |
| Barclays | downgrade | Equal Weight | 2025-12-17 |
| Citigroup | downgrade | Neutral | 2025-11-21 |
Which company has the best grades?
Wynn Resorts consistently receives higher grades such as “Buy,” “Outperform,” and “Overweight.” MGM shows more mixed ratings, including downgrades to “Underweight” and “Hold.” Wynn’s stronger grades suggest greater institutional confidence, potentially reflecting better market positioning or fundamentals.
Risks specific to each company
The following categories identify the critical pressure points and systemic threats facing both firms in the 2026 market environment:
1. Market & Competition
Wynn Resorts, Limited
- Operates luxury integrated resorts with a focus on high-end clientele; faces intense competition in Macau and Las Vegas.
MGM Resorts International
- Larger portfolio including regional operations and online gaming; higher exposure to competitive pressures in U.S. and Asian markets.
2. Capital Structure & Debt
Wynn Resorts, Limited
- Favorable debt-to-equity metrics with low leverage; interest coverage at 1.85 signals some strain on debt servicing.
MGM Resorts International
- High debt burden with debt-to-assets at 135.7%; interest coverage of 1.9 indicates elevated financial risk and refinancing vulnerability.
3. Stock Volatility
Wynn Resorts, Limited
- Beta near 1.01 suggests market-level volatility; price range is broad but less volatile than MGM.
MGM Resorts International
- Beta 1.40 signals higher volatility; wider trading volume and price swings reflect greater market sensitivity.
4. Regulatory & Legal
Wynn Resorts, Limited
- Macau operations expose it to regulatory shifts in China’s gaming policies; U.S. regulations also evolving in gaming and hospitality sectors.
MGM Resorts International
- Similar regulatory exposure including online betting; broader U.S. footprint means navigating multiple state-level compliance regimes.
5. Supply Chain & Operations
Wynn Resorts, Limited
- Integrated resort operations require sophisticated supply chains; luxury positioning demands high service standards and operational efficiency.
MGM Resorts International
- Larger scale and diversified operations increase complexity; reliance on third-party suppliers and staffing intensifies operational risks.
6. ESG & Climate Transition
Wynn Resorts, Limited
- No explicit ESG data here; luxury resorts face pressures on sustainability and energy usage amid rising regulatory scrutiny.
MGM Resorts International
- Larger footprint implies higher ESG exposure; growing investor focus on carbon footprint and social governance could impact access to capital.
7. Geopolitical Exposure
Wynn Resorts, Limited
- Significant revenue from Macau exposes it to China-U.S. tensions and regulatory clampdowns.
MGM Resorts International
- Also exposed to geopolitical risks in Macau; U.S. operations less affected but global economic shifts impact tourism demand.
Which company shows a better risk-adjusted profile?
Wynn’s lower leverage and more stable stock volatility offer a comparatively better risk-adjusted profile. Its main risk is regulatory uncertainty in Macau. MGM’s largest risk is high financial leverage, elevating default risk amid operational pressures. Wynn’s Altman Z-score of 1.28 versus MGM’s 0.74 signals relatively less distress. Despite Wynn’s weaker profitability, its conservative capital structure and lower beta provide a defensive edge in this volatile sector.
Final Verdict: Which stock to choose?
Wynn Resorts stands out with its ability to generate steady free cash flow and maintain a growing ROIC trend, signaling efficient capital use. Its point of vigilance lies in its elevated debt and volatile earnings quality. This stock might suit an aggressive growth portfolio willing to tolerate operational risks.
MGM offers a strategic moat through its broad market presence and diversified revenue streams, providing a recurring revenue safety net. Compared to Wynn, it exhibits higher financial leverage and weaker profitability metrics, suggesting a more cautious risk profile. MGM could fit a GARP (Growth at a Reasonable Price) portfolio seeking stability.
If you prioritize efficient capital deployment and growth momentum, Wynn Resorts appears the compelling choice due to its improving ROIC trajectory and cash generation. However, if you seek a defensive position with scale benefits and recurring revenues, MGM offers better stability despite its value destruction concerns. Both choices require careful attention to leverage and earnings risks.
Disclaimer: Investment carries a risk of loss of initial capital. The past performance is not a reliable indicator of future results. Be sure to understand risks before making an investment decision.
Go Further
I encourage you to read the complete analyses of Wynn Resorts, Limited and MGM Resorts International to enhance your investment decisions: