Home > Comparison > Healthcare > MTD vs WAT
The strategic rivalry between Mettler-Toledo International Inc. and Waters Corporation shapes the future of healthcare diagnostics. Mettler-Toledo operates as a capital-intensive precision instrument manufacturer with diverse global segments. Waters Corporation focuses on high-tech analytical workflow solutions, specializing in chromatography and mass spectrometry. This head-to-head contrasts Mettler-Toledo’s industrial scale with Waters’ innovation-driven model. This analysis aims to identify which trajectory offers superior risk-adjusted returns for a diversified portfolio.
Table of contents
Companies Overview
Mettler-Toledo and Waters Corporation both shape the global medical diagnostics and research market with distinct strengths.
Mettler-Toledo International Inc.: Precision Instruments Leader
Mettler-Toledo dominates the precision instruments market with a broad portfolio spanning laboratory, industrial, and retail weighing solutions. Its revenue engine centers on manufacturing and supplying advanced analytical and weighing technology across diverse sectors including life sciences and food retail. In 2026, it emphasized expanding its integrated software platforms to enhance data analytics and operational efficiency.
Waters Corporation: Specialty Measurement Innovator
Waters Corporation specializes in analytical workflow solutions, focusing on liquid chromatography and mass spectrometry systems. It generates revenue by designing, manufacturing, and servicing high-performance instruments and consumables for pharmaceutical, environmental, and life science research. Its 2026 strategy prioritizes advancing software integration to improve instrument connectivity and customer workflow optimization.
Strategic Collision: Similarities & Divergences
Both firms operate in healthcare diagnostics but diverge in approach: Mettler-Toledo offers a diversified instrument ecosystem, while Waters pursues specialized, software-driven analytical solutions. Their main battleground is precision measurement technology for research and industrial applications. Investors face distinct profiles—Mettler-Toledo’s broad market reach contrasts with Waters’ focused innovation in chromatography and mass spectrometry.
Income Statement Comparison
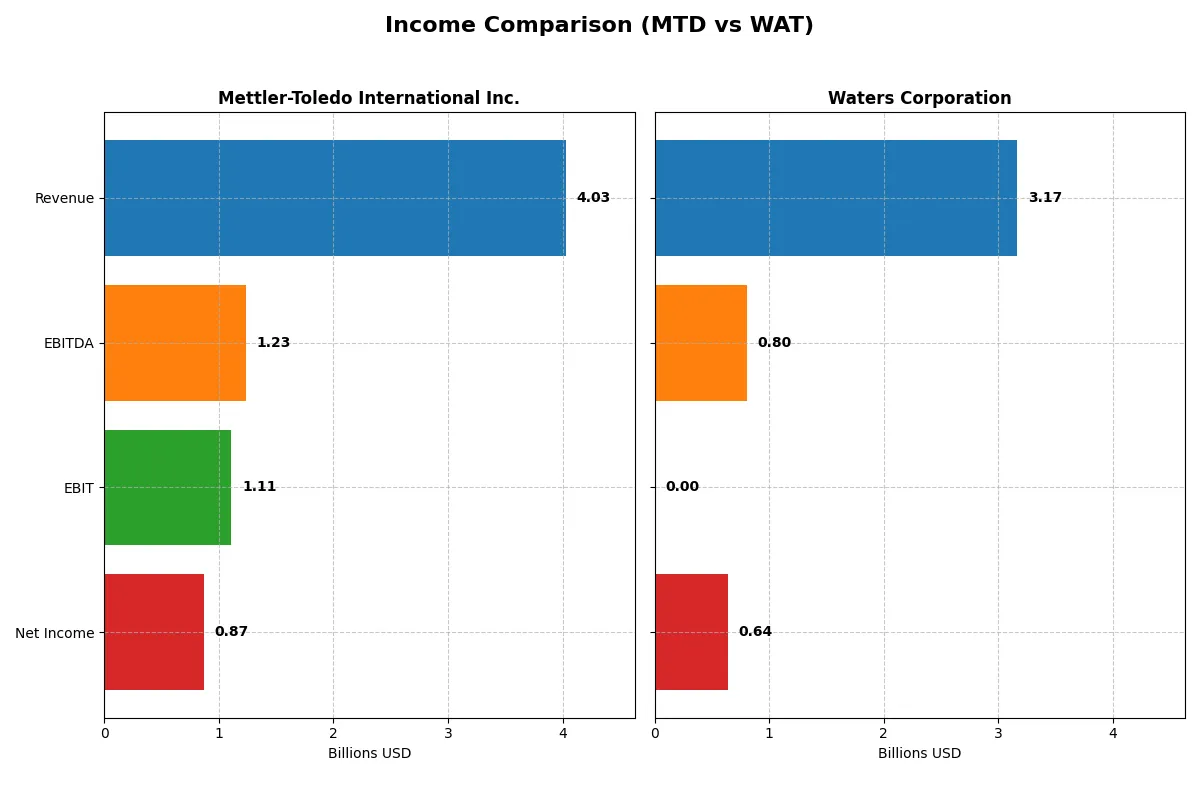
This data dissects the core profitability and scalability of both corporate engines to reveal who dominates the bottom line:
| Metric | Mettler-Toledo International Inc. (MTD) | Waters Corporation (WAT) |
|---|---|---|
| Revenue | 4.03B | 3.17B |
| Cost of Revenue | 1.71B | 1.29B |
| Operating Expenses | 1.20B | 1.03B |
| Gross Profit | 2.32B | 1.88B |
| EBITDA | 1.23B | 803M |
| EBIT | 1.11B | — |
| Interest Expense | 68.5M | -50.8M |
| Net Income | 869.2M | 642.6M |
| EPS | 42.17 | 10.8 |
| Fiscal Year | 2025 | 2025 |
Income Statement Analysis: The Bottom-Line Duel
This income statement comparison reveals the true operational efficiency and profitability momentum of two industry leaders through their recent financial results.
Mettler-Toledo International Inc. Analysis
Mettler-Toledo’s revenue rose steadily to $4.03B in 2025, with net income climbing to $869M, reflecting a solid growth trajectory. The company maintains a robust gross margin of 57.5% and a strong net margin of 21.6%, underscoring efficient cost control and operational leverage. Despite slight margin pressure, MTD shows healthy earnings momentum and disciplined capital allocation.
Waters Corporation Analysis
Waters Corporation posted $3.17B revenue in 2025, growing modestly but with net income down to $643M, signaling margin compression. Its gross margin remains favorable at 59.3%, but the absence of reported EBIT margin and a declining net margin of 20.3% highlight operational challenges. Waters demonstrates weaker earnings growth and margin stability compared to its peer, facing efficiency headwinds.
Margin Strength vs. Earnings Resilience
Mettler-Toledo outperforms Waters with superior net income growth and consistent margin expansion, signaling a more resilient profit engine. Waters, despite decent revenue growth, struggles with shrinking profitability and operational efficiency. For investors prioritizing durable earnings and margin quality, Mettler-Toledo’s profile appears more compelling and fundamentally stronger.
Financial Ratios Comparison
These vital ratios act as a diagnostic tool to expose the underlying fiscal health, valuation premiums, and capital efficiency of the companies compared below:
| Ratios | Mettler-Toledo International Inc. (MTD) | Waters Corporation (WAT) |
|---|---|---|
| ROE | -36.77% (2025) | 0% (2025) |
| ROIC | 35.46% (2025) | 0% (2025) |
| P/E | 33.06 (2025) | 35.17 (2025) |
| P/B | -1215.71 (2025) | 0 (2025) |
| Current Ratio | 1.14 (2025) | 0 (2025) |
| Quick Ratio | 0.81 (2025) | 0 (2025) |
| D/E (Debt to Equity) | -99.14 (2025) | 0 (2025) |
| Debt-to-Assets | 63.12% (2025) | 0% (2025) |
| Interest Coverage | 16.32 (2025) | -15.81 (2025) |
| Asset Turnover | 1.08 (2025) | 0 (2025) |
| Fixed Asset Turnover | 4.76 (2025) | 0 (2025) |
| Payout ratio | 0% (2025) | 0% (2025) |
| Dividend yield | 0% (2025) | 0% (2025) |
| Fiscal Year | 2025 | 2025 |
Efficiency & Valuation Duel: The Vital Signs
Financial ratios serve as a company’s DNA, exposing hidden risks and underlying operational strength investors must decode.
Mettler-Toledo International Inc.
Mettler-Toledo displays strong operational efficiency with a 35.5% ROIC well above its 9.8% WACC, signaling robust value creation. However, its P/E of 33.1 marks the stock as stretched relative to earnings. The lack of dividends shifts focus to reinvestment in R&D (4.95% of revenue), fueling future growth despite a negative ROE indicating recent equity challenges.
Waters Corporation
Waters posts a favorable net margin of 20.3% but lacks key profitability metrics like ROE and ROIC, limiting insight into operational strength. Its P/E at 35.2 suggests an expensive valuation without clear returns on invested capital. The absence of dividends highlights reliance on R&D (6.18% of revenue) for value generation, though liquidity ratios remain unavailable, raising caution.
Premium Valuation vs. Operational Safety
Mettler-Toledo offers a better balance of operational efficiency and capital returns despite stretched valuation and a negative ROE anomaly. Waters’ unclear profitability and missing liquidity data pose greater risk. Mettler’s profile suits investors prioritizing capital allocation; Waters fits those betting on growth without immediate financial clarity.
Which one offers the Superior Shareholder Reward?
Mettler-Toledo (MTD) and Waters Corporation (WAT) both forgo dividends, prioritizing reinvestment and buybacks. MTD boasts zero dividend yield but delivers robust free cash flow of 41.2/share and a high free cash flow coverage ratio (~89%). It aggressively repurchases shares, enhancing shareholder value. WAT also pays no dividends, with lower free cash flow per share (9.1) and a weaker buyback intensity implied by lower free cash flow coverage (~83%). MTD’s higher operating margins and superior capital allocation imply a more sustainable, long-term return model. I conclude MTD offers the more attractive total shareholder reward in 2026.
Comparative Score Analysis: The Strategic Profile
The radar chart reveals the fundamental DNA and trade-offs shaping Mettler-Toledo International and Waters Corporation’s financial profiles:
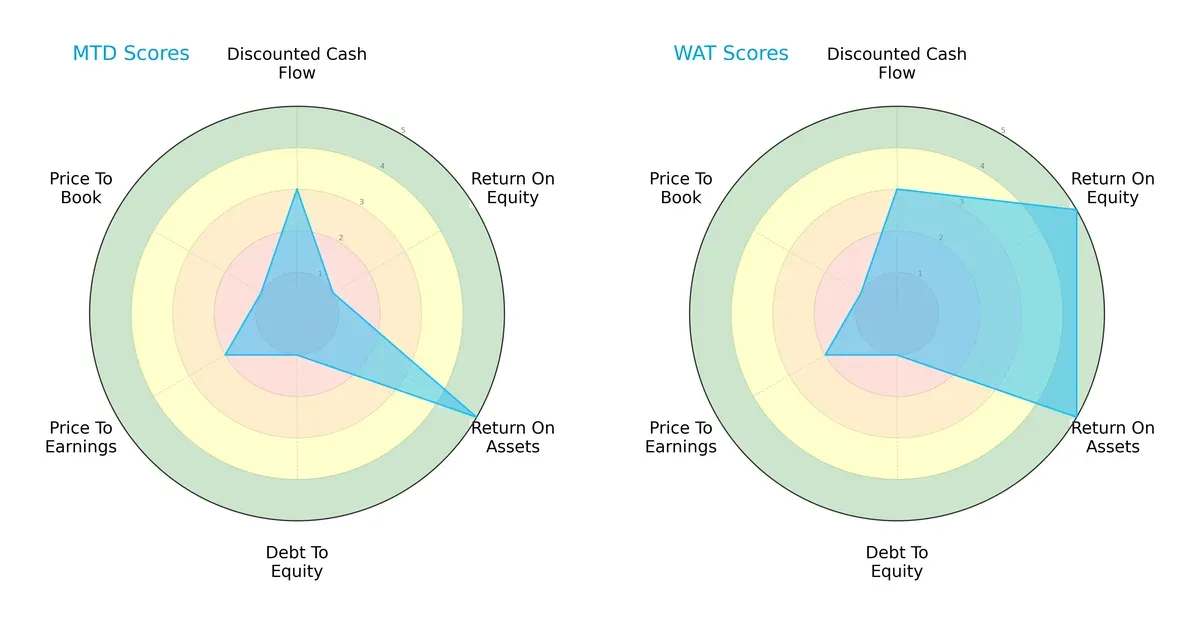
Waters Corporation demonstrates superior profitability with a top ROE (5) and strong ROA (5), reflecting efficient capital deployment. Mettler-Toledo shows strength in asset utilization (ROA 5) but suffers from weak equity returns (ROE 1). Both firms share low debt-to-equity scores (1), signaling high leverage risk. Valuation metrics (PE and PB) remain unfavorable for both. Waters offers a more balanced profile, while Mettler-Toledo leans heavily on asset efficiency amid financial strain.
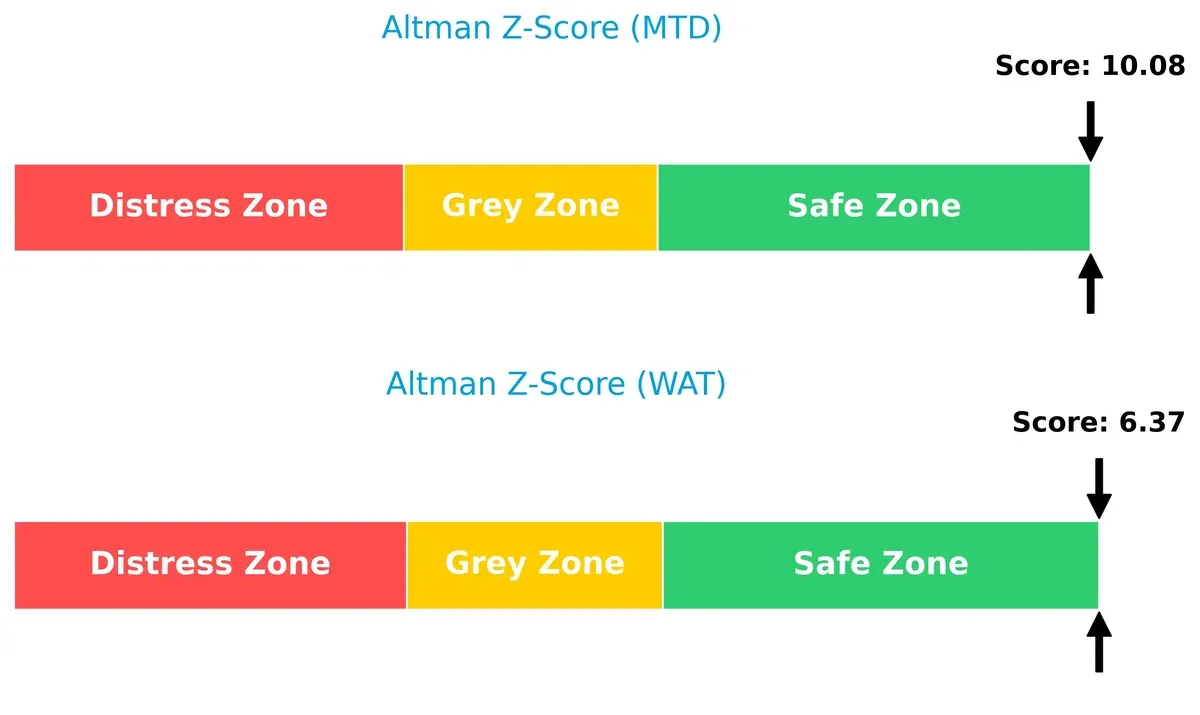
Bankruptcy Risk: Solvency Showdown
The Altman Z-Scores indicate both companies sit comfortably in the safe zone, but Mettler-Toledo’s higher score (10.08 vs. 6.37) suggests stronger solvency and lower bankruptcy risk in this cycle:
Financial Health: Quality of Operations
Mettler-Toledo and Waters both hold average Piotroski F-Scores of 6, indicating moderate financial health with no glaring red flags in operational metrics:
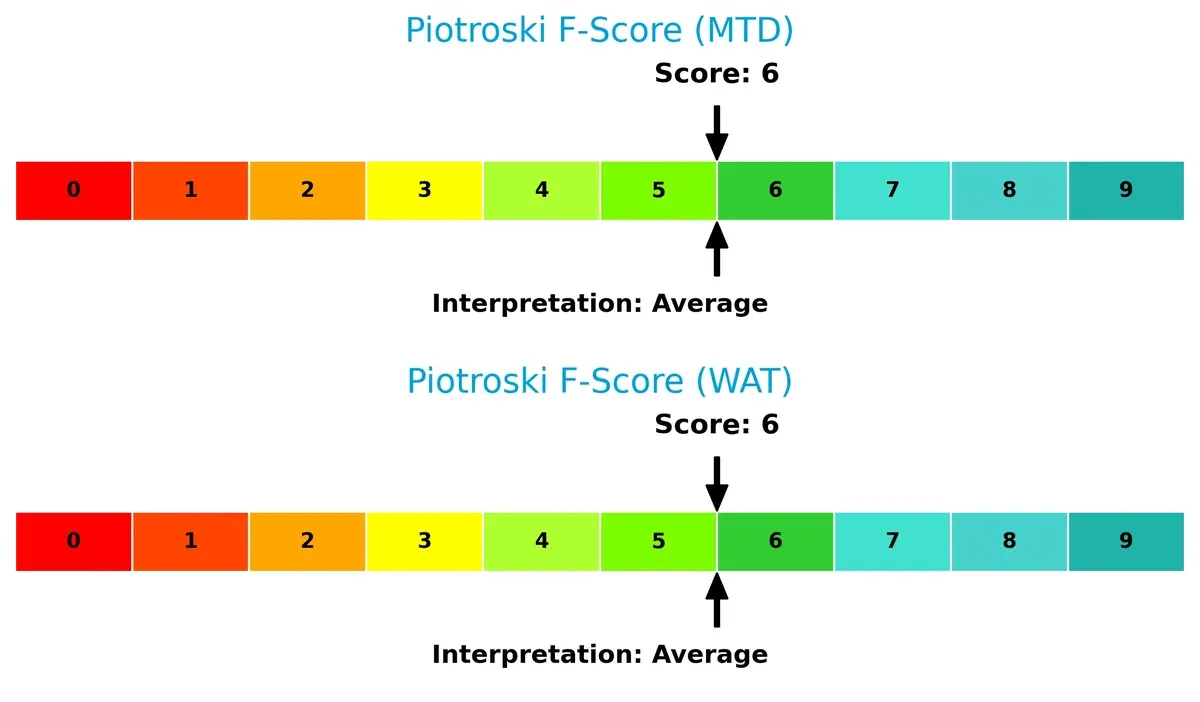
This parity suggests both firms maintain decent internal financial controls, though neither excels in peak financial robustness.
How are the two companies positioned?
This section dissects the operational DNA of MTD and WAT by comparing their revenue distribution by segment and internal strengths and weaknesses. The goal is to confront their economic moats to identify which model delivers the most resilient, sustainable competitive advantage today.
Revenue Segmentation: The Strategic Mix
This visual comparison dissects how Mettler-Toledo International Inc. and Waters Corporation diversify income streams and where their primary sector bets lie:
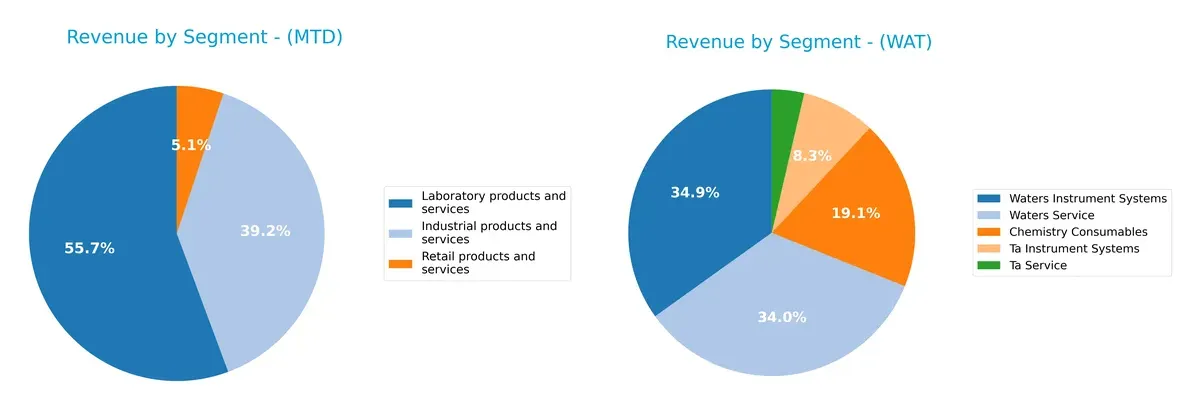
Mettler-Toledo anchors revenue in Laboratory products and services with $2.24B, followed by Industrial at $1.58B, showing moderate diversification. Waters leans heavily on Waters Instrument Systems at $1.03B and Waters Service at $1.01B, creating a near duopoly in its mix. MTD’s broader spread mitigates concentration risk, while WAT’s focus signals strong ecosystem lock-in but exposes it to sector-specific disruption.
Strengths and Weaknesses Comparison
This table compares the Strengths and Weaknesses of Mettler-Toledo (MTD) and Waters Corporation (WAT):
MTD Strengths
- Diversified revenue across industrial, laboratory, and retail segments
- Strong net margin at 21.59%
- ROIC significantly exceeds WACC at 35.46%
- Favorable asset and fixed asset turnover ratios
- Solid global presence spanning Americas, Asia, and Europe
WAT Strengths
- Diversified product portfolio including consumables, instrument systems, and services
- Positive net margin at 20.3%
- Favorable price-to-book ratio
- Global footprint across Americas, Asia Pacific, and Europe
- Stable revenue in key segments like Waters Instrument Systems
MTD Weaknesses
- Negative ROE at -3677.41% signals accounting or nonrecurring items
- High debt-to-assets ratio at 63.12% raises leverage concerns
- Unfavorable P/E of 33.06 relative to peers
- Neutral liquidity ratios near 1.14 current ratio
- Zero dividend yield limits income appeal
WAT Weaknesses
- Zero values for ROE, ROIC, and liquidity ratios indicate lack of recent data or poor performance
- Unfavorable P/E ratio at 35.17
- Negative interest coverage suggests financial stress
- Unfavorable asset turnover metrics
- Zero dividend yield reduces shareholder returns
Overall, MTD shows operational strength with high profitability and efficient asset use, despite some financial leverage risks. WAT presents a more challenged financial profile with weaker profitability metrics and coverage ratios, highlighting the need for strategic focus on financial health.
The Moat Duel: Analyzing Competitive Defensibility
A structural moat alone protects long-term profits from relentless competitive erosion. Let’s dissect how Mettler-Toledo and Waters defend their turf:
Mettler-Toledo International Inc.: Precision Instruments with High ROIC Moat
Mettler-Toledo leverages Intangible Assets and specialized precision technology, reflected in a robust 25.7% ROIC above WACC. Its stable margins and global reach support sustained value creation. New product innovations and expanding industrial software deepen this moat in 2026.
Waters Corporation: Analytical Workflow Solutions with Innovation-Driven Moat
Waters relies on advanced chromatography and mass spectrometry technology, creating switching costs in scientific research. However, declining ROIC and negative margin trends signal weakening competitive defensibility. Opportunities in emerging markets may partially offset this pressure.
ROIC Supremacy vs. Innovation Challenges
Mettler-Toledo exhibits a wider, more durable moat, consistently creating value with stable profitability and efficient capital use. Waters faces a tougher fight, grappling with declining returns and margin compression. Mettler-Toledo is better positioned to defend and grow its market share.
Which stock offers better returns?
Over the past 12 months, Mettler-Toledo International Inc. showed a modest bullish trend with decelerating gains, while Waters Corporation experienced a clear bearish trend marked by steady price declines.
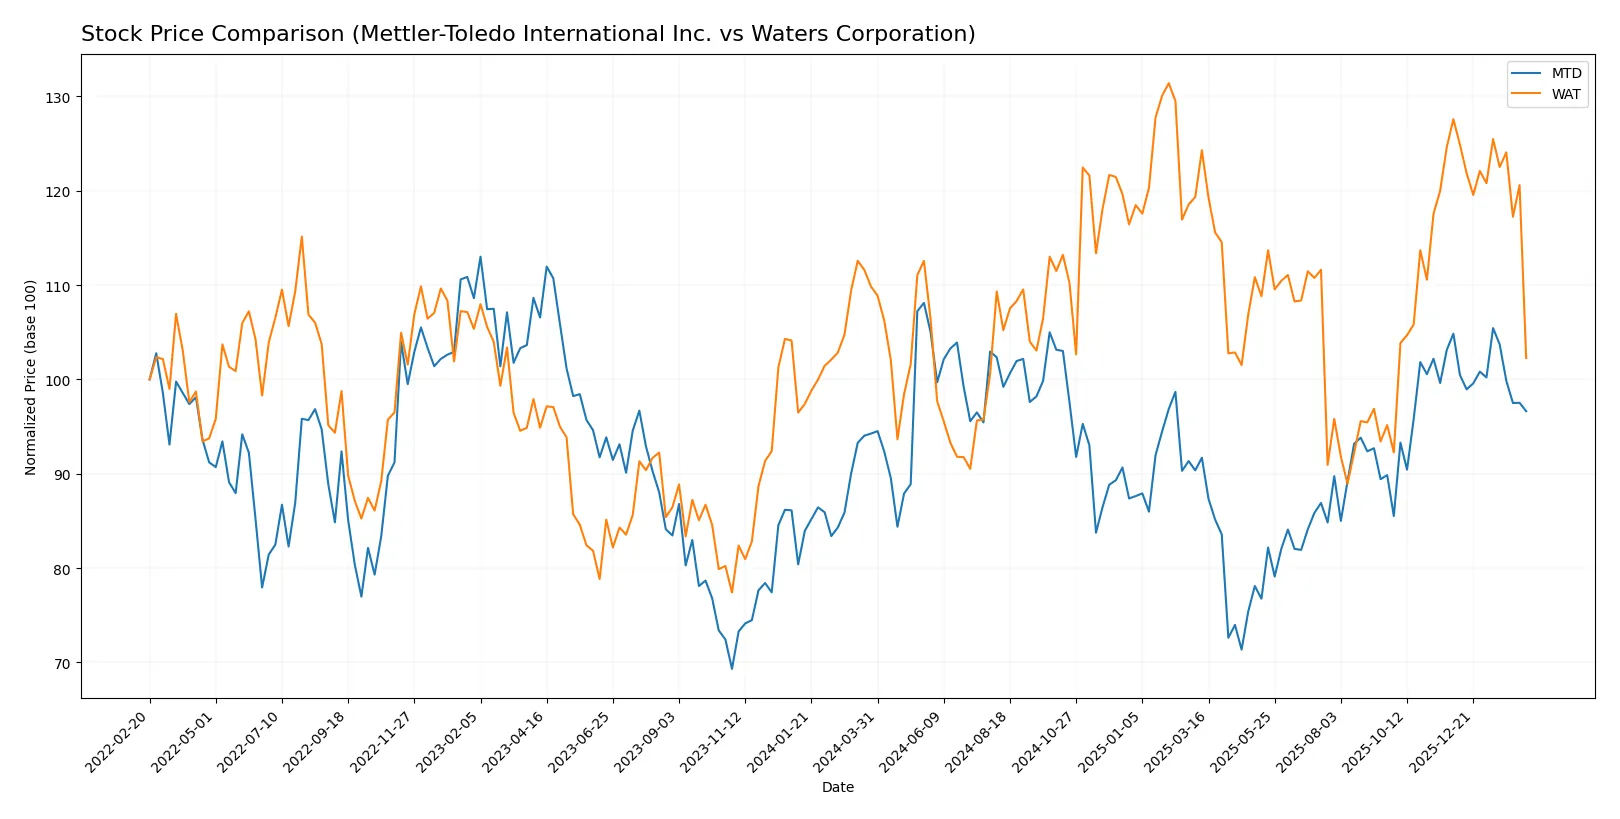
Trend Comparison
Mettler-Toledo’s stock rose 2.51% over the past year, indicating a bullish trend with deceleration. The price ranged between 1004.96 and 1522.75, reflecting moderate volatility at 117.27.
Waters Corporation’s stock fell 6.89% over the same period, confirming a bearish trend with deceleration. Its price moved between 281.2 and 415.48, showing lower volatility of 34.12.
Mettler-Toledo delivered the highest market performance with a positive return, contrasting with Waters Corporation’s negative trend over the past year.
Target Prices
The target price consensus for Mettler-Toledo International Inc. and Waters Corporation reflects moderate upside potential.
| Company | Target Low | Target High | Consensus |
|---|---|---|---|
| Mettler-Toledo International Inc. | 1,400 | 1,600 | 1,485 |
| Waters Corporation | 363 | 480 | 410.13 |
Analysts expect Mettler-Toledo’s shares to appreciate roughly 9% from the current 1,361 price. Waters shows a stronger upside potential near 27% versus the current 323 price.

Don’t Let Luck Decide Your Entry Point
Optimize your entry points with our advanced ProRealTime indicators. You’ll get efficient buy signals with precise price targets for maximum performance. Start outperforming now!
How do institutions grade them?
Here are the latest institutional grades assigned to Mettler-Toledo International Inc. and Waters Corporation:
Mettler-Toledo International Inc. Grades
The table below summarizes recent grades from reputable financial institutions for Mettler-Toledo:
| Grading Company | Action | New Grade | Date |
|---|---|---|---|
| Morgan Stanley | Maintain | Equal Weight | 2026-02-10 |
| Barclays | Maintain | Overweight | 2025-12-15 |
| Wells Fargo | Maintain | Equal Weight | 2025-12-15 |
| Stifel | Maintain | Buy | 2025-11-10 |
| Wells Fargo | Maintain | Equal Weight | 2025-11-10 |
| Barclays | Maintain | Overweight | 2025-11-10 |
| Citigroup | Maintain | Buy | 2025-11-10 |
| JP Morgan | Maintain | Neutral | 2025-10-09 |
| Evercore ISI Group | Maintain | Outperform | 2025-10-07 |
| Barclays | Maintain | Overweight | 2025-10-02 |
Waters Corporation Grades
The following table shows recent grades from credible firms for Waters Corporation:
| Grading Company | Action | New Grade | Date |
|---|---|---|---|
| Wells Fargo | Maintain | Equal Weight | 2026-02-11 |
| UBS | Maintain | Neutral | 2026-02-10 |
| B of A Securities | Maintain | Neutral | 2026-02-10 |
| Guggenheim | Maintain | Buy | 2026-02-10 |
| Wells Fargo | Maintain | Equal Weight | 2025-12-15 |
| Wolfe Research | Upgrade | Outperform | 2025-12-10 |
| Wells Fargo | Maintain | Equal Weight | 2025-11-05 |
| TD Cowen | Maintain | Hold | 2025-11-05 |
| JP Morgan | Maintain | Neutral | 2025-10-09 |
| Deutsche Bank | Maintain | Hold | 2025-08-05 |
Which company has the best grades?
Mettler-Toledo consistently receives stronger grades like Overweight, Buy, and Outperform. Waters Corporation shows more Neutral and Hold ratings with fewer Buy and Outperform grades. Investors may view Mettler-Toledo’s superior grades as a sign of stronger institutional confidence.
Risks specific to each company
The following categories identify the critical pressure points and systemic threats facing both firms in the 2026 market environment:
1. Market & Competition
Mettler-Toledo International Inc.
- Operates globally with diversified segments but faces intense competition in precision instruments.
Waters Corporation
- Focuses on specialty measurement solutions, contending with strong competitors in chromatography and mass spectrometry.
2. Capital Structure & Debt
Mettler-Toledo International Inc.
- High debt-to-assets ratio at 63.1% signals elevated leverage risk despite strong interest coverage.
Waters Corporation
- Exhibits favorable debt metrics with low leverage, indicating a stronger balance sheet and lower financial risk.
3. Stock Volatility
Mettler-Toledo International Inc.
- Beta of 1.44 shows above-market volatility, increasing investment risk.
Waters Corporation
- Lower beta of 1.18 reflects more moderate stock price fluctuations relative to the market.
4. Regulatory & Legal
Mettler-Toledo International Inc.
- Subject to strict healthcare and industrial regulations worldwide, with potential compliance costs.
Waters Corporation
- Faces regulatory scrutiny in pharmaceutical and environmental sectors, with risks tied to evolving standards.
5. Supply Chain & Operations
Mettler-Toledo International Inc.
- Complex supply chain spanning multiple continents, vulnerable to disruptions and cost inflation.
Waters Corporation
- Operates globally but with smaller employee base, possibly more agile but reliant on specialized suppliers.
6. ESG & Climate Transition
Mettler-Toledo International Inc.
- Increasing pressure to reduce environmental footprint and enhance sustainability in manufacturing.
Waters Corporation
- ESG efforts critical to maintaining reputation with life science clients demanding responsible practices.
7. Geopolitical Exposure
Mettler-Toledo International Inc.
- Significant exposure to US, European, and Chinese markets, subject to trade tensions and tariffs.
Waters Corporation
- Also exposed globally but with a more concentrated US and European focus, reducing China-related risks.
Which company shows a better risk-adjusted profile?
Mettler-Toledo’s highest risk lies in its elevated leverage and market volatility, threatening financial flexibility. Waters Corporation’s main risk is lower profitability and weaker operating metrics, despite a stronger balance sheet. I judge Waters to have a better risk-adjusted profile, supported by its safer Altman Z-score and moderate volatility. However, Waters’ lack of robust return metrics tempers enthusiasm. The contrasting debt-to-assets ratio—63.1% for Mettler-Toledo versus near zero for Waters—justifies caution on Mettler-Toledo’s capital structure despite its operational strengths.
Final Verdict: Which stock to choose?
Mettler-Toledo International excels as a powerhouse of operational efficiency and value creation. Its strong economic moat, driven by a return on invested capital far exceeding its cost of capital, signals durable competitive advantage. The main point of vigilance remains its elevated debt-to-assets ratio, which calls for cautious balance sheet monitoring. This stock suits aggressive growth portfolios that tolerate some leverage risk.
Waters Corporation’s strategic moat lies in its steady recurring revenues and strong research and development commitment, underpinning long-term innovation. Relative to Mettler-Toledo, it offers a safer balance sheet profile with higher liquidity, though its declining ROIC trend raises questions on capital efficiency. It fits well within Growth at a Reasonable Price (GARP) strategies seeking moderate stability with growth potential.
If you prioritize resilient value creation and operational excellence, Mettler-Toledo outshines as the compelling choice due to its robust economic moat and superior capital returns. However, if you seek greater balance sheet safety and a more conservative growth profile, Waters presents better stability despite its recent challenges in profitability trends. Each represents a distinct analytical scenario aligned with different investor risk appetites and strategic goals.
Disclaimer: Investment carries a risk of loss of initial capital. The past performance is not a reliable indicator of future results. Be sure to understand risks before making an investment decision.
Go Further
I encourage you to read the complete analyses of Mettler-Toledo International Inc. and Waters Corporation to enhance your investment decisions: