Home > Comparison > Healthcare > TMO vs MTD
The strategic rivalry between Thermo Fisher Scientific Inc. and Mettler-Toledo International Inc. shapes the healthcare diagnostics and research sector. Thermo Fisher operates as a capital-intensive life sciences solutions provider with broad biopharma and analytical instruments exposure. Mettler-Toledo focuses on precision instruments and software with a leaner, high-margin industrial model. This analysis contrasts their growth trajectories and risk profiles to identify which offers superior risk-adjusted returns for a diversified portfolio.
Table of contents
Companies Overview
Thermo Fisher Scientific and Mettler-Toledo International dominate critical niches within the medical diagnostics and research industry.
Thermo Fisher Scientific Inc.: Global Life Sciences Powerhouse
Thermo Fisher Scientific leads in life sciences solutions with a $220B market cap. It generates revenue by selling reagents, instruments, and biopharma services globally. In 2026, the company emphasized innovation across diagnostics, genetic sciences, and clinical research, leveraging a diverse product portfolio to serve pharmaceuticals, biotech, and healthcare sectors.
Mettler-Toledo International Inc.: Precision Measurement Specialist
Mettler-Toledo excels in precision instruments with a $29B market cap. It profits from laboratory and industrial instruments, including balances, sensors, and analytics software. In 2026, the firm focused on expanding its laboratory and industrial solutions across global markets, targeting life sciences, food, and chemical industries with integrated hardware and software platforms.
Strategic Collision: Similarities & Divergences
Both companies prioritize advanced instrumentation but differ in scope. Thermo Fisher operates a broad life sciences ecosystem, while Mettler-Toledo specializes in precision measurement and software integration. Their primary battleground is the research and testing laboratory market, where innovation and reliability drive customer loyalty. Thermo Fisher offers scale and diversification; Mettler-Toledo provides niche precision with software-enabled solutions.
Income Statement Comparison
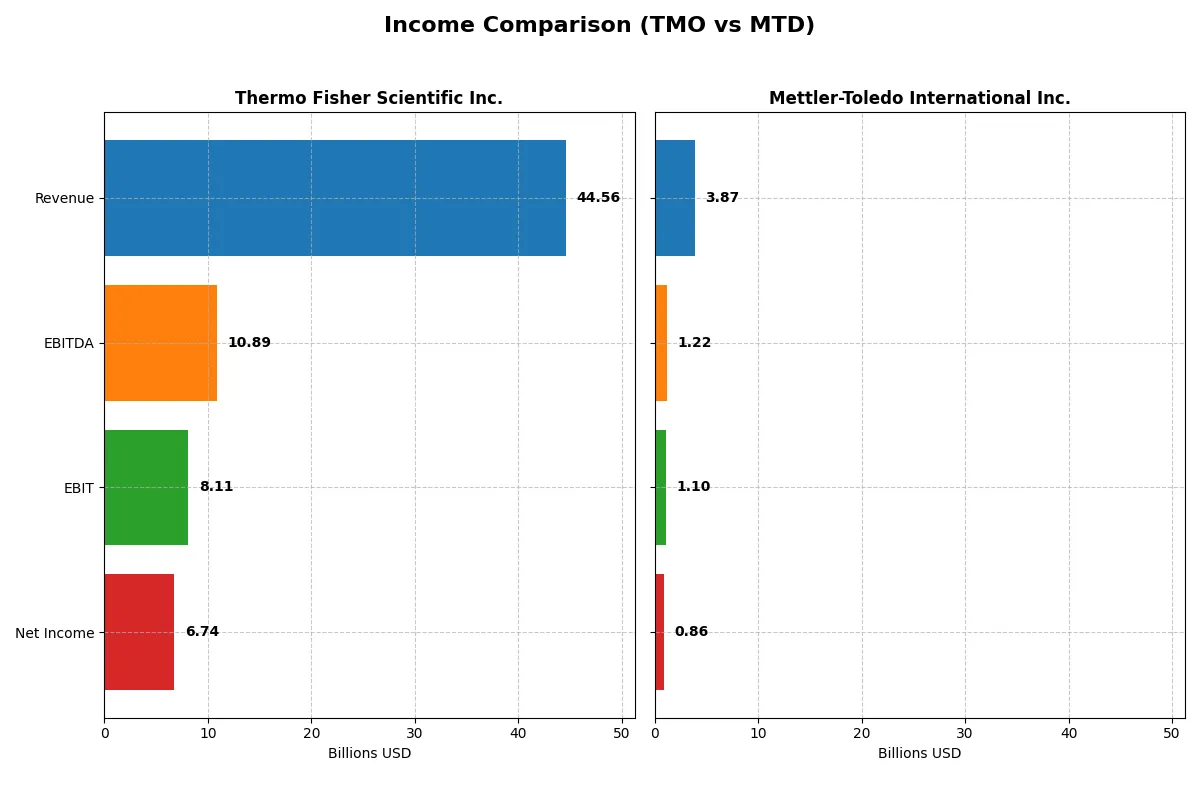
This data dissects the core profitability and scalability of both corporate engines to reveal who dominates the bottom line:
| Metric | Thermo Fisher Scientific Inc. (TMO) | Mettler-Toledo International Inc. (MTD) |
|---|---|---|
| Revenue | 44.6B | 3.87B |
| Cost of Revenue | 27.8B | 1.62B |
| Operating Expenses | 8.67B | 1.13B |
| Gross Profit | 16.8B | 2.25B |
| EBITDA | 10.9B | 1.22B |
| EBIT | 8.11B | 1.10B |
| Interest Expense | 1.42B | 75M |
| Net Income | 6.74B | 863M |
| EPS | 17.77 | 40.67 |
| Fiscal Year | 2025 | 2024 |
Income Statement Analysis: The Bottom-Line Duel
This income statement comparison reveals the operational efficiency and profitability momentum of Thermo Fisher Scientific and Mettler-Toledo.
Thermo Fisher Scientific Inc. Analysis
Thermo Fisher’s revenue climbed steadily to $44.6B in 2025, but net income declined to $6.7B, signaling pressure on profitability. Its gross margin slipped to 37.7%, while net margin held at 15.1%. Despite a recent drop in EBIT, the company maintains solid scale but faces margin compression.
Mettler-Toledo International Inc. Analysis
Mettler-Toledo posted $3.87B revenue in 2024, growing modestly but with robust margin expansion. Gross margin soared above 58%, and net margin reached 22.3%. Net income surged 43% over five years to $863M, reflecting strong operational leverage and consistently improving profitability.
Margin Power vs. Revenue Scale
Mettler-Toledo outperforms Thermo Fisher on margin quality and profit growth, despite its smaller top line. Thermo Fisher’s scale is impressive, yet margin erosion and net income decline weaken its earnings power. Investors prioritizing stable margin expansion and earnings momentum may find Mettler-Toledo’s profile more compelling.
Financial Ratios Comparison
These vital ratios act as a diagnostic tool to expose the underlying fiscal health, valuation premiums, and capital efficiency of the companies compared below:
| Ratios | Thermo Fisher Scientific Inc. (TMO) | Mettler-Toledo International Inc. (MTD) |
|---|---|---|
| ROE | 12.6% | -6.8% |
| ROIC | 7.6% | 41.1% |
| P/E | 32.3 | 30.1 |
| P/B | 4.08 | -204.7 |
| Current Ratio | 1.89 | 1.02 |
| Quick Ratio | 1.53 | 0.73 |
| D/E (Debt-to-Equity) | 0.74 | -16.8 |
| Debt-to-Assets | 35.7% | 65.8% |
| Interest Coverage | 5.7 | 15.1 |
| Asset Turnover | 0.40 | 1.20 |
| Fixed Asset Turnover | 4.22 | 5.03 |
| Payout Ratio | 9.4% | 0% |
| Dividend Yield | 0.29% | 0% |
| Fiscal Year | 2025 | 2024 |
Efficiency & Valuation Duel: The Vital Signs
Financial ratios form a company’s DNA, exposing hidden risks and spotlighting operational excellence critical for investment decisions.
Thermo Fisher Scientific Inc.
Thermo Fisher posts a moderate ROE of 12.6% with a solid net margin of 15.1%, reflecting steady profitability but modest shareholder returns. Its P/E ratio at 32.3 signals a stretched valuation. The company favors reinvestment in R&D over dividends, supporting long-term growth amid a slightly favorable ratio profile.
Mettler-Toledo International Inc.
Mettler-Toledo delivers a strong net margin of 22.3% and an exceptional ROIC of 41.1%, but a negative ROE (-680%) flags severe equity distortion. Its high P/E of 30.1 and elevated debt-to-assets ratio (65.8%) reveal valuation and leverage concerns. The firm lacks dividends, focusing instead on innovation-driven reinvestment.
Valuation Stretch vs. Operational Powerhouse
Thermo Fisher balances solid profitability and prudent liquidity with a stretched valuation, while Mettler-Toledo’s operational efficiency is offset by financial risk and negative equity returns. Investors seeking stability may prefer Thermo Fisher; those targeting high operational returns but willing to accept risk might consider Mettler-Toledo’s profile.
Which one offers the Superior Shareholder Reward?
Thermo Fisher Scientific Inc. (TMO) pays a modest 0.29% dividend yield with a conservative 9.4% payout ratio, supported by strong free cash flow (16.7/share). Its steady buyback program enhances shareholder returns sustainably. Mettler-Toledo International Inc. (MTD) offers no dividends but prioritizes aggressive reinvestment and consistent buybacks, fueling superior growth with 22.3% net margins and robust free cash flow (40.7/share). I see MTD’s capital allocation favors long-term value creation through growth rather than income. For 2026, MTD’s reinvestment and buyback intensity imply a more attractive total return profile compared to TMO’s modest dividends and buybacks.
Comparative Score Analysis: The Strategic Profile
The radar chart reveals the fundamental DNA and trade-offs of Thermo Fisher Scientific Inc. and Mettler-Toledo International Inc.:
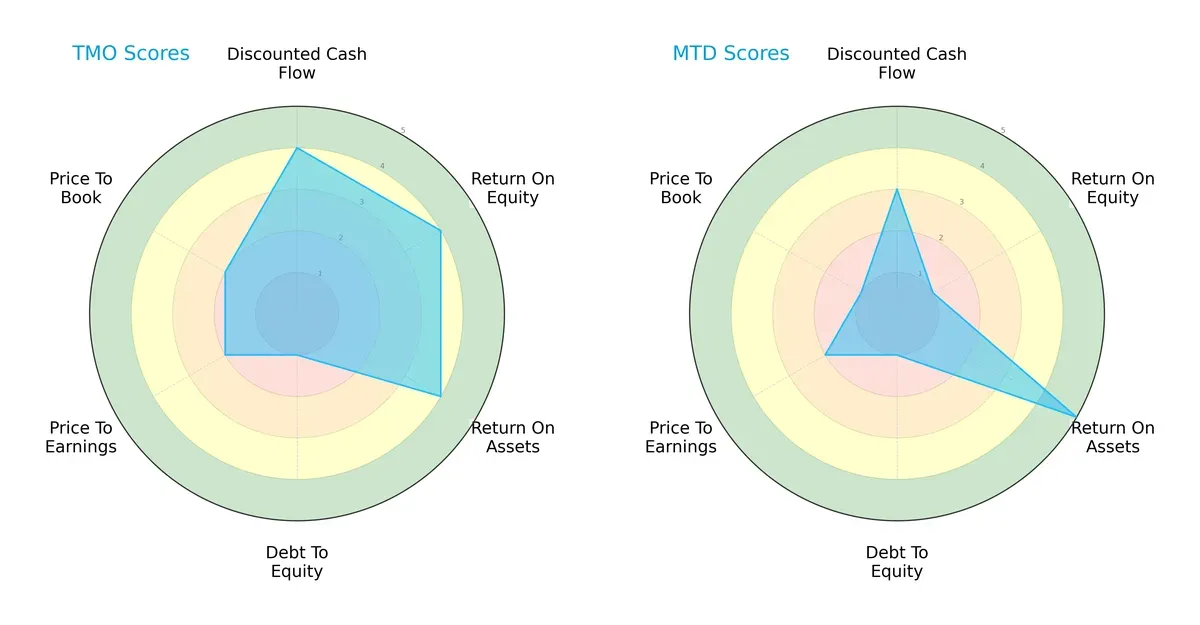
Thermo Fisher shows strength in discounted cash flow (4), ROE (4), and ROA (4), but struggles with debt-to-equity (1). Mettler-Toledo excels in ROA (5) but has a weak ROE (1) and valuation metrics. Thermo Fisher offers a more balanced profile, while Mettler-Toledo relies heavily on asset efficiency.
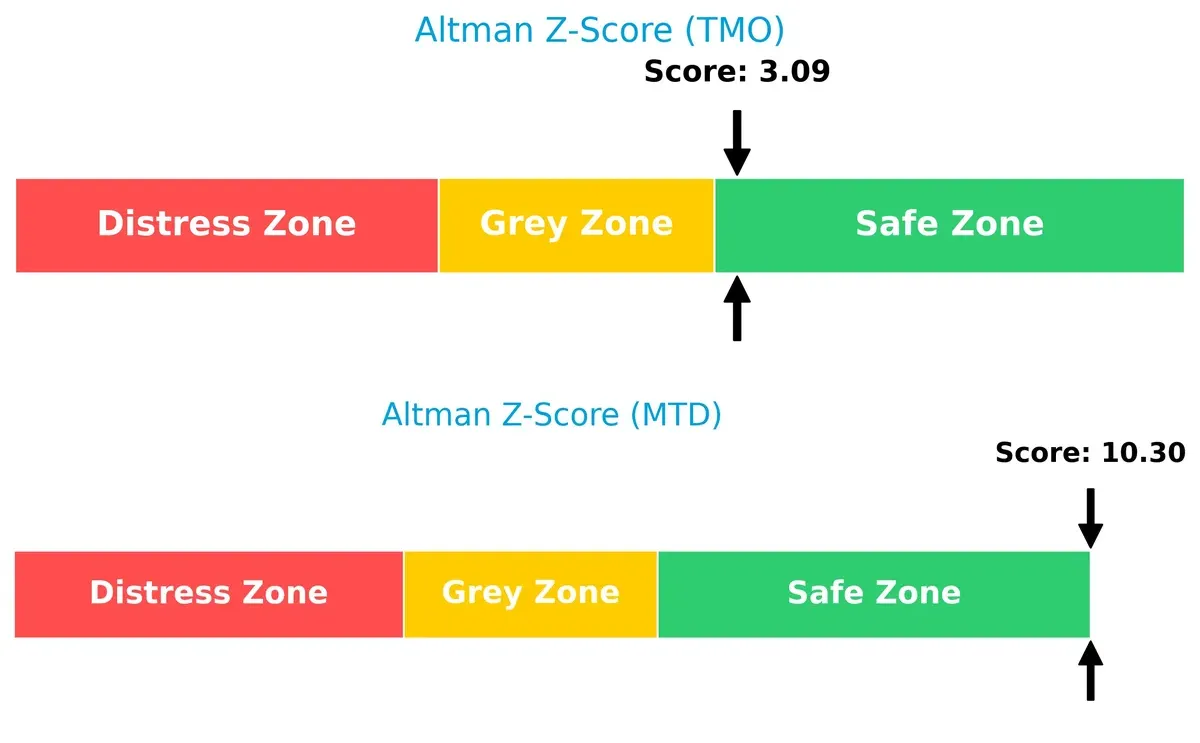
Bankruptcy Risk: Solvency Showdown
Mettler-Toledo’s Altman Z-Score of 10.3 far exceeds Thermo Fisher’s 3.1, signaling superior financial resilience and negligible bankruptcy risk in this cycle:
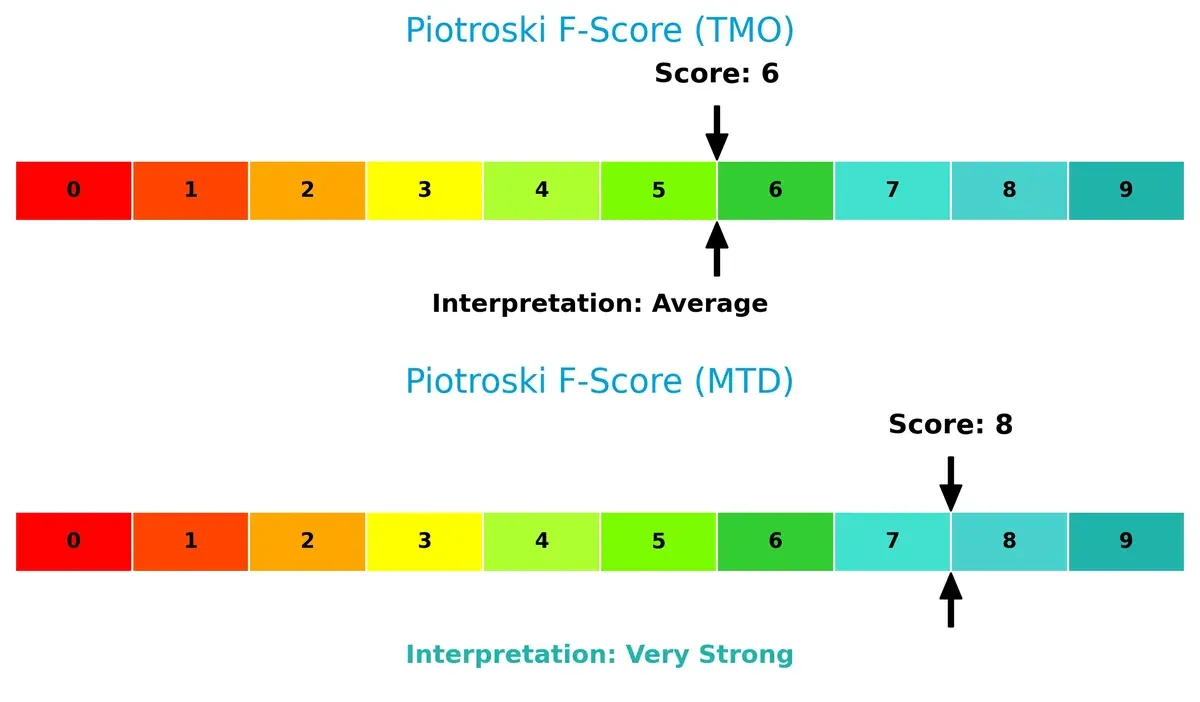
Financial Health: Quality of Operations
Mettler-Toledo scores an 8 on the Piotroski F-Score, indicating very strong financial health versus Thermo Fisher’s 6, which is average. This suggests Mettler-Toledo maintains higher operational quality and fewer red flags:
How are the two companies positioned?
This section dissects the operational DNA of Thermo Fisher Scientific and Mettler-Toledo by comparing revenue distribution and internal dynamics. The goal is to confront their economic moats and identify which model offers the most resilient competitive advantage today.
Revenue Segmentation: The Strategic Mix
This comparison dissects how Thermo Fisher Scientific and Mettler-Toledo diversify their income streams and where their primary sector bets lie:
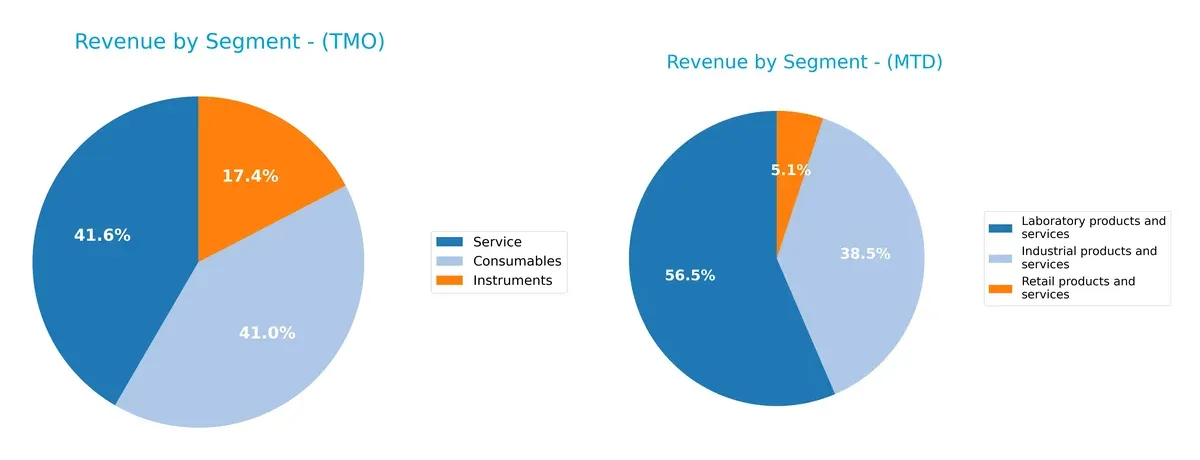
Thermo Fisher Scientific anchors its revenue in three large segments: Consumables at $17.6B, Service at $17.8B, and Instruments at $7.4B. It shows a balanced portfolio with significant ecosystem lock-in through recurring consumables and services. Mettler-Toledo, by contrast, pivots on two main segments—Laboratory products at $2.2B and Industrial products at $1.5B—displaying less diversification and higher concentration risk in weighing and measurement instruments.
Strengths and Weaknesses Comparison
This table compares the strengths and weaknesses of Thermo Fisher Scientific Inc. and Mettler-Toledo International Inc.:
Thermo Fisher Scientific Inc. Strengths
- Diversified revenue streams across consumables, instruments, and services
- Favorable net margin at 15.12%
- Strong liquidity with current ratio of 1.89
- Global presence with significant revenue from US, Europe, and Asia Pacific
- Moderate debt levels with favorable interest coverage
- Favorable fixed asset turnover at 4.22
Mettler-Toledo International Inc. Strengths
- High profitability with net margin 22.29% and ROIC 41.06%
- Strong asset turnover at 1.2 and fixed asset turnover 5.03
- Favorable price-to-book ratio despite unfavorable PE
- Favorable interest coverage ratio at 14.75
- Global revenue diversified across Americas, Europe, and Asia
Thermo Fisher Scientific Inc. Weaknesses
- Unfavorable valuation multiples with PE 32.34 and PB 4.08
- Neutral ROE and ROIC barely above WACC
- Low asset turnover at 0.4 limits efficiency
- Low dividend yield at 0.29%
- Moderate debt-to-equity and debt-to-assets ratios
Mettler-Toledo International Inc. Weaknesses
- Negative ROE at -680.23% indicates earnings volatility
- Unfavorable WACC at 10.11% signals higher capital cost
- Quick ratio 0.73 raises short-term liquidity concerns
- High debt-to-assets at 65.77% increases financial leverage
- Zero dividend yield limits income potential
Thermo Fisher’s strengths lie in its diversified revenue and liquidity, but valuation and asset efficiency warrant caution. Mettler-Toledo showcases superior profitability and turnover metrics yet faces risks from leverage and earnings instability. Both companies display global diversification supporting their strategic footprints.
The Moat Duel: Analyzing Competitive Defensibility
A structural moat is the only true shield protecting long-term profits from relentless competition erosion. Here’s how Thermo Fisher and Mettler-Toledo defend their turf:
Thermo Fisher Scientific Inc.: Broad Diversification with Scale Moat
Thermo Fisher’s moat stems from its vast product portfolio and global scale, enabling broad market reach and revenue stability. However, declining ROIC signals weakening capital efficiency, risking margin pressure by 2026.
Mettler-Toledo International Inc.: Precision Instrumentation with High ROIC Moat
Mettler-Toledo builds its moat on precision and innovation in analytical instruments, driving superior ROIC and margin expansion. Unlike Thermo Fisher, MTD’s growing ROIC suggests a durable moat with strong value creation potential ahead.
Verdict: Scale & Diversification vs. Precision & Profitability
Mettler-Toledo’s moat is deeper, fueled by rising ROIC and focused innovation. Thermo Fisher’s wider footprint faces erosion due to declining efficiency. MTD is better positioned to protect and grow market share through 2026.
Which stock offers better returns?
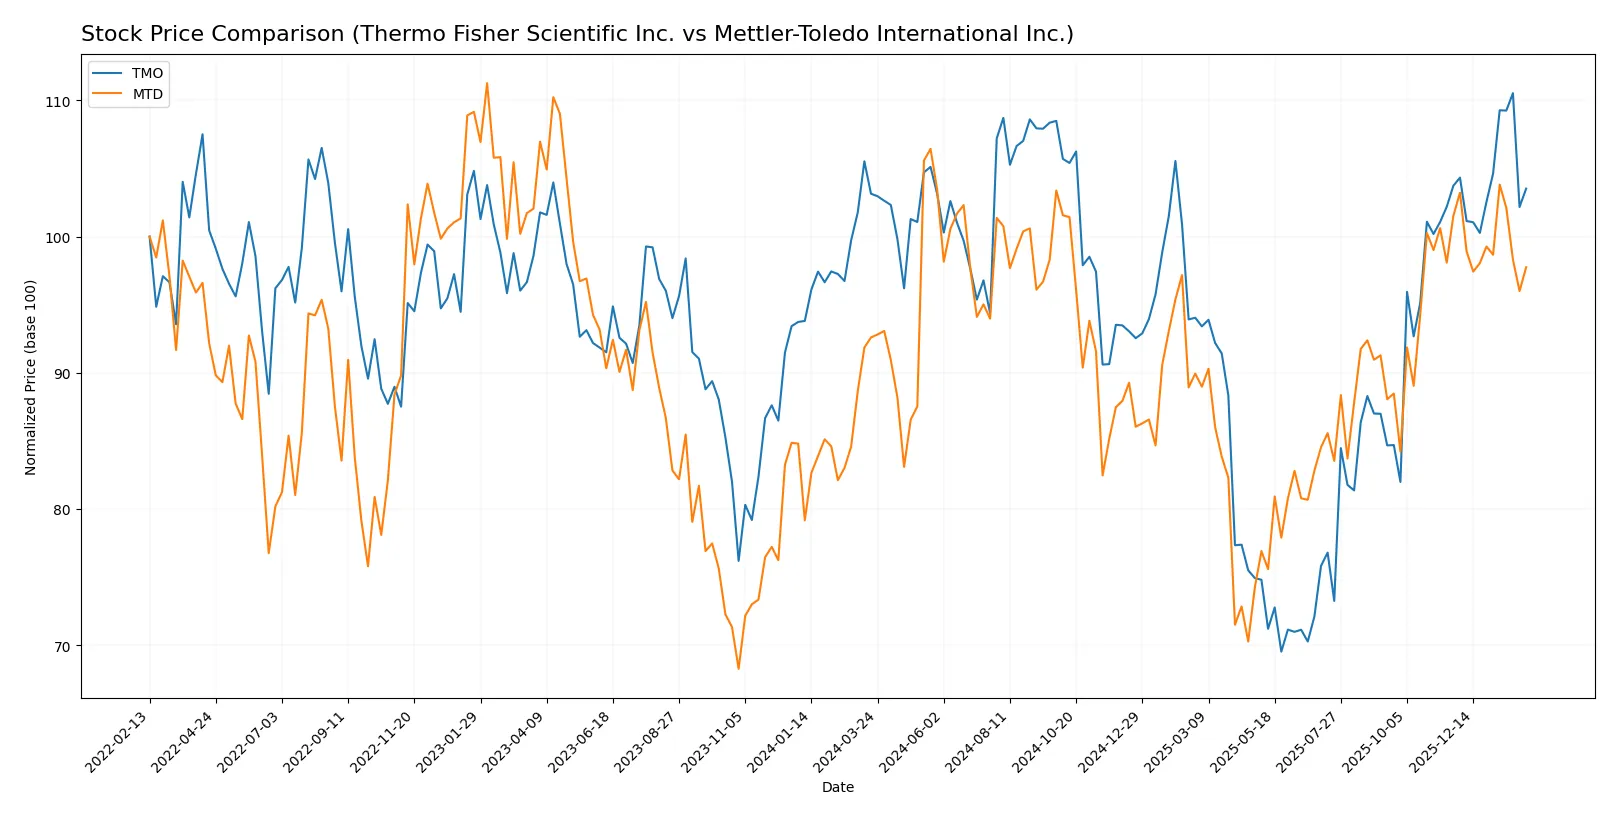
The past year shows contrasting price dynamics for Thermo Fisher Scientific and Mettler-Toledo, with both stocks exhibiting bullish trends overall but differing recent momentum and volume patterns.
Trend Comparison
Thermo Fisher Scientific’s stock rose modestly by 0.36% over 12 months, indicating a bullish trend with accelerating momentum. The price peaked at 625.98 and bottomed at 393.66, reflecting moderate volatility.
Mettler-Toledo’s stock gained 5.58% over the same period, showing a bullish trend though with decelerating momentum. It reached a high of 1522.75 and a low of 1004.96, displaying higher volatility than Thermo Fisher.
Comparing the two, Mettler-Toledo delivered stronger overall returns despite recent declines, outperforming Thermo Fisher in market performance over the last year.
Target Prices
Analysts set a confident target consensus for Thermo Fisher Scientific Inc. and Mettler-Toledo International Inc.
| Company | Target Low | Target High | Consensus |
|---|---|---|---|
| Thermo Fisher Scientific Inc. | 561 | 750 | 643.69 |
| Mettler-Toledo International Inc. | 1400 | 1600 | 1504.17 |
Thermo Fisher’s target consensus exceeds its current price by roughly 10%, signaling moderate upside. Mettler-Toledo’s consensus sits about 6% above its current price, reflecting steady growth expectations.

Don’t Let Luck Decide Your Entry Point
Optimize your entry points with our advanced ProRealTime indicators. You’ll get efficient buy signals with precise price targets for maximum performance. Start outperforming now!
How do institutions grade them?
Thermo Fisher Scientific Inc. Grades
Below is a summary of recent grade actions by major financial institutions for Thermo Fisher Scientific Inc.:
| Grading Company | Action | New Grade | Date |
|---|---|---|---|
| Citigroup | Maintain | Buy | 2026-01-30 |
| Barclays | Maintain | Overweight | 2026-01-30 |
| TD Cowen | Maintain | Buy | 2026-01-30 |
| Stifel | Maintain | Buy | 2026-01-09 |
| TD Cowen | Maintain | Buy | 2026-01-07 |
| Wells Fargo | Maintain | Overweight | 2025-12-15 |
| Citigroup | Upgrade | Buy | 2025-12-11 |
| Keybanc | Upgrade | Overweight | 2025-12-08 |
| Morgan Stanley | Maintain | Overweight | 2025-12-02 |
| HSBC | Upgrade | Buy | 2025-12-01 |
Mettler-Toledo International Inc. Grades
Below is a summary of recent grade actions by major financial institutions for Mettler-Toledo International Inc.:
| Grading Company | Action | New Grade | Date |
|---|---|---|---|
| Wells Fargo | Maintain | Equal Weight | 2025-12-15 |
| Barclays | Maintain | Overweight | 2025-12-15 |
| Barclays | Maintain | Overweight | 2025-11-10 |
| Wells Fargo | Maintain | Equal Weight | 2025-11-10 |
| Citigroup | Maintain | Buy | 2025-11-10 |
| Stifel | Maintain | Buy | 2025-11-10 |
| JP Morgan | Maintain | Neutral | 2025-10-09 |
| Evercore ISI Group | Maintain | Outperform | 2025-10-07 |
| Barclays | Maintain | Overweight | 2025-10-02 |
| B of A Securities | Maintain | Neutral | 2025-09-22 |
Which company has the best grades?
Thermo Fisher Scientific Inc. holds consistently higher grades, with multiple Buy and Overweight ratings and recent upgrades. Mettler-Toledo’s grades show more Neutral and Equal Weight ratings. Investors might interpret Thermo Fisher’s grades as stronger institutional confidence.
Risks specific to each company
The following categories identify critical pressure points and systemic threats facing Thermo Fisher Scientific Inc. and Mettler-Toledo International Inc. in the 2026 market environment:
1. Market & Competition
Thermo Fisher Scientific Inc.
- Faces intense competition in life sciences and diagnostics with broad product range but high market cap dominance.
Mettler-Toledo International Inc.
- Operates in precision instruments with niche dominance but smaller scale and higher beta, indicating more competitive pressure.
2. Capital Structure & Debt
Thermo Fisher Scientific Inc.
- Moderate debt-to-assets at 35.7%, interest coverage healthy at 5.7x, but debt-to-equity score very unfavorable.
Mettler-Toledo International Inc.
- High debt-to-assets at 65.8%, strong interest coverage at 14.7x, but negative debt-to-equity ratio reflects accounting or capital structure complexity.
3. Stock Volatility
Thermo Fisher Scientific Inc.
- Beta near 0.95 shows below-market volatility, range wide but stock price stable.
Mettler-Toledo International Inc.
- Beta at 1.44 signals above-market volatility, price range wider, reflecting sensitivity to market swings.
4. Regulatory & Legal
Thermo Fisher Scientific Inc.
- Operates globally in highly regulated medical and biotech sectors, which can constrain innovation and increase compliance costs.
Mettler-Toledo International Inc.
- Also exposed to international regulations in precision instruments, but less directly in biotech, potentially lower regulatory risk.
5. Supply Chain & Operations
Thermo Fisher Scientific Inc.
- Extensive global supply chain for instruments and reagents; complexity risks amid geopolitical tensions.
Mettler-Toledo International Inc.
- Smaller scale but diversified operations; potential risks in sourcing components for industrial instruments.
6. ESG & Climate Transition
Thermo Fisher Scientific Inc.
- Increasing pressure to meet ESG standards in healthcare and sustainability, with significant resource use.
Mettler-Toledo International Inc.
- Faces ESG scrutiny mainly on operational efficiency and supply chain sustainability, with growing investor focus.
7. Geopolitical Exposure
Thermo Fisher Scientific Inc.
- Global footprint exposes it to trade tensions and regulatory shifts, especially US-China relations.
Mettler-Toledo International Inc.
- Also exposed internationally but smaller size may limit geopolitical risk impact compared to Thermo Fisher.
Which company shows a better risk-adjusted profile?
Thermo Fisher’s largest risk lies in its heavy regulatory and supply chain complexity amid global tensions. Mettler-Toledo faces significant financial leverage risk from its high debt-to-assets ratio despite operational strength. Between them, Thermo Fisher offers a more balanced risk profile, supported by safer Altman Z-Score and moderate stock volatility. Mettler-Toledo’s extreme leverage and volatile beta undermine its risk-adjusted appeal, despite a robust Piotroski score. Recent data highlight Thermo Fisher’s stable liquidity and interest coverage as key mitigants, while Mettler-Toledo’s negative debt-to-equity ratio flags caution.
Final Verdict: Which stock to choose?
Thermo Fisher Scientific Inc. (TMO) excels as a cash-generating powerhouse with solid operational efficiency. Its superpower lies in steady free cash flow and a strong current ratio, signaling resilience. The main point of vigilance is its slightly declining return on invested capital, which suggests pressure on profitability. TMO fits an Income & Stability-focused portfolio.
Mettler-Toledo International Inc. (MTD) boasts a formidable moat with a soaring ROIC well above its cost of capital, reflecting durable competitive advantage. Its strategic edge is high asset utilization and robust margin expansion. Compared to TMO, MTD carries higher volatility and financial leverage, making it less conservative. MTD suits Growth-at-a-Reasonable-Price (GARP) investors seeking superior returns.
If you prioritize stable cash flow and defensive qualities, Thermo Fisher (TMO) is the compelling choice due to its reliable income generation and balance sheet strength. However, if you seek growth backed by a durable competitive moat and expanding profitability, Mettler-Toledo (MTD) offers better upside potential despite elevated risks. Each name addresses distinct investor appetites amid current market dynamics.
Disclaimer: Investment carries a risk of loss of initial capital. The past performance is not a reliable indicator of future results. Be sure to understand risks before making an investment decision.
Go Further
I encourage you to read the complete analyses of Thermo Fisher Scientific Inc. and Mettler-Toledo International Inc. to enhance your investment decisions: