Home > Comparison > Healthcare > MTD vs RVTY
The strategic rivalry between Mettler-Toledo International Inc. and Revvity, Inc. shapes the competitive landscape of the healthcare diagnostics and research sector. Mettler-Toledo operates as a precision instruments manufacturer with diversified industrial and retail solutions. Revvity focuses on life sciences and diagnostics through advanced technologies and services. This analysis evaluates which business model offers superior risk-adjusted returns for a diversified portfolio amid evolving market demands.

Table of contents
Companies Overview
Mettler-Toledo International and Revvity, Inc. lead innovation in medical diagnostics and research worldwide.
Mettler-Toledo International Inc.: Precision Instruments Powerhouse
Mettler-Toledo dominates the precision instruments market, generating revenue through laboratory, industrial, and retail weighing solutions. Its core strength lies in advanced analytical instruments and software platforms that serve diverse industries from life sciences to food retail. In 2026, the company focuses on expanding its global footprint and enhancing laboratory automation technologies.
Revvity, Inc.: Life Sciences and Diagnostics Innovator
Revvity drives growth by providing diagnostic instruments, reagents, and software to life sciences and applied markets. It operates two segments focused on research solutions and early detection diagnostics, targeting genomic and infectious disease testing. The 2026 strategy centers on advancing genomic workflows and integrating cutting-edge detection technologies for oncology and immunodiagnostics.
Strategic Collision: Similarities & Divergences
Both companies compete in the healthcare diagnostics sector but diverge in approach: Mettler-Toledo offers a broad spectrum of precision instruments across industries, while Revvity concentrates on specialized diagnostic and genomic solutions. Their battleground is scientific innovation and market penetration in life sciences research. Investors face distinct profiles—Mettler-Toledo with diversified industrial exposure, Revvity with a sharper focus on high-growth diagnostic technologies.
Income Statement Comparison
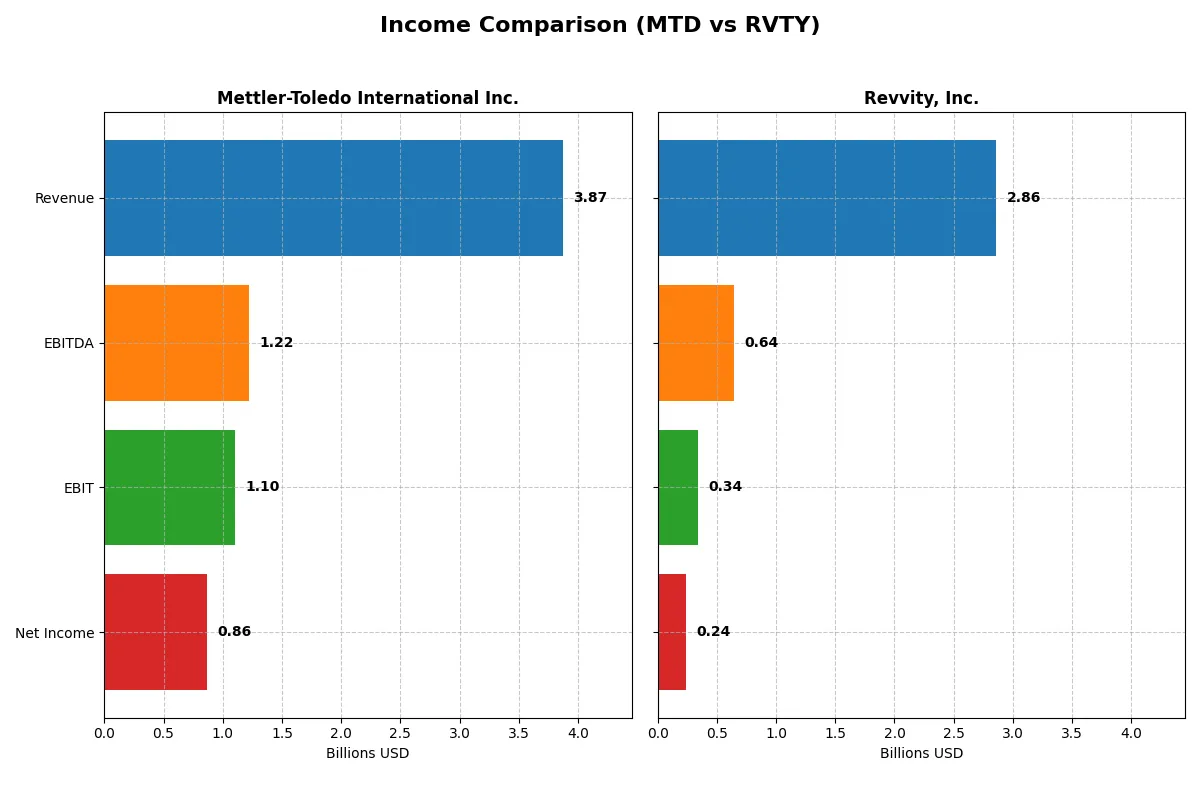
This data dissects the core profitability and scalability of both corporate engines to reveal who dominates the bottom line:
| Metric | Mettler-Toledo International Inc. (MTD) | Revvity, Inc. (RVTY) |
|---|---|---|
| Revenue | 3.87B | 2.76B |
| Cost of Revenue | 1.62B | 1.43B |
| Operating Expenses | 1.13B | 912M |
| Gross Profit | 2.25B | 1.32B |
| EBITDA | 1.22B | 840M |
| EBIT | 1.10B | 412M |
| Interest Expense | 74.6M | 96.3M |
| Net Income | 863M | 296M |
| EPS | 40.67 | 2.41 |
| Fiscal Year | 2024 | 2024 |
Income Statement Analysis: The Bottom-Line Duel
This income statement comparison reveals the true efficiency and profitability of each company’s business engine over recent years.
Mettler-Toledo International Inc. Analysis
Mettler-Toledo posts a steady revenue climb, reaching $3.87B in 2024, with net income growing to $863M. Its gross margin holds strong at 58.17%, and net margin improved to 22.29%. The company sustains operational efficiency, delivering a 7.05% net margin growth and a 13.29% EPS rise in the latest year, signaling solid momentum.
Revvity, Inc. Analysis
Revvity’s revenue declined overall but ticked up 3.67% in 2025 to $2.86B. Its net income fell sharply to $242M, reflecting weaker profitability. Gross margin stands at 53.08%, while net margin dropped to 8.46%. The firm’s EBIT and net margin contracted over the past year, highlighting operational challenges despite stable revenue.
Margin Strength vs. Revenue Resilience
Mettler-Toledo clearly wins on margin health and income growth, outperforming Revvity’s weaker profitability and volatile earnings. Mettler-Toledo’s consistent margin expansion and earnings momentum offer a more reliable profile for investors focused on efficiency and profit stability. Revvity’s profile suits those tolerating higher risk amid recovery efforts.
Financial Ratios Comparison
These vital ratios act as a diagnostic tool to expose underlying fiscal health, valuation premiums, and capital efficiency of these companies:
| Ratios | Mettler-Toledo International Inc. (MTD) | Revvity, Inc. (RVTY) |
|---|---|---|
| ROE | -6.80% (2024) | 3.33% (2025) |
| ROIC | 41.06% (2024) | 2.82% (2025) |
| P/E | 30.09 (2024) | 45.32 (2025) |
| P/B | -204.66 (2024) | 1.51 (2025) |
| Current Ratio | 1.02 (2024) | 1.68 (2025) |
| Quick Ratio | 0.73 (2024) | 1.40 (2025) |
| D/E | -16.79 (2024) | 0.46 (2025) |
| Debt-to-Assets | 65.77% (2024) | 27.68% (2025) |
| Interest Coverage | 15.10 (2024) | 3.87 (2025) |
| Asset Turnover | 1.20 (2024) | 0.23 (2025) |
| Fixed Asset Turnover | 5.03 (2024) | 4.43 (2025) |
| Payout ratio | 0% (2024) | 13.57% (2025) |
| Dividend yield | 0% (2024) | 0.30% (2025) |
| Fiscal Year | 2024 | 2025 |
Efficiency & Valuation Duel: The Vital Signs
Financial ratios serve as a company’s DNA, uncovering hidden risks and operational strengths that shape investment decisions.
Mettler-Toledo International Inc.
Mettler-Toledo shows robust operational efficiency with a 22.3% net margin and a commanding 41.1% ROIC, signaling strong capital returns. However, its P/E ratio at 30.1 suggests the stock trades at a premium. The company retains earnings for growth, as it does not pay dividends, focusing on reinvestment in R&D and innovation.
Revvity, Inc.
Revvity posts a modest 8.5% net margin and a weak 2.8% ROIC, indicating limited profitability and capital efficiency. Its valuation appears stretched with a P/E of 45.3, reflecting high growth expectations. The company yields a minimal 0.3% dividend, but emphasizes reinvestment in research to bolster future growth prospects.
Premium Valuation vs. Operational Safety
Mettler-Toledo offers superior operational returns and a balanced risk profile despite its premium valuation. Revvity’s higher P/E and weaker profitability elevate risk. Investors seeking stable capital efficiency may prefer Mettler-Toledo, while growth-seekers might tolerate Revvity’s stretched valuation for potential upside.
Which one offers the Superior Shareholder Reward?
Mettler-Toledo (MTD) pays no dividends but generates robust free cash flow (40.7/share in 2024) with no payout pressure. Its buyback strategy is unclear but strong cash flow supports future returns. Revvity (RVTY) offers a modest dividend yield (~0.25%) with a low payout ratio (~11-13%), indicating room to grow distributions. RVTY also runs consistent buybacks, enhancing total shareholder return. MTD’s zero payout emphasizes reinvestment for growth, while RVTY balances yield and buybacks. I believe MTD’s cash flow strength and reinvestment edge offer a superior long-term return profile, despite RVTY’s current income appeal.
Comparative Score Analysis: The Strategic Profile
The radar chart reveals the fundamental DNA and trade-offs of Mettler-Toledo International Inc. and Revvity, Inc., showing their financial strengths and vulnerabilities side by side:
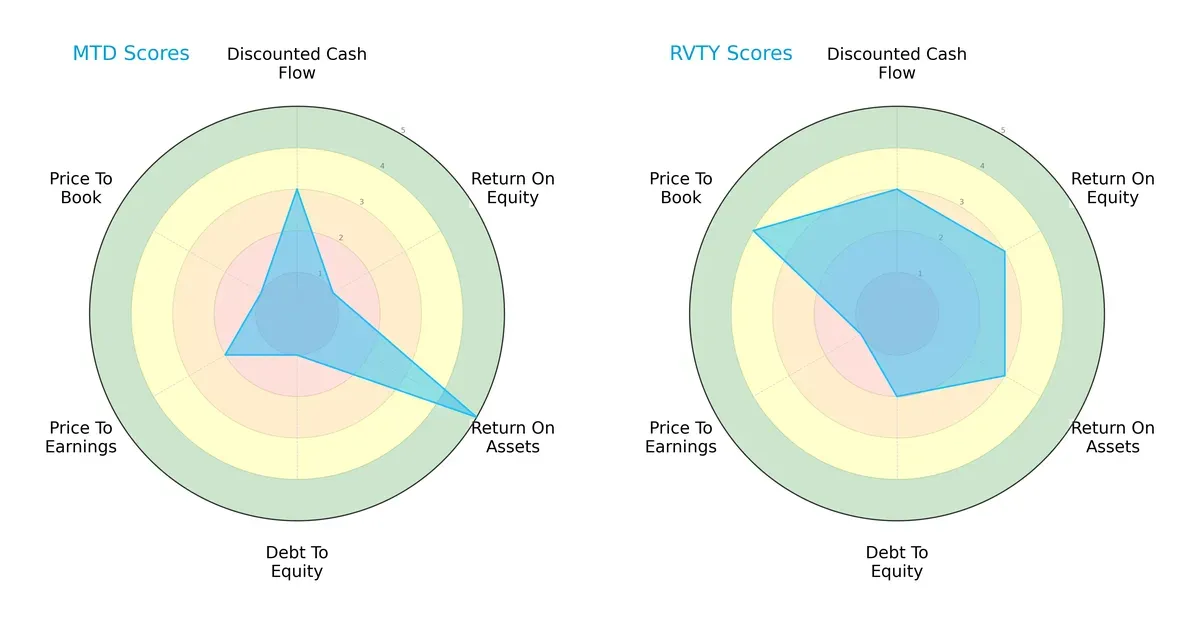
Mettler-Toledo relies heavily on asset efficiency, scoring a perfect 5 in ROA, but suffers from weak equity returns (ROE 1) and a risky debt profile (Debt/Equity 1). Revvity presents a more balanced profile with moderate scores across ROE (3), ROA (3), and Debt/Equity (2), though its valuation metrics are mixed, with a poor P/E score (1) but strong P/B (4). Overall, Revvity offers steadier fundamentals, while Mettler-Toledo’s profile depends on operational excellence offset by leverage risks.
Bankruptcy Risk: Solvency Showdown
The Altman Z-Score gap highlights vastly different solvency outlooks in this cycle:
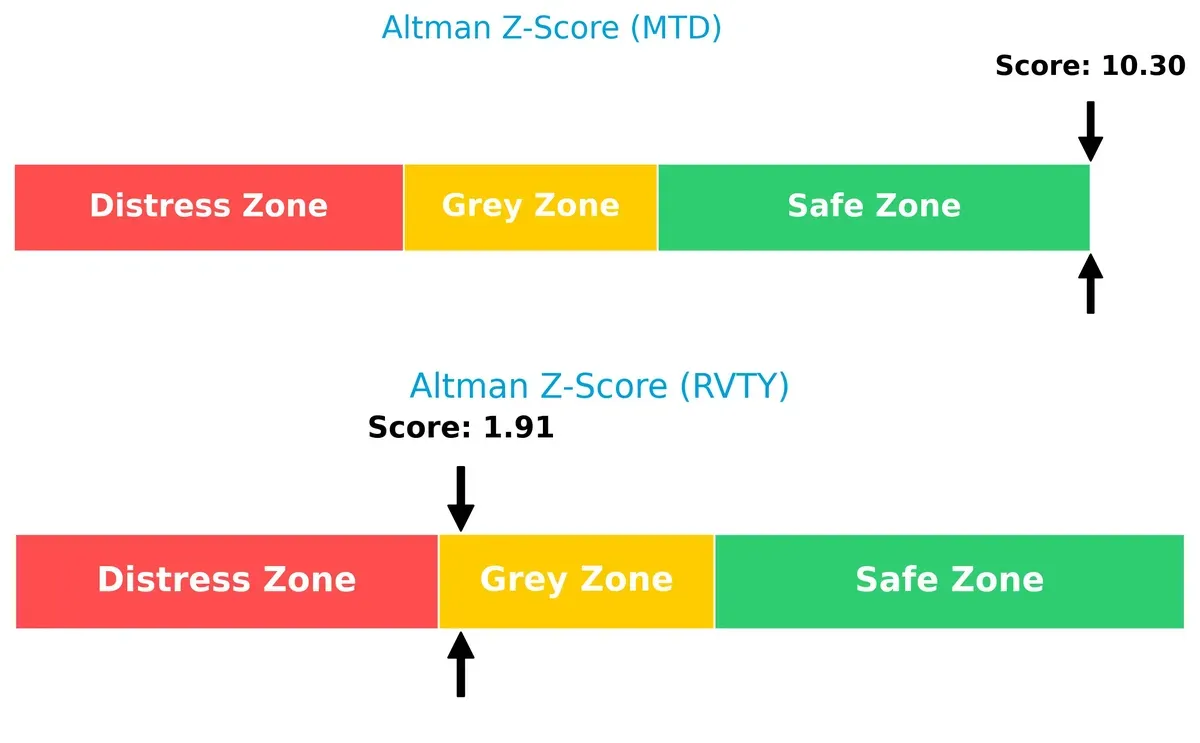
Mettler-Toledo scores 10.3, placing it securely in the safe zone, signaling robust financial health and low bankruptcy risk. Revvity’s 1.9 falls into the grey zone, indicating moderate distress and caution for long-term survival.
Financial Health: Quality of Operations
Both companies score an 8 on the Piotroski F-Score, reflecting very strong internal financial health:
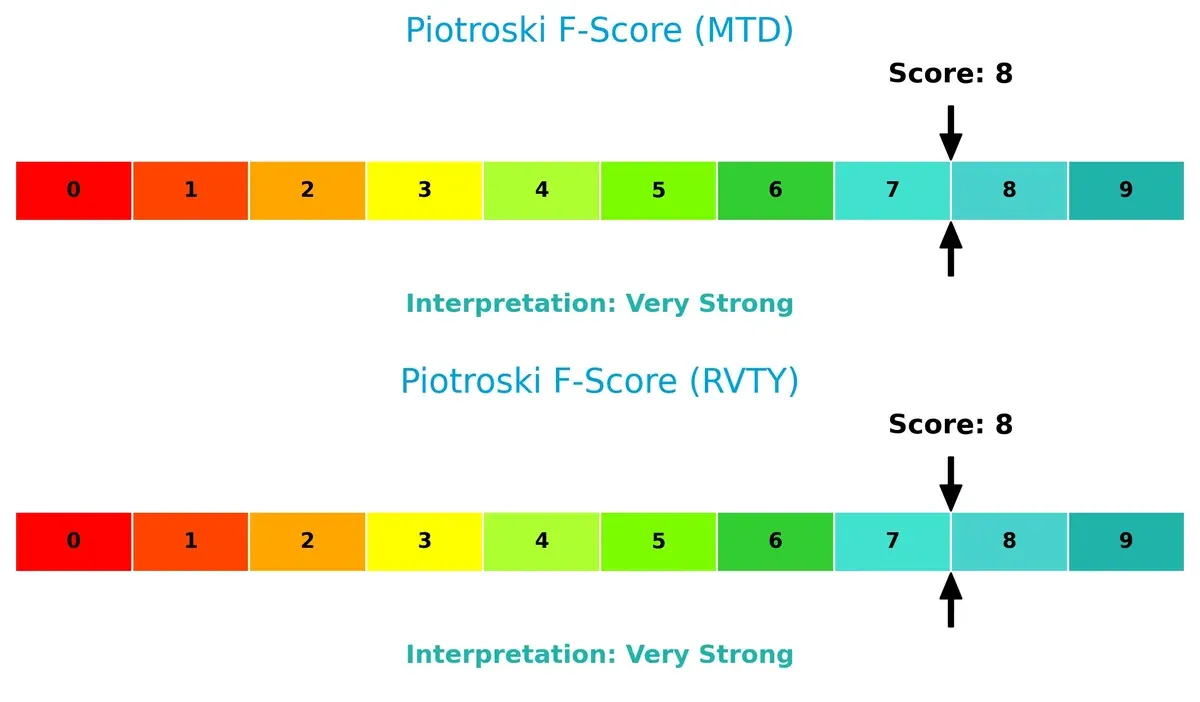
This parity suggests both firms maintain solid profitability, liquidity, and operational efficiency. Neither shows red flags on internal metrics, aligning with their strong fundamental profiles despite differing external risk factors.
How are the two companies positioned?
This section dissects MTD and RVTY’s operational DNA by comparing their revenue distribution and internal dynamics. The goal is to confront their economic moats to identify which model delivers the most resilient competitive advantage today.
Revenue Segmentation: The Strategic Mix
The following visual comparison dissects how Mettler-Toledo and Revvity diversify their income streams and where their primary sector bets lie:
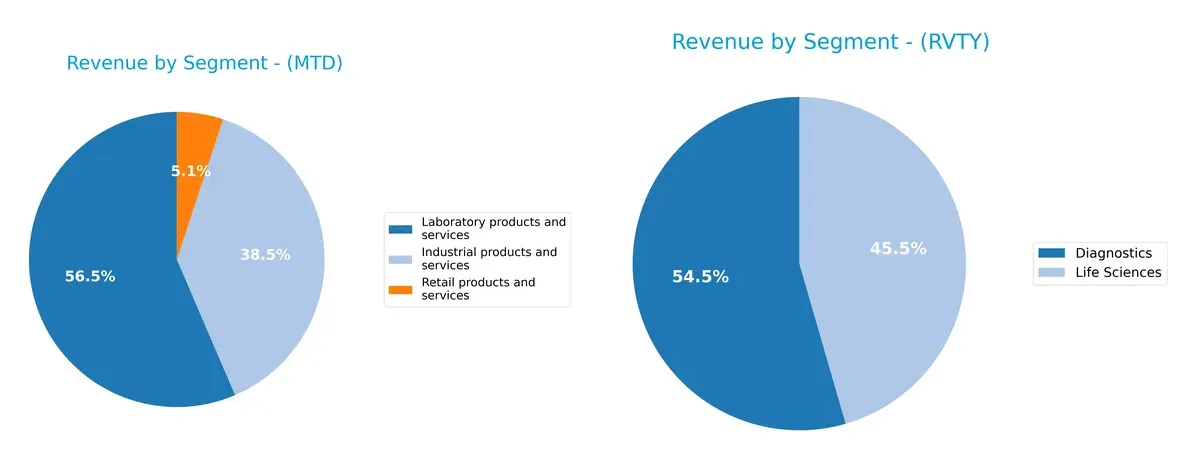
Mettler-Toledo anchors its revenue in three segments: Laboratory products at $2.19B, Industrial products at $1.49B, and Retail products at $196M. This mix offers moderate diversification within precision instruments. Revvity pivots on two main segments, Diagnostics at $1.5B and Life Sciences at $1.25B, showing a balanced but narrower focus. Mettler-Toledo’s wider spread reduces concentration risk, while Revvity’s dual focus highlights strategic bets on healthcare innovation.
Strengths and Weaknesses Comparison
This table compares the Strengths and Weaknesses of Mettler-Toledo International Inc. and Revvity, Inc.:
MTD Strengths
- Strong profitability with 22.29% net margin
- High ROIC at 41.06% exceeding WACC
- Diverse revenue streams across Industrial, Laboratory, and Retail segments
- Global presence with balanced sales in Americas, Europe, Asia
- High asset and fixed asset turnover indicating efficient use
RVTY Strengths
- Favorable WACC at 7.57% supporting capital efficiency
- Solid liquidity with current ratio 1.68 and quick ratio 1.4
- Low debt-to-assets ratio at 27.68% indicating conservative leverage
- Revenue diversification into Diagnostics and Life Sciences
- Geographic exposure including US, UK, China, and other international markets
MTD Weaknesses
- Negative ROE at -680.23% signaling equity profitability issues
- High debt-to-assets ratio at 65.77% increasing financial risk
- Unfavorable quick ratio 0.73 suggesting liquidity constraints
- Elevated PE ratio of 30.09 may imply overvaluation
- No dividend yield limits income returns
RVTY Weaknesses
- Low net margin of 8.46% reflects weaker profitability
- ROIC at 2.82% below WACC reducing value creation
- High PE at 45.32 indicates potential overvaluation
- Low asset turnover at 0.23 signals inefficient asset use
- Dividend yield low at 0.3% offering limited shareholder income
Both companies show slightly favorable overall financial profiles but face distinct challenges. MTD excels in profitability and asset efficiency but carries higher financial risk and valuation concerns. Revvity maintains healthier liquidity and lower leverage but struggles with profitability and asset utilization. These contrasts reflect differing strategic priorities and risk exposures.
The Moat Duel: Analyzing Competitive Defensibility
A structural moat is the only barrier protecting long-term profits from relentless competitive erosion. Let’s examine how Mettler-Toledo and Revvity stack up:
Mettler-Toledo International Inc.: Precision Instruments’ Cost and Intangible Asset Moat
Mettler-Toledo’s moat stems from high switching costs and proprietary technology. It shows durable ROIC well above WACC, maintaining margin stability and growing profitability. Expansion into industrial and software solutions in 2026 should deepen its advantage.
Revvity, Inc.: Innovation-Driven but Struggling Moat
Revvity relies on product innovation and scientific expertise but faces declining ROIC and shrinking margins, signaling a weakening moat. Its diversification into diagnostics and applied services offers potential, yet profitability erosion clouds near-term outlook.
Cost Leadership and Intangible Assets vs. Innovation and Execution Risks
Mettler-Toledo’s wider and more durable moat outperforms Revvity’s fragile positioning. Its superior capital efficiency and margin resilience better defend market share amid intensifying sector competition.
Which stock offers better returns?
The past year reveals divergent momentum for Mettler-Toledo International Inc. and Revvity, Inc., with notable swings shaping their respective price trajectories and trading volumes.
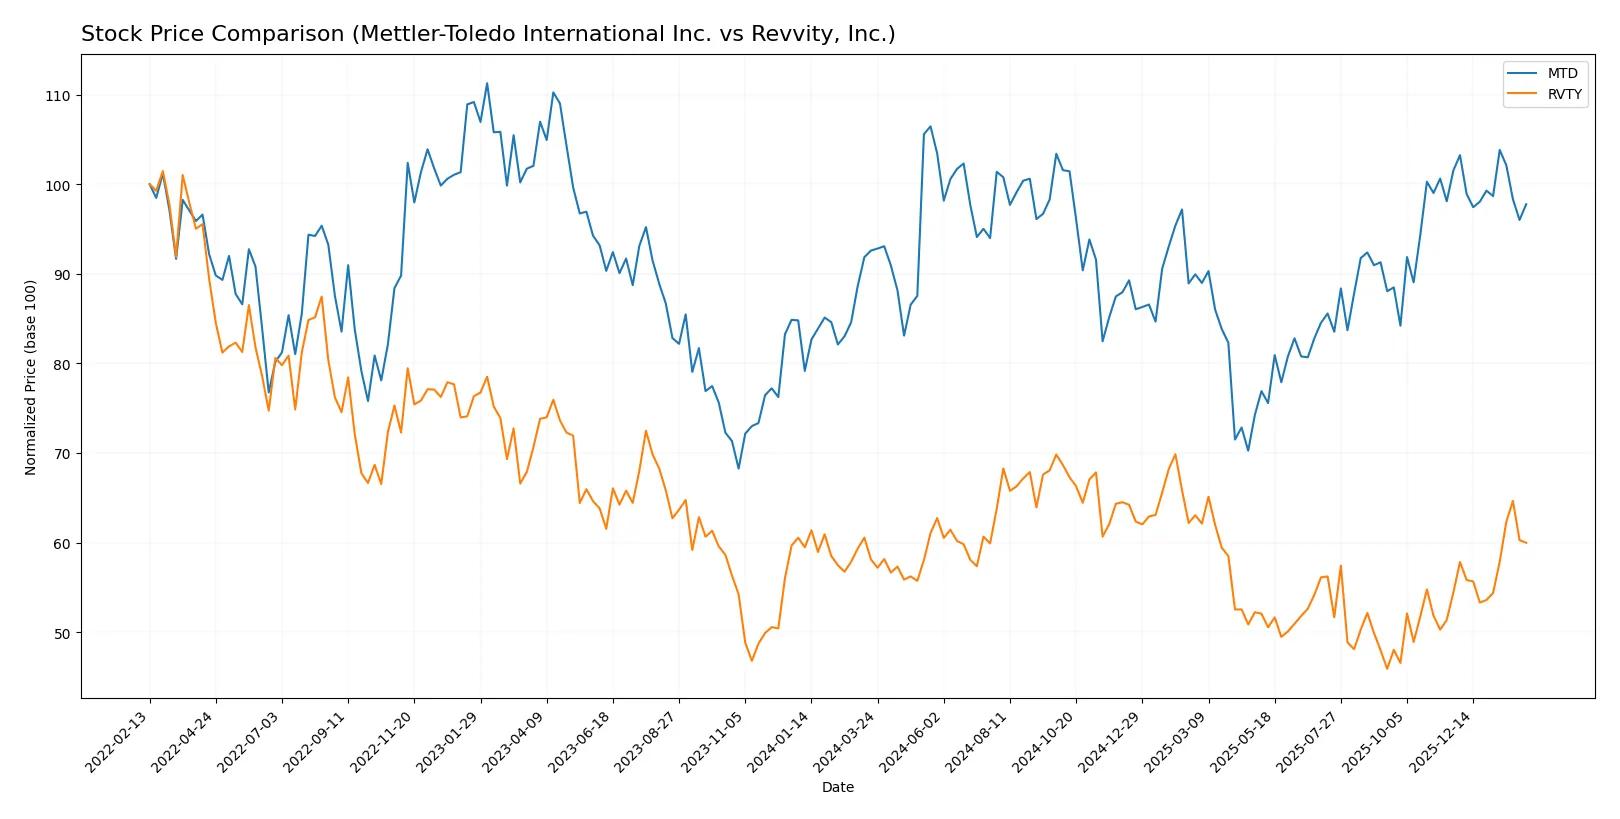
Trend Comparison
Mettler-Toledo International Inc. shows a 5.58% price rise over 12 months, indicating a bullish trend but with decelerating momentum. The stock peaked at 1522.75 and bottomed at 1004.96.
Revvity, Inc. gained 3.24% in the same period, also bullish but accelerating. Its volatility is lower, with prices ranging from 82.87 to 126.13, and recent gains of 10.2% strengthen the positive trend.
Mettler-Toledo outperformed Revvity over the year despite recent weakness. It delivered the highest market return, though Revvity’s accelerating trend and volume gains merit attention.
Target Prices
Analysts present a confident target price consensus for both Mettler-Toledo International Inc. and Revvity, Inc.
| Company | Target Low | Target High | Consensus |
|---|---|---|---|
| Mettler-Toledo International Inc. | 1400 | 1600 | 1504.17 |
| Revvity, Inc. | 105 | 123 | 112.67 |
The target consensus for Mettler-Toledo sits about 6% above its current price of 1415.4 USD, signaling moderate upside. Revvity’s consensus target exceeds its last price of 107.9 USD by roughly 4.5%, reflecting cautious optimism.

Don’t Let Luck Decide Your Entry Point
Optimize your entry points with our advanced ProRealTime indicators. You’ll get efficient buy signals with precise price targets for maximum performance. Start outperforming now!
How do institutions grade them?
Mettler-Toledo International Inc. Grades
The following table summarizes recent institutional grades for Mettler-Toledo International Inc.:
| Grading Company | Action | New Grade | Date |
|---|---|---|---|
| Wells Fargo | Maintain | Equal Weight | 2025-12-15 |
| Barclays | Maintain | Overweight | 2025-12-15 |
| Barclays | Maintain | Overweight | 2025-11-10 |
| Wells Fargo | Maintain | Equal Weight | 2025-11-10 |
| Citigroup | Maintain | Buy | 2025-11-10 |
| Stifel | Maintain | Buy | 2025-11-10 |
| JP Morgan | Maintain | Neutral | 2025-10-09 |
| Evercore ISI Group | Maintain | Outperform | 2025-10-07 |
| Barclays | Maintain | Overweight | 2025-10-02 |
| B of A Securities | Maintain | Neutral | 2025-09-22 |
Revvity, Inc. Grades
The following table summarizes recent institutional grades for Revvity, Inc.:
| Grading Company | Action | New Grade | Date |
|---|---|---|---|
| Jefferies | Maintain | Hold | 2026-02-03 |
| TD Cowen | Maintain | Buy | 2026-02-03 |
| Evercore ISI Group | Maintain | Outperform | 2026-02-03 |
| Wells Fargo | Maintain | Equal Weight | 2026-02-03 |
| Barclays | Maintain | Overweight | 2026-02-03 |
| Barclays | Maintain | Overweight | 2025-12-15 |
| Wells Fargo | Maintain | Equal Weight | 2025-12-15 |
| Baird | Maintain | Outperform | 2025-10-28 |
| Barclays | Maintain | Overweight | 2025-10-28 |
| Evercore ISI Group | Maintain | Outperform | 2025-10-07 |
Which company has the best grades?
Revvity, Inc. holds a wider range of higher ratings, including multiple Outperform and Buy grades. Mettler-Toledo shows more Neutral and Equal Weight ratings. Investors might interpret Revvity’s stronger grades as indicating higher growth expectations or market confidence.
Risks specific to each company
The following categories identify the critical pressure points and systemic threats facing both firms in the 2026 market environment:
1. Market & Competition
Mettler-Toledo International Inc.
- Dominates precision instrument market with strong industrial and lab segments but faces high P/E valuation pressure.
Revvity, Inc.
- Competes in diagnostics and life sciences with diversified solutions but lower net margin and higher P/E ratio signal market pricing challenges.
2. Capital Structure & Debt
Mettler-Toledo International Inc.
- High debt-to-assets ratio (65.77%) signals leverage risk despite solid interest coverage (14.75x).
Revvity, Inc.
- Maintains conservative leverage with 27.68% debt-to-assets and manageable interest coverage (3.7x).
3. Stock Volatility
Mettler-Toledo International Inc.
- Beta of 1.436 indicates above-market volatility, increasing risk in turbulent markets.
Revvity, Inc.
- Lower beta of 1.089 suggests relatively steadier stock performance amid market swings.
4. Regulatory & Legal
Mettler-Toledo International Inc.
- Operates globally in medical diagnostics, facing stringent regulatory compliance and potential legal scrutiny.
Revvity, Inc.
- Also subject to tight regulations in diagnostics and life sciences, with added complexity from environmental testing markets.
5. Supply Chain & Operations
Mettler-Toledo International Inc.
- Complex global operations with exposure to supply chain disruptions across multiple industrial sectors.
Revvity, Inc.
- Supply chain risks exist but more focused on life sciences and diagnostics, potentially less diversified operational risk.
6. ESG & Climate Transition
Mettler-Toledo International Inc.
- Increasing pressure to align with climate goals in manufacturing and industrial software.
Revvity, Inc.
- Faces ESG scrutiny in environmental analytics and diagnostics, with opportunities in sustainability-driven markets.
7. Geopolitical Exposure
Mettler-Toledo International Inc.
- Broad international footprint exposes it to geopolitical tensions impacting supply and sales.
Revvity, Inc.
- Global but more concentrated in US and Europe, somewhat insulated but still vulnerable to trade and regulatory shifts.
Which company shows a better risk-adjusted profile?
Mettler-Toledo’s significant leverage and higher stock volatility represent its main risks, offset by strong operational efficiency and Altman Z-score in the safe zone. Revvity, while less leveraged and more stable stock-wise, struggles with weaker profitability and a borderline Altman Z-score. Overall, Revvity offers a more balanced risk profile thanks to its conservative capital structure and lower volatility, despite lower returns. The 65.77% debt-to-assets ratio in Mettler-Toledo raises red flags, while Revvity’s 27.68% reflects prudent financial management.
Final Verdict: Which stock to choose?
Mettler-Toledo International Inc. (MTD) stands out for its robust economic moat, demonstrated by a consistently high ROIC well above its cost of capital. This cash-generating powerhouse maintains favorable profitability and operational efficiency. Its main point of vigilance lies in its leverage and liquidity ratios, which warrant close monitoring. MTD suits portfolios targeting aggressive growth with a tolerance for some financial complexity.
Revvity, Inc. (RVTY) offers a strategic moat rooted in its recurring revenue streams and strong liquidity position. It presents lower financial risk than MTD, with a healthier balance sheet and moderate debt levels. However, its value creation profile is weak, marked by declining ROIC and uneven income growth. RVTY fits portfolios seeking growth at a reasonable price, prioritizing stability over rapid expansion.
If you prioritize durable economic moats and operational excellence, MTD is the compelling choice due to its strong value creation and cash flow generation. However, if you seek a more conservative growth approach with better liquidity and lower leverage, RVTY offers better stability despite its weaker profitability metrics. Each stock appeals to distinct investor profiles balancing growth ambition and risk tolerance.
Disclaimer: Investment carries a risk of loss of initial capital. The past performance is not a reliable indicator of future results. Be sure to understand risks before making an investment decision.
Go Further
I encourage you to read the complete analyses of Mettler-Toledo International Inc. and Revvity, Inc. to enhance your investment decisions: