Home > Comparison > Healthcare > MTD vs DGX
The strategic rivalry between Mettler-Toledo International Inc. and Quest Diagnostics Incorporated shapes the healthcare diagnostics landscape. Mettler-Toledo operates as a capital-intensive precision instrument manufacturer, while Quest Diagnostics leads as a high-volume diagnostic testing and information services provider. This head-to-head reflects a contrast between specialized manufacturing and service-driven scale. This analysis will evaluate which company presents the superior risk-adjusted profile for a diversified portfolio.
Table of contents
Companies Overview
Mettler-Toledo and Quest Diagnostics dominate distinct niches within medical diagnostics and research.
Mettler-Toledo International Inc.: Precision Instruments Pioneer
Mettler-Toledo leads as a manufacturer of precision instruments serving diverse industries globally. Its revenue stems from sales of laboratory, industrial, and retail weighing solutions plus analytical instruments. In 2026, it emphasizes expanding its software platform LabX to enhance data management across its instruments, reinforcing integration and customer reliance.
Quest Diagnostics Incorporated: Diagnostic Testing Leader
Quest Diagnostics stands as a foremost provider of diagnostic information services in the U.S. and abroad. Revenue flows from routine and advanced clinical testing, supported by a vast network including labs, patient centers, and mobile services. The company’s 2026 strategy focuses on broadening its technology-driven diagnostic and risk assessment services to healthcare organizations and insurers.
Strategic Collision: Similarities & Divergences
Both firms operate in medical diagnostics but differ fundamentally: Mettler-Toledo supplies high-tech instruments, while Quest offers information and testing services. Their competition centers on serving healthcare and research clients but through contrasting models—product innovation versus service breadth. This divergence creates distinct investment profiles: one anchored in hardware and software integration, the other in scalable healthcare diagnostics networks.
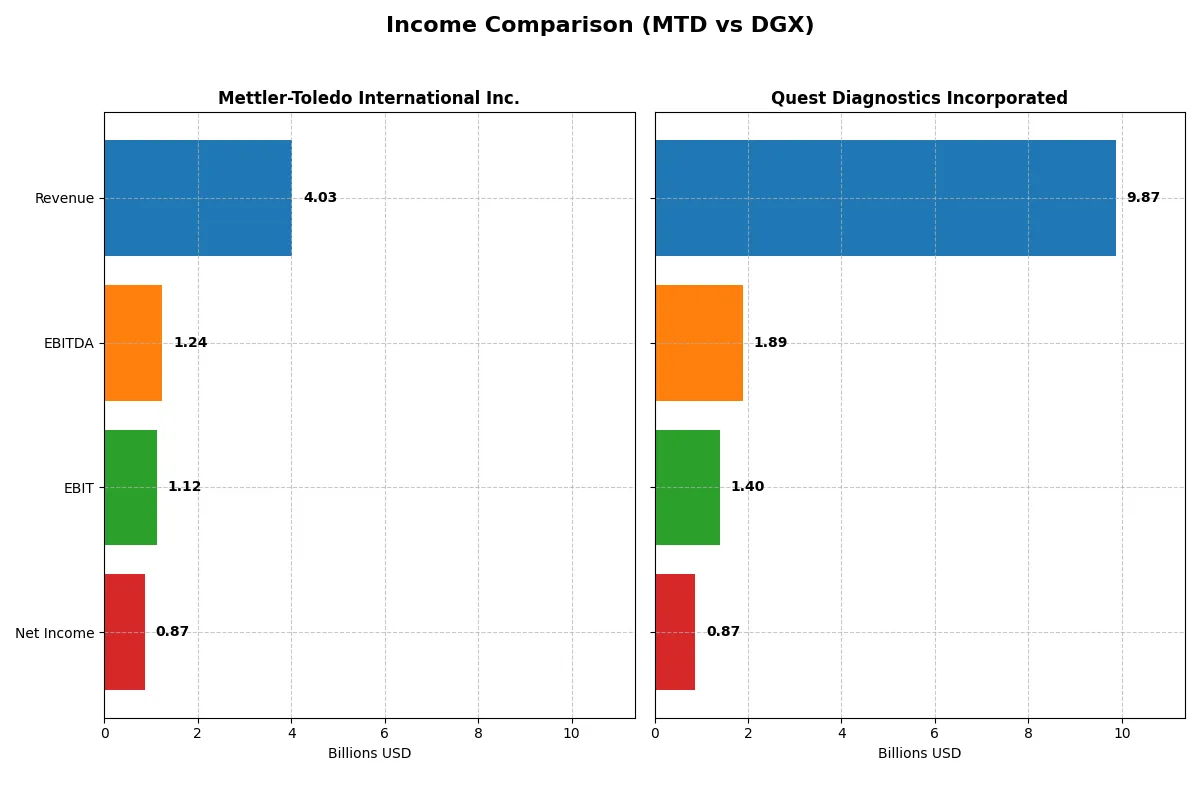
Income Statement Comparison
This data dissects the core profitability and scalability of both corporate engines to reveal who dominates the bottom line:
| Metric | Mettler-Toledo International Inc. (MTD) | Quest Diagnostics Incorporated (DGX) |
|---|---|---|
| Revenue | 4.03B | 9.87B |
| Cost of Revenue | 1.71B | 6.63B |
| Operating Expenses | 1.20B | 1.90B |
| Gross Profit | 2.32B | 3.24B |
| EBITDA | 1.24B | 1.89B |
| EBIT | 1.12B | 1.40B |
| Interest Expense | 68.5M | 226M |
| Net Income | 869M | 871M |
| EPS | 42.17 | 7.80 |
| Fiscal Year | 2025 | 2024 |
Income Statement Analysis: The Bottom-Line Duel
This income statement comparison reveals which company drives superior operational efficiency and bottom-line strength in their respective industries.
Mettler-Toledo International Inc. Analysis
Mettler-Toledo’s revenue climbed steadily from 3.7B in 2021 to 4.0B in 2025, while net income rose from 769M to 869M. Its gross margin remains robust at 57.5%, and net margin holds strong near 21.6%. In 2025, modest revenue growth slowed margin expansion, reflecting disciplined cost control amid rising expenses.
Quest Diagnostics Incorporated Analysis
Quest Diagnostics’ revenue fluctuated between 9.4B and 10.8B from 2020 to 2024, with net income halving from 1.99B in 2021 to 871M in 2024. Its gross margin sits at a lower 32.9%, with net margin at 8.8%. Despite moderate top-line growth, profitability deteriorated significantly over the period, signaling margin compression.
Margin Strength vs. Scale Challenge
Mettler-Toledo excels in margin efficiency and consistent profit growth, whereas Quest boasts scale but faces margin erosion. Mettler-Toledo’s superior profitability metrics suggest stronger capital allocation and operational discipline. For investors prioritizing durable earnings quality, Mettler-Toledo presents a more attractive profile despite Quest’s larger revenue base.
Financial Ratios Comparison
These vital ratios act as a diagnostic tool to expose the underlying fiscal health, valuation premiums, and capital efficiency of each company:
| Ratios | Mettler-Toledo International Inc. (MTD) | Quest Diagnostics Incorporated (DGX) |
|---|---|---|
| ROE | -36.77% (2025) | 12.85% (2024) |
| ROIC | 35.95% (2025) | 6.96% (2024) |
| P/E | 33.06 (2025) | 19.23 (2024) |
| P/B | -1215.71 (2025) | 2.47 (2024) |
| Current Ratio | 1.14 (2025) | 1.10 (2024) |
| Quick Ratio | 0.81 (2025) | 1.02 (2024) |
| D/E | -91.05 (2025) | 1.05 (2024) |
| Debt-to-Assets | 57.97% (2025) | 43.87% (2024) |
| Interest Coverage | 16.32 (2025) | 5.96 (2024) |
| Asset Turnover | 1.08 (2025) | 0.61 (2024) |
| Fixed Asset Turnover | 4.76 (2025) | 3.57 (2024) |
| Payout ratio | 0% (2025) | 38.00% (2024) |
| Dividend yield | 0% (2025) | 1.98% (2024) |
| Fiscal Year | 2025 | 2024 |
Efficiency & Valuation Duel: The Vital Signs
Financial ratios act as a company’s DNA, uncovering hidden risks and revealing operational strengths that shape investment decisions.
Mettler-Toledo International Inc.
Mettler-Toledo shows strong operational efficiency with a 21.6% net margin and a commanding 35.9% ROIC, signaling robust capital use. However, a stretched P/E of 33.1 suggests an expensive valuation. The company pays no dividend but invests heavily in R&D, fueling growth instead of immediate shareholder returns.
Quest Diagnostics Incorporated
Quest Diagnostics posts a moderate 8.8% net margin and a 7.0% ROIC, reflecting steady but less dynamic profitability. Its valuation is more reasonable, with a P/E of 19.2 and a neutral-to-favorable balance sheet. The company delivers a 2.0% dividend yield, supporting income-focused investors alongside measured growth.
Premium Valuation vs. Operational Safety
Mettler-Toledo’s premium valuation reflects its superior operational efficiency but carries higher risk due to stretched multiples and no dividend. Quest Diagnostics offers a safer profile with moderate returns and steady dividends. Growth-oriented investors may prefer Mettler-Toledo, while income seekers might lean toward Quest Diagnostics.
Which one offers the Superior Shareholder Reward?
I observe Mettler-Toledo International Inc. (MTD) eschews dividends, instead doubling down on robust share buybacks fueled by strong free cash flow (41B+ per share). Quest Diagnostics (DGX) pays a modest 2% dividend yield with a 38% payout ratio but maintains active buybacks too. MTD’s zero payout ratio signals aggressive reinvestment combined with buybacks, enhancing long-term value. DGX balances income with steady dividends and buybacks, appealing to income-focused investors. Given MTD’s superior free cash flow coverage and capital allocation intensity, I find Mettler-Toledo offers a more attractive total return profile in 2026.
Comparative Score Analysis: The Strategic Profile
The radar chart reveals the core DNA and strategic trade-offs of Mettler-Toledo and Quest Diagnostics, highlighting their financial strengths and vulnerabilities:
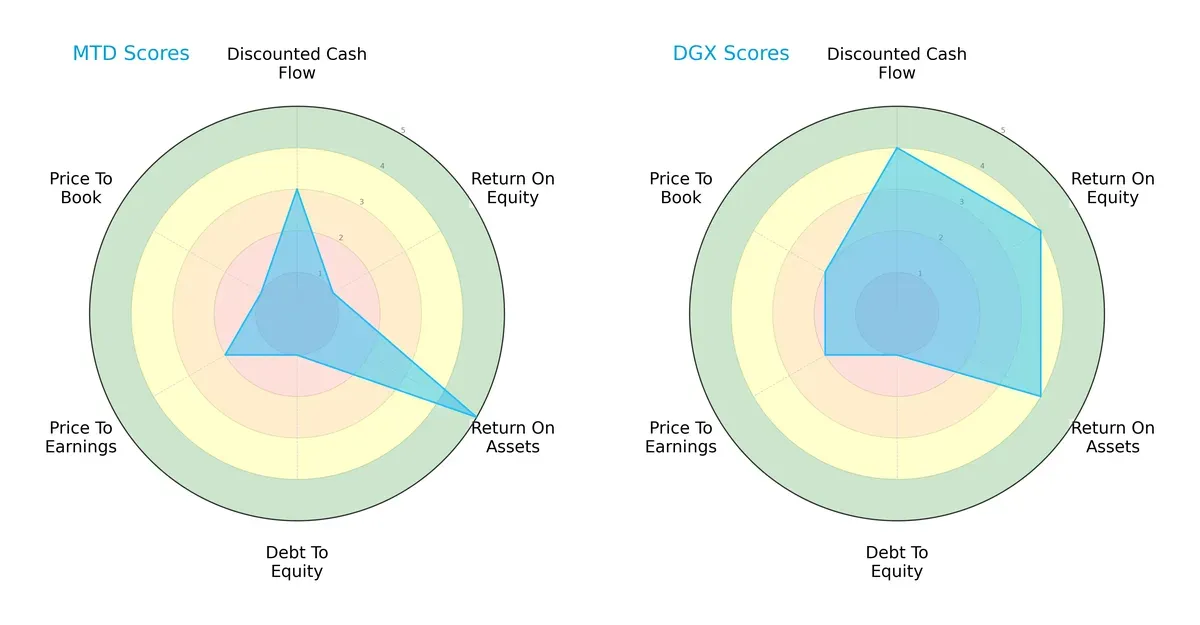
Quest Diagnostics shows a more balanced profile, excelling in discounted cash flow (4 vs. 3), return on equity (4 vs. 1), and return on assets (4 vs. 5). Mettler-Toledo’s standout is return on assets, but it suffers from weak equity returns and high leverage. Both firms face valuation challenges with low P/E and P/B scores, yet Quest’s broader strengths suggest steadier operational performance.
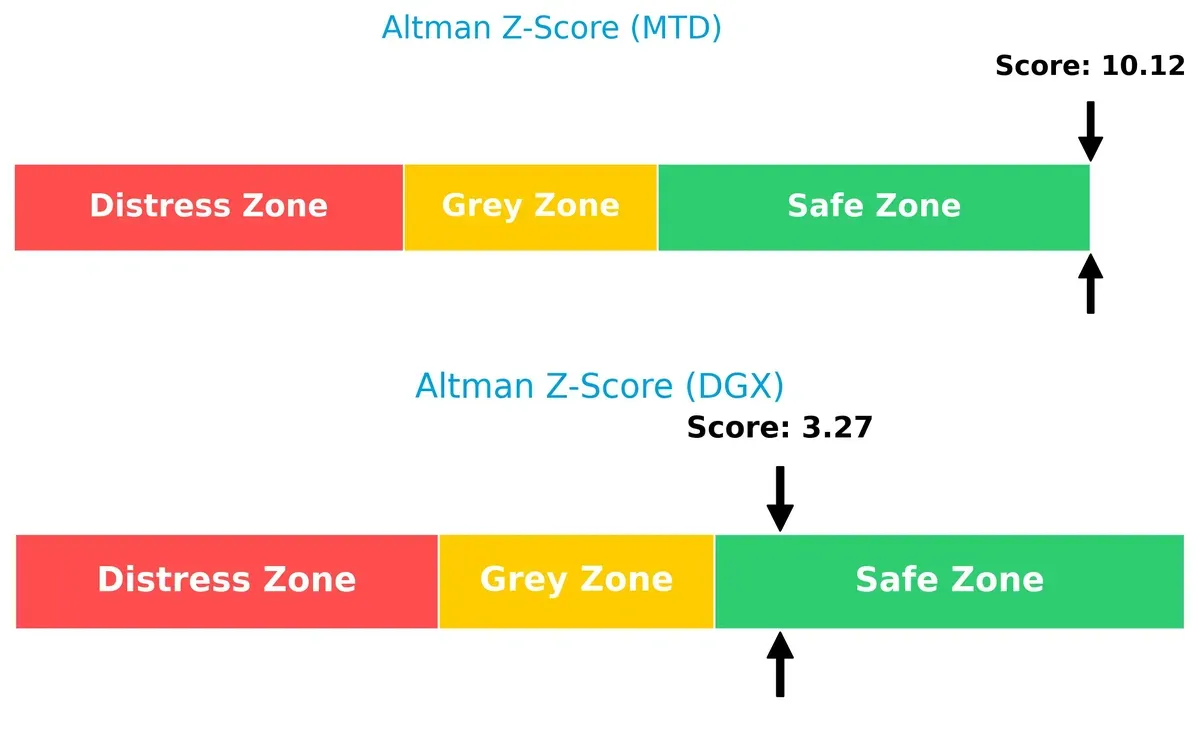
Bankruptcy Risk: Solvency Showdown
Mettler-Toledo’s Altman Z-Score of 10.1 significantly exceeds Quest Diagnostics’ 3.27, implying superior financial stability and a safer long-term outlook in this cycle:
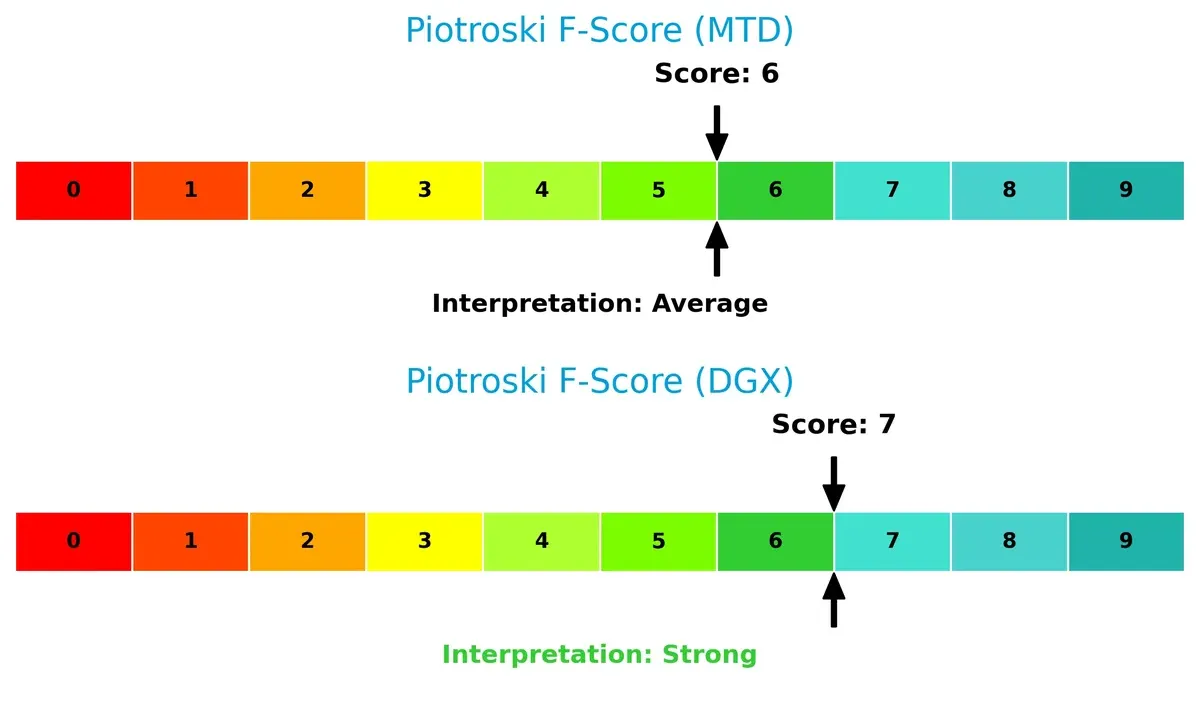
Financial Health: Quality of Operations
Quest Diagnostics scores a 7 on the Piotroski scale, indicating strong financial health. Mettler-Toledo’s 6 is average, suggesting some internal metric weaknesses compared to Quest’s more robust operational quality:
How are the two companies positioned?
This section dissects MTD and DGX’s operational DNA by comparing their revenue distribution and internal dynamics. The goal is to confront their economic moats to identify which model delivers the most resilient, sustainable advantage today.
Revenue Segmentation: The Strategic Mix
The following comparison dissects how Mettler-Toledo International and Quest Diagnostics diversify their income streams and where their primary sector bets lie:
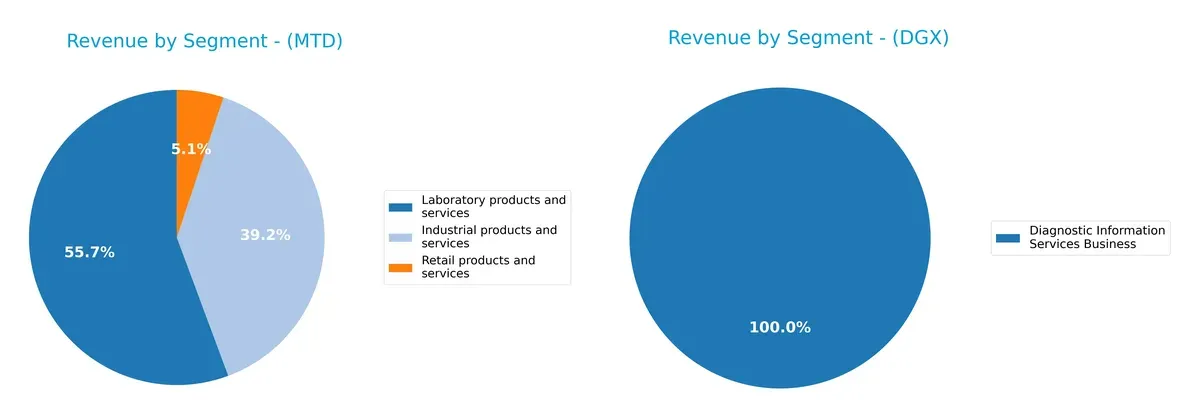
Mettler-Toledo shows a balanced revenue split with $2.24B from Laboratory products and $1.58B from Industrial products, plus $206M in Retail. Quest Diagnostics heavily pivots on $9.61B from Diagnostic Information Services in 2024, with minimal contribution from other segments. Mettler-Toledo’s diverse mix reduces concentration risk, while Quest Diagnostics’ dominance in diagnostics signals strong ecosystem lock-in but exposes it to sector-specific shocks.
Strengths and Weaknesses Comparison
This table compares the strengths and weaknesses of Mettler-Toledo International Inc. and Quest Diagnostics Incorporated:
MTD Strengths
- Diverse revenue streams across industrial, laboratory, and retail products
- High net margin at 21.59%
- Strong ROIC of 35.95% indicating efficient capital use
- Favorable interest coverage ratio of 16.31
- Solid asset turnover at 1.08 and fixed asset turnover at 4.76
- Global presence with sales in Americas, Europe, and Asia
DGX Strengths
- Large revenue base focused on diagnostic information services
- Favorable WACC of 5.91% supporting lower capital costs
- Favorable quick ratio at 1.02 indicating liquidity strength
- Positive interest coverage ratio of 6.2
- Favorable fixed asset turnover at 3.57
- Dividend yield near 2%, providing income to investors
MTD Weaknesses
- Negative ROE at -3677.41% signals possible accounting or operational issues
- High debt to assets ratio at 57.97% raises financial leverage concerns
- Elevated WACC at 10.01% implies relatively expensive capital
- Unfavorable P/E at 33.06 may indicate overvaluation
- Neutral current and quick ratios suggest moderate liquidity risks
- Zero dividend yield limits income appeal
DGX Weaknesses
- Moderate net margin at 8.82% reflects margin pressure
- Neutral ROE and ROIC suggest average profitability and capital returns
- Debt-to-equity greater than 1 indicates higher leverage risk
- Neutral asset turnover at 0.61 points to lower efficiency
- Neutral P/E and PB ratios show fair valuation without strong premium
- Lack of geographic diversification with no reported international sales
MTD shows strengths in profitability and diversified product lines but faces risks from high leverage and negative ROE. DGX has stable liquidity and lower capital costs but must manage moderate profitability and geographic concentration. These profiles impact their strategic options in managing growth, risk, and capital allocation.
The Moat Duel: Analyzing Competitive Defensibility
A structural moat is the only true shield protecting long-term profits from relentless competitive erosion. Let’s dissect the moats of two industry players:
Mettler-Toledo International Inc.: Precision Instruments’ Cost & Quality Moat
Mettler-Toledo’s moat stems from superior precision instruments and integrated software, yielding a high ROIC well above WACC at 26%. This translates to stable 28% EBIT margins and resilient pricing power. In 2026, expanding analytical software deepens its moat against commoditization risks.
Quest Diagnostics Incorporated: Diagnostic Service Network Moat
Quest Diagnostics relies on its extensive diagnostic network and brand recognition, but with ROIC just above WACC by 1%, its moat is thinner. Margins hover around 14% EBIT, lagging Mettler-Toledo. Future growth depends on tech upgrades and service diversification to stave off market disruption.
Precision Engineering vs. Diagnostic Network: The Moat Faceoff
Mettler-Toledo’s moat is wider and deeper, driven by superior capital efficiency and margin stability. Quest’s network offers scale but struggles with declining ROIC and margin pressure. Mettler-Toledo is better positioned to defend and grow its market share in 2026.
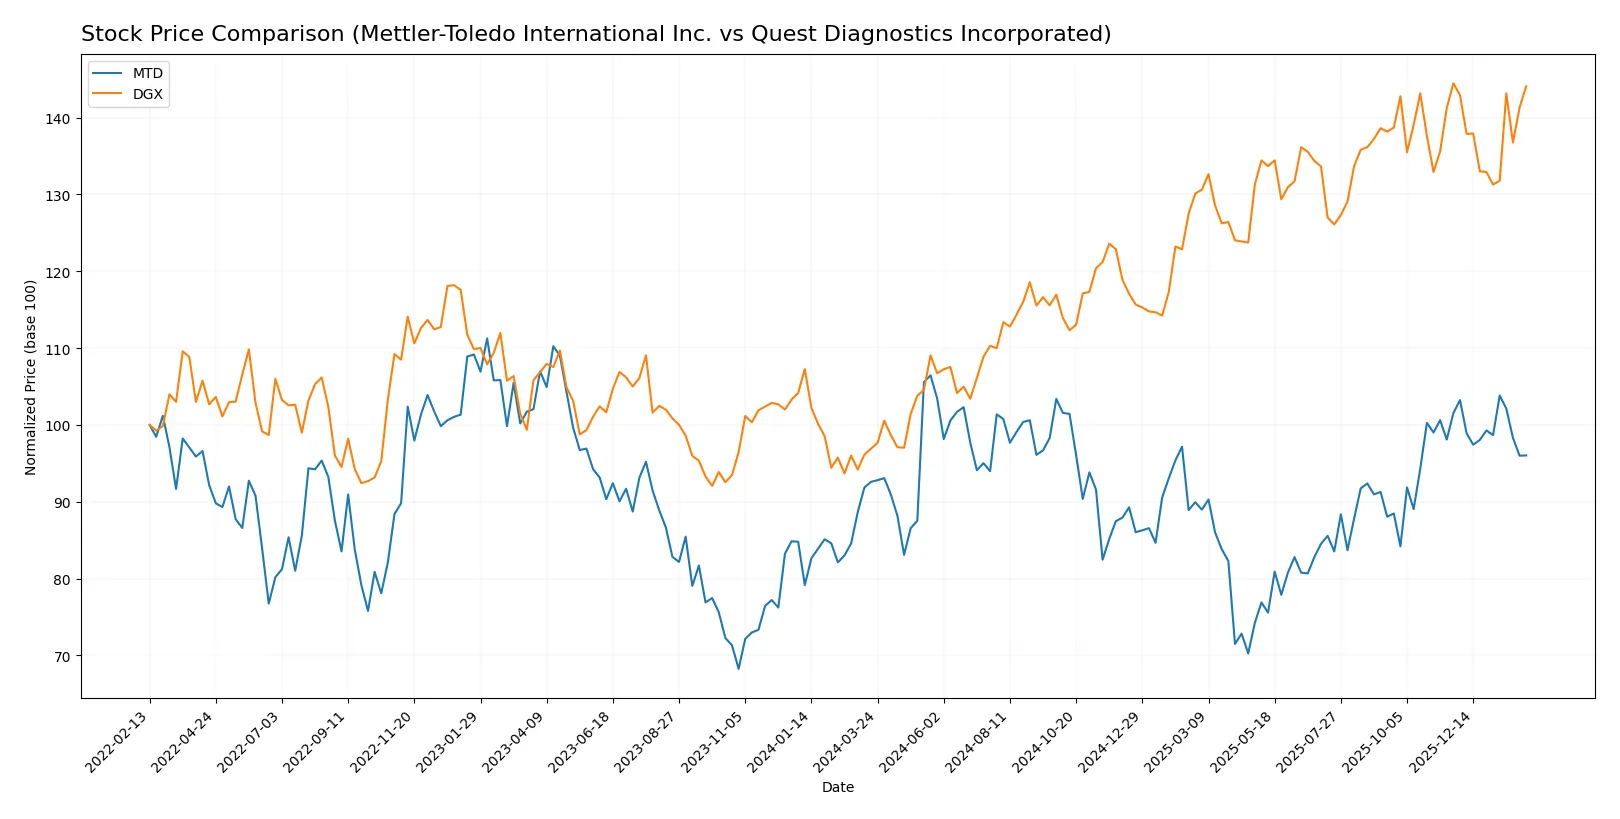
Which stock offers better returns?
Over the past 12 months, Mettler-Toledo and Quest Diagnostics showed strong price movements with contrasting acceleration and volume trends. Their trading patterns reveal different momentum dynamics.
Trend Comparison
Mettler-Toledo’s stock price increased 3.71% over the past year, indicating a bullish trend with decelerating momentum. It reached a high of 1522.75 and a low of 1004.96 during this period.
Quest Diagnostics posted a 48.67% price gain, signaling a strong bullish trend despite deceleration. Its price ranged from a low of 128.28 to a high of 191.25, with lower volatility than Mettler-Toledo.
Quest Diagnostics outperformed Mettler-Toledo with a significantly higher annual return, maintaining a steadier upward trajectory despite deceleration in momentum.
Target Prices
Analysts show a confident target price range for Mettler-Toledo and Quest Diagnostics, signaling moderate upside potential.
| Company | Target Low | Target High | Consensus |
|---|---|---|---|
| Mettler-Toledo International Inc. | 1400 | 1600 | 1504.17 |
| Quest Diagnostics Incorporated | 190 | 215 | 203.1 |
The consensus targets for both stocks exceed current prices, suggesting analysts expect price appreciation. Mettler-Toledo’s target implies roughly a 9% premium, while Quest Diagnostics shows about a 6.5% upside potential.

Don’t Let Luck Decide Your Entry Point
Optimize your entry points with our advanced ProRealTime indicators. You’ll get efficient buy signals with precise price targets for maximum performance. Start outperforming now!
How do institutions grade them?
The following tables summarize recent institutional grades for Mettler-Toledo International Inc. and Quest Diagnostics Incorporated:
Mettler-Toledo International Inc. Grades
The table below shows recent ratings and grade changes from major financial institutions.
| Grading Company | Action | New Grade | Date |
|---|---|---|---|
| Barclays | Maintain | Overweight | 2025-12-15 |
| Wells Fargo | Maintain | Equal Weight | 2025-12-15 |
| Citigroup | Maintain | Buy | 2025-11-10 |
| Wells Fargo | Maintain | Equal Weight | 2025-11-10 |
| Stifel | Maintain | Buy | 2025-11-10 |
| Barclays | Maintain | Overweight | 2025-11-10 |
| JP Morgan | Maintain | Neutral | 2025-10-09 |
| Evercore ISI Group | Maintain | Outperform | 2025-10-07 |
| Barclays | Maintain | Overweight | 2025-10-02 |
| B of A Securities | Maintain | Neutral | 2025-09-22 |
Quest Diagnostics Incorporated Grades
Here are recent institutional ratings and grade changes for Quest Diagnostics.
| Grading Company | Action | New Grade | Date |
|---|---|---|---|
| Piper Sandler | Maintain | Neutral | 2025-10-27 |
| Barclays | Maintain | Equal Weight | 2025-10-22 |
| Truist Securities | Maintain | Hold | 2025-10-22 |
| Jefferies | Maintain | Buy | 2025-10-21 |
| Leerink Partners | Maintain | Outperform | 2025-10-21 |
| UBS | Maintain | Neutral | 2025-10-17 |
| Mizuho | Maintain | Outperform | 2025-10-17 |
| Evercore ISI Group | Maintain | In Line | 2025-10-08 |
| Barclays | Maintain | Equal Weight | 2025-10-02 |
| Baird | Downgrade | Neutral | 2025-08-25 |
Which company has the best grades?
Mettler-Toledo International holds more consistently positive grades, including multiple “Buy,” “Overweight,” and “Outperform” ratings. Quest Diagnostics shows a mix of “Neutral,” “Equal Weight,” and some “Outperform” grades but also a recent downgrade. Investors may interpret Mettler-Toledo’s stronger consensus as a signal of greater confidence from analysts.
Risks specific to each company
The following categories identify the critical pressure points and systemic threats facing both firms in the 2026 market environment:
1. Market & Competition
Mettler-Toledo International Inc. (MTD)
- Operates in precision instruments with strong industrial niche but faces aggressive innovation cycles.
Quest Diagnostics Incorporated (DGX)
- Dominates diagnostic services with broad scale but faces increasing competition from emerging digital health firms.
2. Capital Structure & Debt
Mettler-Toledo International Inc. (MTD)
- High debt-to-assets ratio (58%) signals leverage risk despite strong interest coverage (16.3x).
Quest Diagnostics Incorporated (DGX)
- Moderate leverage (44% debt-to-assets) with lower interest coverage (6.2x) reflects balanced but cautious capital use.
3. Stock Volatility
Mettler-Toledo International Inc. (MTD)
- Beta of 1.44 indicates above-market volatility, increasing risk in turbulent markets.
Quest Diagnostics Incorporated (DGX)
- Lower beta of 0.68 shows defensive price behavior, appealing in uncertain conditions.
4. Regulatory & Legal
Mettler-Toledo International Inc. (MTD)
- Subject to global regulatory scrutiny on manufacturing standards and export controls.
Quest Diagnostics Incorporated (DGX)
- Faces stringent healthcare regulations and potential litigation risks inherent in diagnostics.
5. Supply Chain & Operations
Mettler-Toledo International Inc. (MTD)
- Complex global supply chain vulnerable to component shortages and logistic disruptions.
Quest Diagnostics Incorporated (DGX)
- Extensive lab network dependent on stable supply of reagents and skilled personnel.
6. ESG & Climate Transition
Mettler-Toledo International Inc. (MTD)
- Pressure to improve environmental footprint in manufacturing and waste management.
Quest Diagnostics Incorporated (DGX)
- Needs to address sustainable healthcare delivery and data privacy concerns actively.
7. Geopolitical Exposure
Mettler-Toledo International Inc. (MTD)
- Exposure to trade tensions affecting cross-border sales and supply chains.
Quest Diagnostics Incorporated (DGX)
- Primarily U.S.-centric with limited direct geopolitical risks but indirect impacts possible.
Which company shows a better risk-adjusted profile?
Mettler-Toledo’s highest risk stems from heavy leverage amid volatile markets, despite robust operational metrics. Quest Diagnostics faces regulatory and operational complexity but benefits from lower financial risk and defensive stock behavior. Its stronger Altman Z-Score (3.27 vs. 10.12 for MTD, both safe zones) and Piotroski score (7 vs. 6) confirm better financial resilience. Quest’s moderate leverage and stable cash flow position it better for risk-adjusted stability in 2026’s evolving healthcare landscape.
Final Verdict: Which stock to choose?
Mettler-Toledo International Inc. (MTD) wields unmatched capital efficiency, consistently generating returns well above its cost of capital. This superpower signals a durable competitive advantage and strong value creation. Its point of vigilance lies in its relatively high leverage and volatile equity returns. MTD suits aggressive growth portfolios that can tolerate cyclicality and complexity.
Quest Diagnostics Incorporated (DGX) offers a strategic moat rooted in steady recurring revenue and solid operational cash flow. It provides a safer profile with more stable margins and healthier liquidity ratios than MTD. DGX fits well within GARP (Growth at a Reasonable Price) portfolios seeking moderate growth with lower financial risk.
If you prioritize superior capital allocation and long-term value creation, MTD outshines with its powerful ROIC advantage and growth trajectory. However, if you seek better stability and a more conservative risk profile, DGX offers a compelling choice with its recurring revenue moat and steadier fundamentals. Each company caters to distinct investor avatars, making risk tolerance and strategy the ultimate decision drivers.
Disclaimer: Investment carries a risk of loss of initial capital. The past performance is not a reliable indicator of future results. Be sure to understand risks before making an investment decision.
Go Further
I encourage you to read the complete analyses of Mettler-Toledo International Inc. and Quest Diagnostics Incorporated to enhance your investment decisions: