Home > Comparison > Financial Services > MET vs PRU
The strategic rivalry between MetLife, Inc. and Prudential Financial, Inc. shapes the life insurance industry’s competitive landscape. MetLife operates a globally diversified insurance and asset management model, while Prudential integrates investment management with broad insurance services. This head-to-head contrasts a diversified multinational versus a multi-segment financial powerhouse. This analysis aims to identify which trajectory delivers superior risk-adjusted returns for a diversified portfolio in the evolving financial services sector.

Table of contents
Companies Overview
MetLife and Prudential Financial anchor the U.S. life insurance market with broad global reach and diversified revenue streams.
MetLife, Inc.: Global Insurance Powerhouse
MetLife dominates the life insurance sector through a diversified portfolio spanning life, disability, and health products. Its core revenue engine derives from insurance premiums and asset management across five global segments. In 2026, MetLife focuses strategically on expanding longevity reinsurance and pension risk transfer solutions to secure steady, long-term cash flows.
Prudential Financial, Inc.: Diversified Financial Services Leader
Prudential leverages a multi-segment approach combining insurance, investment management, and retirement solutions. Its competitive advantage lies in integrating asset management with annuity and life insurance sales to institutional and retail clients. The company’s 2026 strategy emphasizes digital distribution and broadening its retirement product offerings, targeting affluent and mass affluent markets.
Strategic Collision: Similarities & Divergences
Both firms prioritize life insurance but diverge in approach—MetLife emphasizes global insurance and pension risk management, while Prudential integrates investment management with insurance. Their primary battleground is the U.S. retirement and annuity market. MetLife offers a stable, insurance-centric profile; Prudential presents a growth-oriented, asset management hybrid investment case.
Income Statement Comparison
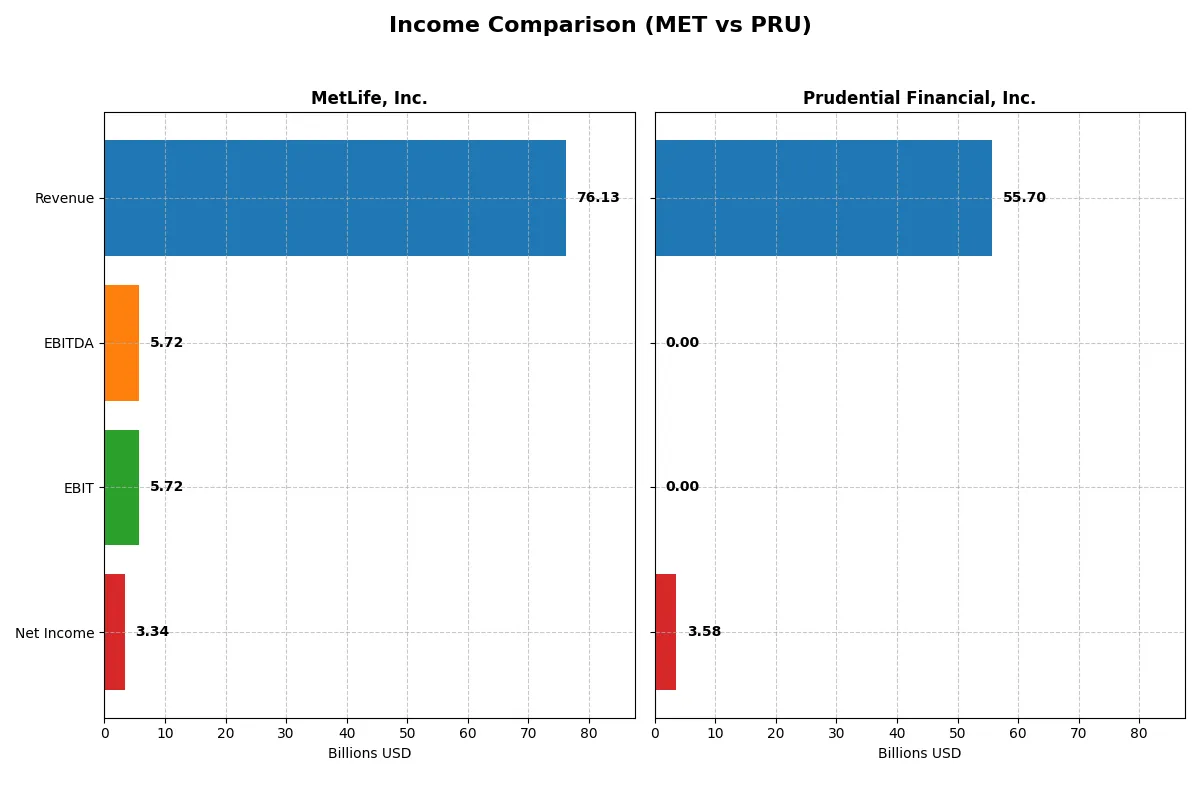
This data dissects the core profitability and scalability of both corporate engines to reveal who dominates the bottom line:
| Metric | MetLife, Inc. (MET) | Prudential Financial, Inc. (PRU) |
|---|---|---|
| Revenue | 76.1B | 55.7B |
| Cost of Revenue | 58.8B | 0 |
| Operating Expenses | 12.4B | 6.8B |
| Gross Profit | 17.3B | 55.7B |
| EBITDA | 5.7B | 0 |
| EBIT | 5.7B | 0 |
| Interest Expense | 1.1B | 2.1B |
| Net Income | 3.3B | 3.6B |
| EPS | 4.73 | 10.16 |
| Fiscal Year | 2025 | 2025 |
Income Statement Analysis: The Bottom-Line Duel
This income statement comparison reveals how effectively each company converts sales into profit, reflecting operational strength and financial discipline.
MetLife, Inc. Analysis
MetLife’s revenue climbed steadily to $76.1B in 2025, up nearly 9% year-over-year. However, net income shrank to $3.3B, reflecting margin pressure. Gross margin softened to 22.7%, and net margin contracted to 4.4%, signaling rising costs and declining profitability momentum in the latest fiscal year.
Prudential Financial, Inc. Analysis
Prudential’s 2025 revenue dropped 21% to $55.7B, yet net income rose to $3.6B, lifting net margin to 6.4%. The firm’s gross margin stands at a perfect 100% due to accounting nuances, but EBIT margin collapsed to zero. Despite revenue decline, Prudential improved earnings per share by 36%, showing resilient bottom-line efficiency.
Margin Resilience vs. Revenue Growth
MetLife delivers solid top-line growth but struggles to maintain margins and net income, reflecting operational headwinds. Prudential faces revenue contraction but sustains profitability with a stronger net margin and EPS growth. For investors, Prudential’s profile favors earnings efficiency, while MetLife emphasizes scale expansion with margin risks.
Financial Ratios Comparison
These vital ratios act as a diagnostic tool to expose the underlying fiscal health, valuation premiums, and capital efficiency of these companies:
| Ratios | MetLife, Inc. (MET) | Prudential Financial, Inc. (PRU) |
|---|---|---|
| ROE | 16.13% (2024) | 11.02% (2025) |
| ROIC | 6.33% (2024) | 0.66% (2025) |
| P/E | 12.75 (2024) | 11.10 (2025) |
| P/B | 2.06 (2024) | 1.22 (2025) |
| Current Ratio | 0 (2024) | 0 (2025) |
| Quick Ratio | 0 (2024) | 0 (2025) |
| D/E | 0.68 (2024) | 0.63 (2025) |
| Debt-to-Assets | 2.76% (2024) | 2.62% (2025) |
| Interest Coverage | 5.42 (2024) | 3.15 (2025) |
| Asset Turnover | 0.10 (2024) | 0.07 (2025) |
| Fixed Asset Turnover | 37.78 (2024) | 0 (2025) |
| Payout ratio | 39.0% (2024) | 53.1% (2025) |
| Dividend yield | 3.06% (2024) | 4.78% (2025) |
| Fiscal Year | 2024 | 2025 |
Efficiency & Valuation Duel: The Vital Signs
Financial ratios act as a company’s DNA, exposing hidden risks and revealing operational strengths behind the surface.
MetLife, Inc.
MetLife’s profitability shows weaknesses with an unfavorable ROE and net margin near 4.4%. Its P/E of 15.7 looks fairly valued. The firm maintains a 2.85% dividend yield, signaling steady shareholder returns. However, several liquidity ratios are poor, indicating potential operational stress despite favorable debt metrics.
Prudential Financial, Inc.
Prudential delivers a neutral net margin of 6.4% and an 11% ROE, suggesting moderate profitability. The stock trades at a favorable P/E of 11.1 and offers a strong 4.78% dividend yield. Some solvency metrics raise concern, including weak interest coverage, but overall valuation and cash returns remain appealing for income-focused investors.
Valuation and Profitability: Balancing Yield and Risk
MetLife shows a stretched operational profile with weaker profitability and liquidity but stable dividends. Prudential offers better earnings efficiency and a higher dividend yield, albeit with some solvency risks. Investors prioritizing income may lean toward Prudential, while those cautious of leverage might find MetLife’s balance sheet less risky.
Which one offers the Superior Shareholder Reward?
I observe MetLife targets steady dividends with a 2.85% yield and a moderate 45% payout ratio, maintaining buybacks to enhance shareholder returns. Prudential offers a higher 4.78% yield but with a riskier 53% payout ratio and less visible buyback activity. MetLife’s balanced distribution, supported by consistent free cash flow, suggests more sustainable long-term value. Prudential’s higher yield appeals but carries greater risk given its leverage and coverage ratios. For 2026, I favor MetLife’s disciplined capital allocation and buyback intensity as the superior total return vehicle.
Comparative Score Analysis: The Strategic Profile
The radar chart reveals the fundamental DNA and trade-offs of MetLife, Inc. and Prudential Financial, Inc., highlighting their strategic strengths and vulnerabilities:
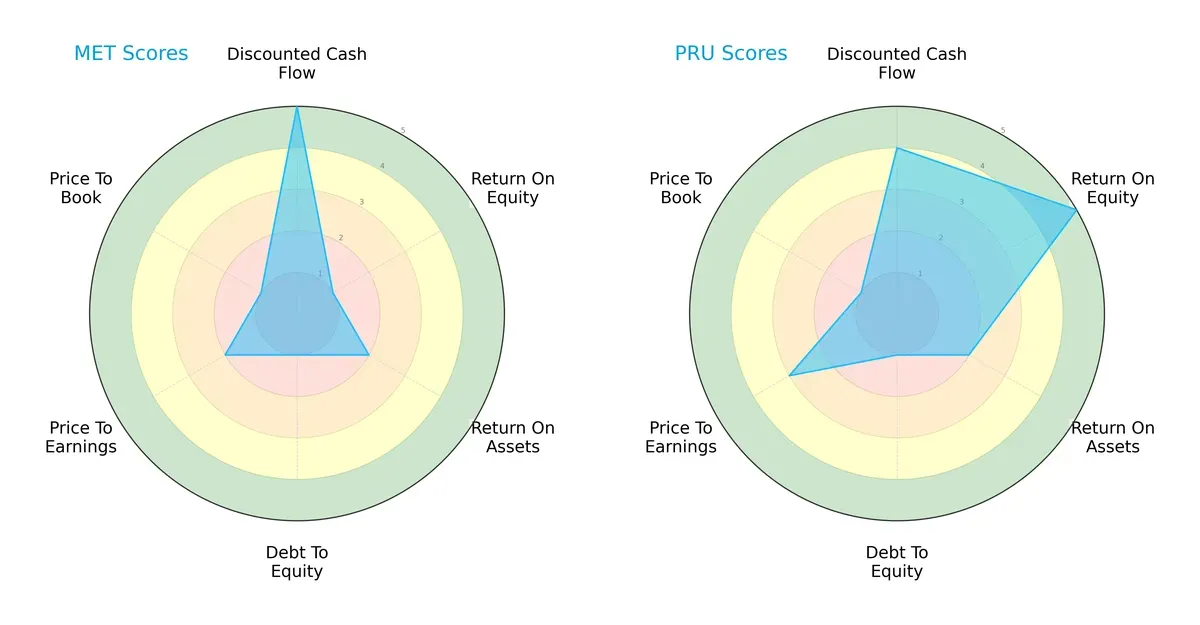
Prudential shows a more balanced profile with strong ROE (5) and favorable DCF (4) scores, signaling efficient equity use and solid valuation. MetLife relies heavily on a strong DCF score (5) but suffers from weak profitability (ROE 1) and financial leverage (Debt/Equity 1). Both firms struggle with price-to-book metrics, but Prudential edges out with moderate P/E (3) versus MetLife’s unfavorable rating (2). I see Prudential as the more consistently managed firm, while MetLife depends on cash flow advantages amid operational challenges.
Financial Health: Quality of Operations
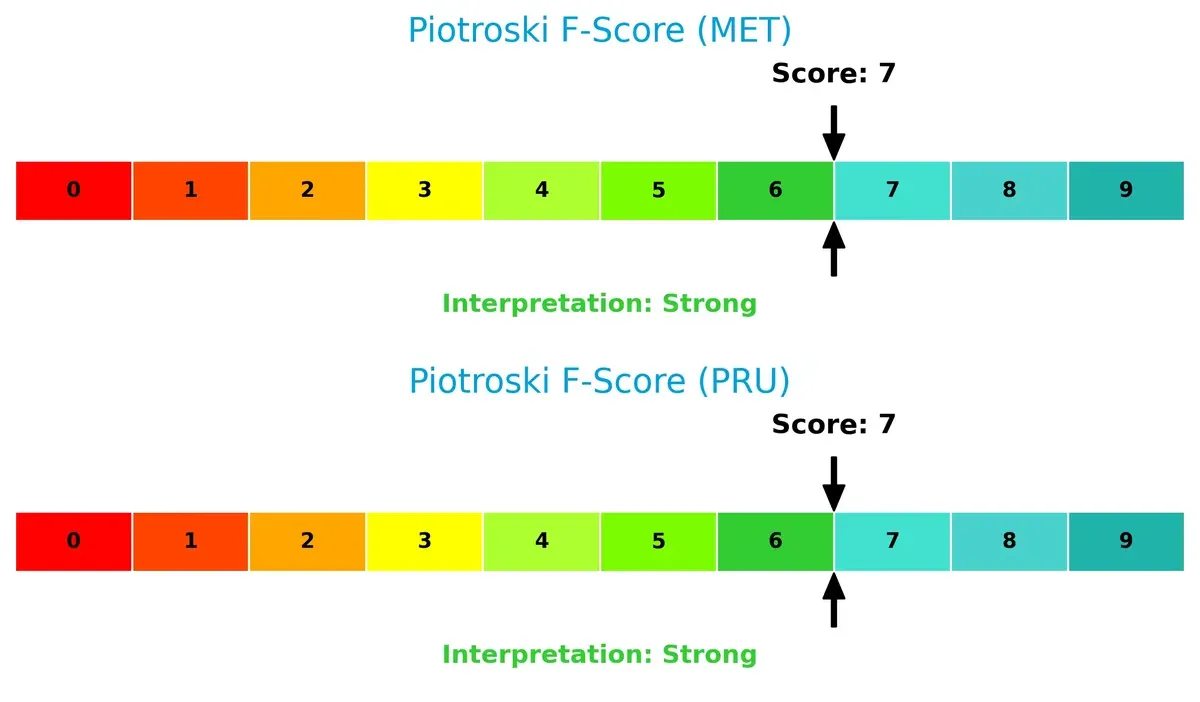
Both MetLife and Prudential register a Piotroski F-Score of 7, indicating strong financial health. This score reflects robust profitability, liquidity, and operational efficiency with no glaring red flags in their internal metrics:
How are the two companies positioned?
This section dissects MetLife and Prudential’s operational DNA by comparing their revenue distribution and internal strengths and weaknesses. The goal is to confront their economic moats and identify which model offers the most resilient competitive advantage today.
Revenue Segmentation: The Strategic Mix
This visual comparison dissects how MetLife, Inc. and Prudential Financial, Inc. diversify their income streams and where their primary sector bets lie:
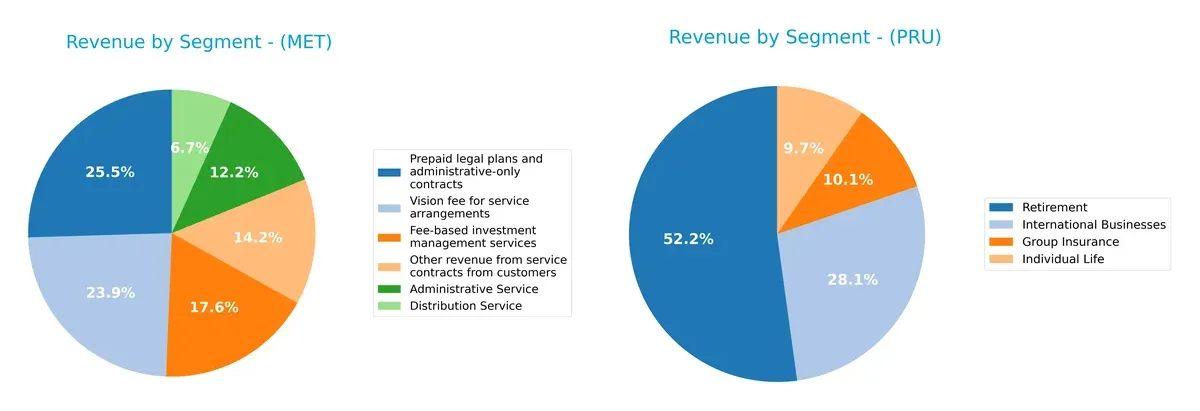
MetLife anchors its revenue in the United States segment with $45.8B in 2022, while Asia and MetLife Holdings contribute $11.4B and $9.2B respectively, showing moderate diversification. Prudential pivots on Retirement income at $33.3B in 2024, supported by $17.9B from International Businesses and smaller Group Insurance and Individual Life segments. MetLife’s geographic spread reduces concentration risk; Prudential relies more heavily on retirement services, exposing it to demographic shifts.
Strengths and Weaknesses Comparison
This table compares the strengths and weaknesses of MetLife and Prudential Financial based on diversification, profitability, financials, innovation, global presence, and market share:
MetLife Strengths
- Diverse revenue streams including Group Benefits, Retirement, Asia, Latin America, and EMEA
- Solid global presence with strong U.S. and Asian markets
- Favorable debt-to-assets and interest coverage ratios
- Attractive dividend yield of 2.85%
Prudential Strengths
- Balanced international and U.S. business segments including Retirement, Group Insurance, and Individual Life
- Favorable P/E and P/B ratios indicate market confidence
- Higher dividend yield of 4.78%
- Favorable debt-to-assets ratio supporting financial stability
MetLife Weaknesses
- Unfavorable profitability ratios: net margin 4.39%, ROE and ROIC at zero
- Poor liquidity indicated by zero current and quick ratios
- Unavailable WACC and weak asset turnover metrics
- Slightly unfavorable overall financial ratios
Prudential Weaknesses
- ROIC below WACC at 0.66%, indicating potential capital inefficiency
- Unfavorable interest coverage ratio at zero
- Weak asset turnover and fixed asset turnover values
- Slightly unfavorable overall financial ratios
MetLife’s strengths lie in diversified revenue and solid debt metrics but its profitability and liquidity raise red flags. Prudential shows better profitability and market valuation but faces operational efficiency and coverage challenges. Both companies exhibit global reach with nuanced financial strengths and weaknesses that will impact their strategic priorities.
The Moat Duel: Analyzing Competitive Defensibility
A structural moat protects long-term profits from competition erosion. Without it, firms cannot sustain economic profit. Let’s examine MetLife and Prudential’s moats:
MetLife, Inc.: Geographic Diversification Moat
MetLife’s moat stems from broad geographic diversification across the U.S., Asia, and Latin America. This spreads risk and stabilizes revenue, reflected in steady 8.9% revenue growth in 2025. However, declining profitability signals margin pressure. Expansion into emerging markets could deepen this moat if managed prudently.
Prudential Financial, Inc.: Investment Management & Market Reach
Prudential’s moat relies on integrated investment management and strong institutional client relationships, especially in Japan and the U.S. Despite a 21% revenue decline in 2025, its improving net margin and EPS growth show operational resilience. Continued innovation in retirement solutions could disrupt competitors and fortify its position.
Diversification vs. Integration: Which Moat Withstands Market Cycles?
MetLife leverages diversification to smooth revenue volatility, while Prudential depends on integrated asset management and client lock-in. I see Prudential’s moat as narrower but potentially deeper due to client stickiness. MetLife faces margin erosion risks, making Prudential better positioned to defend market share amid sector headwinds.
Which stock offers better returns?
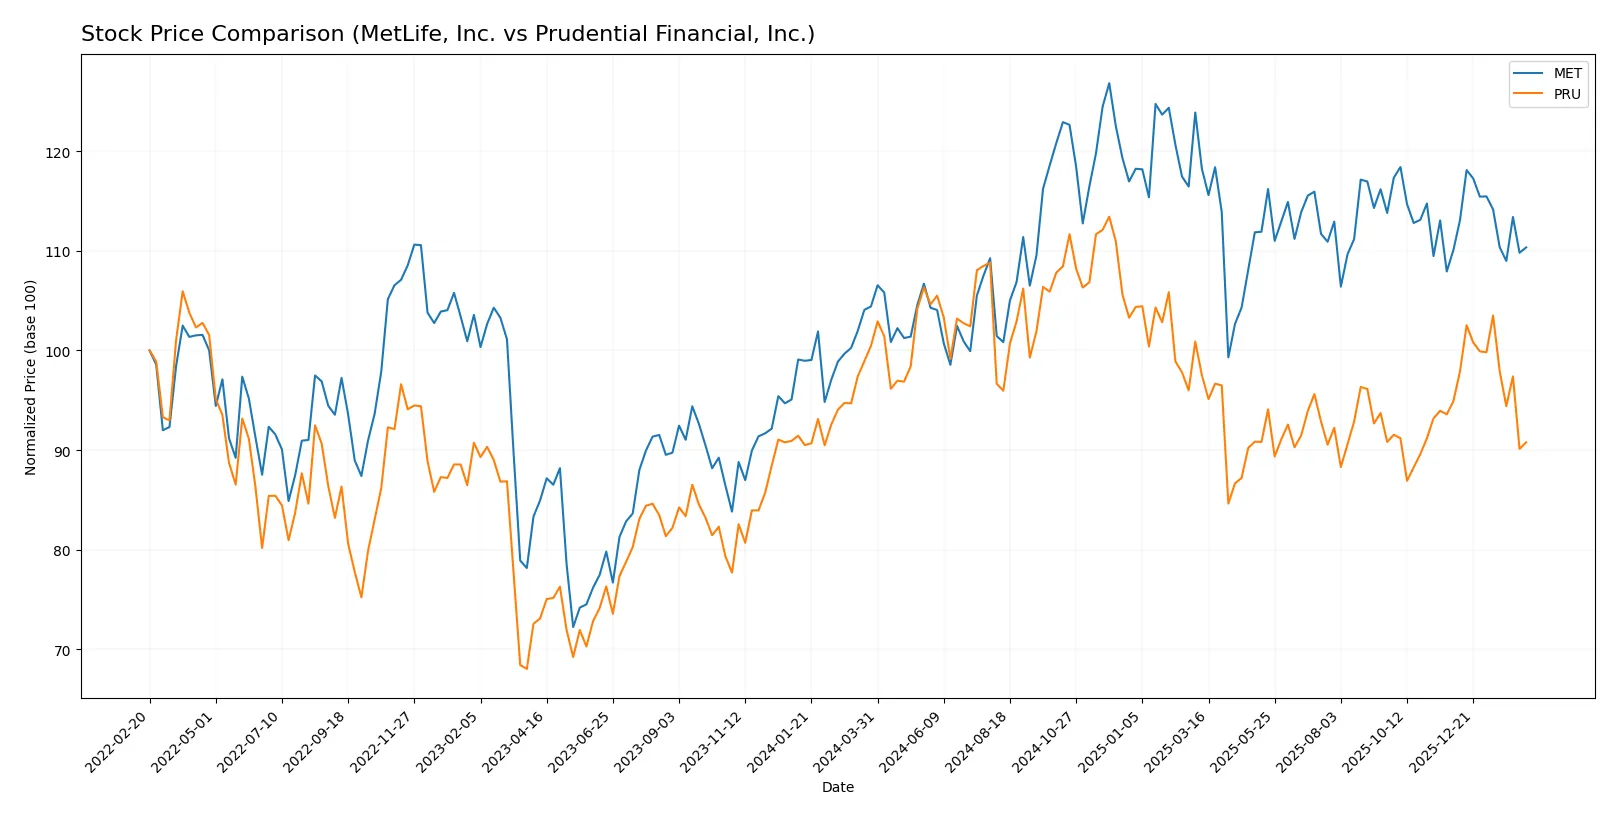
The past 12 months show contrasting price dynamics for MetLife, Inc. and Prudential Financial, Inc., with MetLife gaining steadily while Prudential declines amid decelerating trends.
Trend Comparison
MetLife’s stock rose 5.68% over the past year, marking a bullish yet decelerating trend. Its price range spanned from 68.55 to 88.23, with recent slight neutral movement.
Prudential’s stock fell 9.64% over the same period, reflecting a bearish and decelerating trend. Volatility was higher with prices swinging between 96.53 and 129.41, and recent loss acceleration.
Comparing both, MetLife outperformed Prudential in market returns, showing positive price appreciation versus Prudential’s notable decline over the past year.
Target Prices
Analysts present a confident target price consensus for MetLife, Inc. and Prudential Financial, Inc.
| Company | Target Low | Target High | Consensus |
|---|---|---|---|
| MetLife, Inc. | 84 | 102 | 95.5 |
| Prudential Financial, Inc. | 110 | 126 | 118.43 |
The consensus targets exceed current prices by 24% for MetLife and 14% for Prudential, signaling potential upside in both stocks.

Don’t Let Luck Decide Your Entry Point
Optimize your entry points with our advanced ProRealTime indicators. You’ll get efficient buy signals with precise price targets for maximum performance. Start outperforming now!
How do institutions grade them?
Institutional grades for MetLife, Inc. and Prudential Financial, Inc. provide insight into analyst sentiment for both companies:
MetLife, Inc. Grades
The following table summarizes recent grades issued by reputable financial institutions for MetLife, Inc.:
| Grading Company | Action | New Grade | Date |
|---|---|---|---|
| UBS | Maintain | Buy | 2026-02-05 |
| Wells Fargo | Maintain | Overweight | 2026-01-13 |
| UBS | Maintain | Buy | 2026-01-08 |
| Wells Fargo | Maintain | Overweight | 2025-12-23 |
| Keefe, Bruyette & Woods | Maintain | Outperform | 2025-11-11 |
| Wells Fargo | Maintain | Overweight | 2025-11-07 |
| UBS | Maintain | Buy | 2025-11-06 |
| B of A Securities | Maintain | Buy | 2025-11-06 |
| B of A Securities | Maintain | Buy | 2025-10-13 |
| Wells Fargo | Maintain | Overweight | 2025-10-08 |
Prudential Financial, Inc. Grades
Below is a summary of recent grades from established grading companies for Prudential Financial, Inc.:
| Grading Company | Action | New Grade | Date |
|---|---|---|---|
| Evercore ISI Group | Maintain | In Line | 2026-02-05 |
| JP Morgan | Maintain | Neutral | 2026-02-04 |
| Wells Fargo | Maintain | Equal Weight | 2026-01-13 |
| UBS | Maintain | Neutral | 2026-01-08 |
| Piper Sandler | Maintain | Neutral | 2025-12-23 |
| Keefe, Bruyette & Woods | Maintain | Market Perform | 2025-11-03 |
| Evercore ISI Group | Maintain | In Line | 2025-10-30 |
| Barclays | Maintain | Equal Weight | 2025-10-08 |
| Morgan Stanley | Maintain | Equal Weight | 2025-10-07 |
| Morgan Stanley | Maintain | Equal Weight | 2025-08-18 |
Which company has the best grades?
MetLife, Inc. consistently receives stronger grades such as Buy, Overweight, and Outperform. Prudential Financial, Inc. mainly earns Neutral, Equal Weight, and Market Perform ratings. Investors may interpret MetLife’s higher grades as reflecting more bullish institutional sentiment, while Prudential’s grades indicate a more cautious or balanced outlook.
Risks specific to each company
The following categories identify the critical pressure points and systemic threats facing both firms in the 2026 market environment:
1. Market & Competition
MetLife, Inc.
- Faces tough competition in diverse global insurance markets with pressured net margins and unfavorable ROE.
Prudential Financial, Inc.
- Operates in competitive markets with moderate net margin and ROE; slightly better profitability metrics than MetLife.
2. Capital Structure & Debt
MetLife, Inc.
- Shows favorable debt-to-equity and interest coverage ratios, indicating manageable leverage risk.
Prudential Financial, Inc.
- Has moderately favorable debt-to-assets but weak interest coverage, raising concerns over debt servicing capacity.
3. Stock Volatility
MetLife, Inc.
- Maintains a low beta of 0.74, suggesting lower volatility and market risk sensitivity.
Prudential Financial, Inc.
- Exhibits higher beta at 0.95, implying greater stock price volatility and sensitivity to market swings.
4. Regulatory & Legal
MetLife, Inc.
- Operates under stringent US and international insurance regulations; no major legal red flags noted.
Prudential Financial, Inc.
- Subject to complex regulations; no significant recent legal issues but ongoing compliance demands persist.
5. Supply Chain & Operations
MetLife, Inc.
- Broad global footprint with diverse product lines; operational complexity could impact efficiency.
Prudential Financial, Inc.
- Diverse segments and international exposure present operational risks but also growth opportunities.
6. ESG & Climate Transition
MetLife, Inc.
- Increasing pressure to integrate ESG into underwriting and investments; transition risks rising.
Prudential Financial, Inc.
- Faces similar ESG challenges; must align portfolios with climate goals amid regulatory scrutiny.
7. Geopolitical Exposure
MetLife, Inc.
- Geographic diversification cushions geopolitical shocks but increases exposure to regional risks.
Prudential Financial, Inc.
- Also globally diversified; geopolitical tensions in key markets could affect operations and earnings.
Which company shows a better risk-adjusted profile?
MetLife’s strongest risk lies in its weak profitability metrics despite solid capital structure. Prudential’s most concerning risk is its poor interest coverage amid higher volatility. Overall, Prudential’s better ROE and dividend yield suggest a marginally superior risk-adjusted profile, though its financial distress signals merit caution.
Final Verdict: Which stock to choose?
MetLife’s superpower lies in its robust cash flow generation and disciplined capital allocation. Its ability to maintain a steady dividend yield while managing debt prudently supports income-focused investors. A point of vigilance is its declining profitability trend, which could pressure returns. It fits well in an Income or Conservative Growth portfolio.
Prudential commands a strategic moat through its diversified insurance operations and attractive valuation metrics. It offers a slightly safer profile with a stronger return on equity and a solid Piotroski score, despite some earnings volatility. This makes it suitable for Growth at a Reasonable Price (GARP) investors seeking stability with upside potential.
If you prioritize steady income and cash generation, MetLife is the compelling choice due to its reliable dividend and capital discipline. However, if you seek growth with a margin of safety, Prudential offers better stability and a more favorable valuation, despite recent revenue headwinds. Both require careful monitoring of profitability trends.
Disclaimer: Investment carries a risk of loss of initial capital. The past performance is not a reliable indicator of future results. Be sure to understand risks before making an investment decision.
Go Further
I encourage you to read the complete analyses of MetLife, Inc. and Prudential Financial, Inc. to enhance your investment decisions: