Home > Comparison > Technology > META vs TWLO
The strategic rivalry between Meta Platforms, Inc. and Twilio Inc. shapes the evolution of digital communication technology. Meta, a technology sector titan, excels in immersive social platforms and augmented reality, while Twilio, in communication services, leads with cloud-based customer engagement APIs. This analysis contrasts their distinct operational models and growth strategies to identify which offers superior risk-adjusted returns for a diversified portfolio navigating the fast-changing tech landscape.
Table of contents
Companies Overview
Meta Platforms and Twilio dominate distinct niches within the digital communication ecosystem, shaping user engagement worldwide.
Meta Platforms, Inc.: Social Media and Virtual Reality Powerhouse
Meta Platforms leads the internet content sector with its Family of Apps segment driving revenue through social networking services like Facebook, Instagram, Messenger, and WhatsApp. Its strategic focus in 2026 centers on expanding its augmented and virtual reality capabilities via Reality Labs to deepen user connection through immersive experiences.
Twilio Inc.: Cloud Communication Innovator
Twilio operates a cloud communications platform enabling developers to embed voice, messaging, video, and email functions into software applications. Its core revenue engine hinges on APIs that simplify customer engagement. In 2026, Twilio prioritizes scaling its platform to support seamless, programmable communications for businesses globally.
Strategic Collision: Similarities & Divergences
Both companies compete in digital communication, yet Meta emphasizes a closed ecosystem of consumer apps and immersive tech, while Twilio champions open, developer-centric infrastructure. Their battleground lies in user engagement—Meta targets social connection, Twilio targets business communication integration. These divergent models create distinct investment profiles: Meta leans on massive user scale; Twilio bets on platform flexibility.
Income Statement Comparison
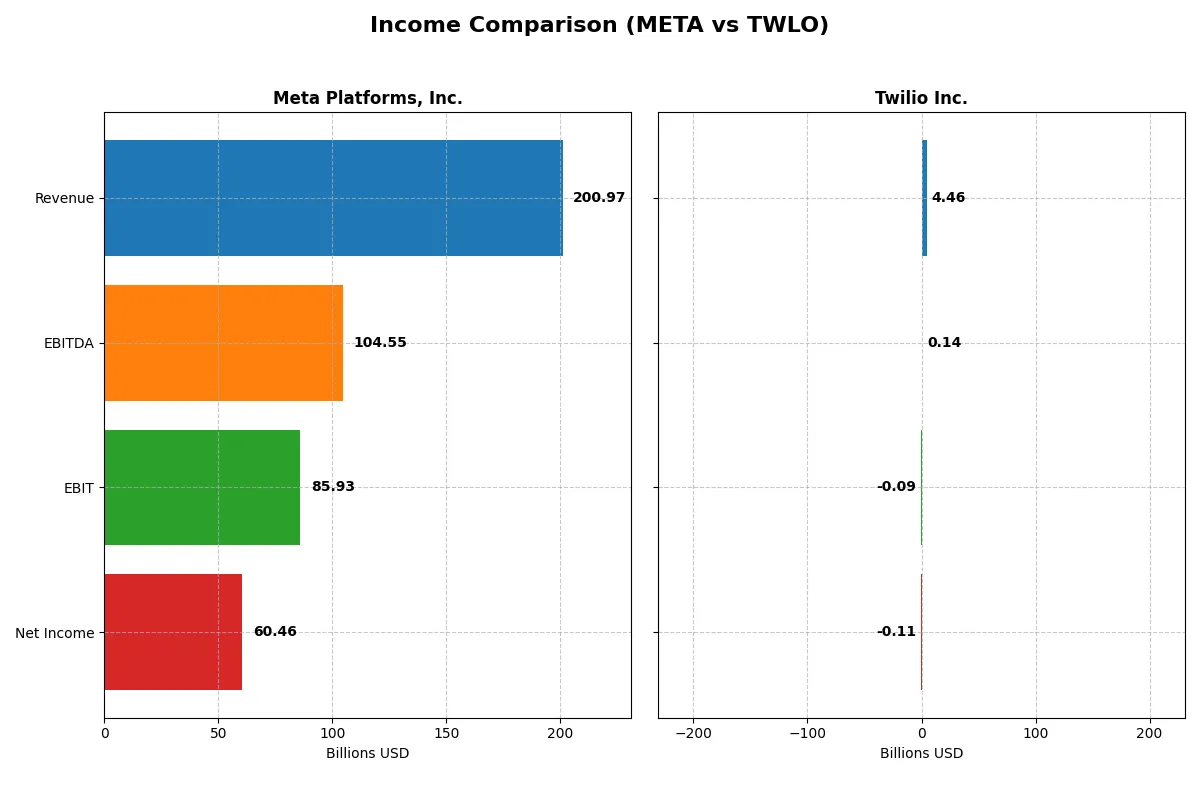
This data dissects the core profitability and scalability of both corporate engines to reveal who dominates the bottom line:
| Metric | Meta Platforms, Inc. (META) | Twilio Inc. (TWLO) |
|---|---|---|
| Revenue | 201B | 4.46B |
| Cost of Revenue | 36.2B | 2.23B |
| Operating Expenses | 81.5B | 2.27B |
| Gross Profit | 165B | 2.23B |
| EBITDA | 104.5B | 136M |
| EBIT | 85.9B | -88.6M |
| Interest Expense | 0 | 0 |
| Net Income | 60.5B | -109M |
| EPS | 23.98 | -0.66 |
| Fiscal Year | 2025 | 2024 |
Income Statement Analysis: The Bottom-Line Duel
This income statement comparison exposes the operational efficiency and profitability trends shaping each company’s financial engine.
Meta Platforms, Inc. Analysis
Meta’s revenue soared from 117.9B in 2021 to 201B in 2025, fueling a net income increase from 39.4B to 60.5B. Its gross margin remains strong at 82%, reflecting tight cost control. Despite a slight net margin dip recently, Meta sustains high operating efficiency, with EBITDA and EBIT margins above 40%, underscoring robust momentum.
Twilio Inc. Analysis
Twilio’s revenue nearly doubled from 1.76B in 2020 to 4.46B in 2024, signaling rapid growth. However, it remains unprofitable, with a slight improvement in net losses from -491M to -109M. Twilio’s gross margin held at 50%, but negative EBIT and net margins highlight ongoing operational challenges. Recent margin improvements hint at accelerating efficiency gains.
Margin Power vs. Revenue Scale
Meta clearly leads on profitability, delivering superior margins and solid net income growth. Twilio impresses with top-line expansion but struggles to convert growth into profits. For investors, Meta’s profile offers dependable earnings power, whereas Twilio’s riskier growth story demands patience for margin turnaround.
Financial Ratios Comparison
These vital ratios act as a diagnostic tool to expose the underlying fiscal health, valuation premiums, and capital efficiency of the companies analyzed:
| Ratios | Meta Platforms, Inc. (META) | Twilio Inc. (TWLO) |
|---|---|---|
| ROE | 27.8% | -1.4% |
| ROIC | 18.0% | -0.4% |
| P/E | 27.5 | -163.9 |
| P/B | 7.66 | 2.25 |
| Current Ratio | 2.60 | 4.20 |
| Quick Ratio | 2.60 | 4.20 |
| D/E (Debt-to-Equity) | 0.39 | 0.14 |
| Debt-to-Assets | 23% | 11% |
| Interest Coverage | 0 (not reported) | 0 (not reported) |
| Asset Turnover | 0.55 | 0.45 |
| Fixed Asset Turnover | 1.02 | 18.24 |
| Payout Ratio | 8.8% | 0% |
| Dividend Yield | 0.32% | 0% |
| Fiscal Year | 2025 | 2024 |
Efficiency & Valuation Duel: The Vital Signs
Financial ratios act as a company’s DNA, revealing hidden risks and operational excellence crucial for investment decisions.
Meta Platforms, Inc.
Meta demonstrates strong profitability with a 27.83% ROE and a 30.08% net margin, signaling efficient operations. However, its valuation appears stretched, with a P/E of 27.52 and P/B of 7.66. Meta maintains favorable leverage and liquidity, paying a modest 0.32% dividend while reinvesting heavily in R&D for growth.
Twilio Inc.
Twilio struggles with negative profitability metrics, including a -1.38% ROE and -2.45% net margin, reflecting operational challenges. Its valuation is less stretched, with a P/E of -163.92 and P/B of 2.25, but interest coverage at zero raises risk concerns. Twilio retains strong liquidity with a quick ratio of 4.2 but offers no dividend, focusing on growth investments.
Premium Valuation vs. Operational Safety
Meta offers a balanced profile of high profitability amid stretched valuation metrics. Twilio’s weaker returns and riskier financial health contrast with its more reasonable valuation. Investors seeking operational efficiency may prefer Meta, while those favoring liquidity and growth potential might consider Twilio’s profile.
Which one offers the Superior Shareholder Reward?
I compare Meta Platforms, Inc. (META) and Twilio Inc. (TWLO) on their shareholder reward strategies. Meta pays a modest dividend yield of 0.34% with a low payout ratio around 8%, demonstrating strong free cash flow (21.3B) coverage and sustainable distributions. Meta also aggressively repurchases shares, enhancing total shareholder return. Twilio, by contrast, pays no dividends and suffers persistent net losses, reflecting a reinvestment focus on growth and R&D. Though TWLO maintains a healthy free cash flow (3.96B) relative to capex, its negative profitability and high valuation multiples (EV/EBITDA >130) raise sustainability concerns. I conclude Meta offers a superior total return profile in 2026, balancing steady dividends, robust buybacks, and durable free cash flow generation.
Comparative Score Analysis: The Strategic Profile
The radar chart reveals the fundamental DNA and trade-offs of Meta Platforms, Inc. and Twilio Inc., highlighting their financial strengths and vulnerabilities:
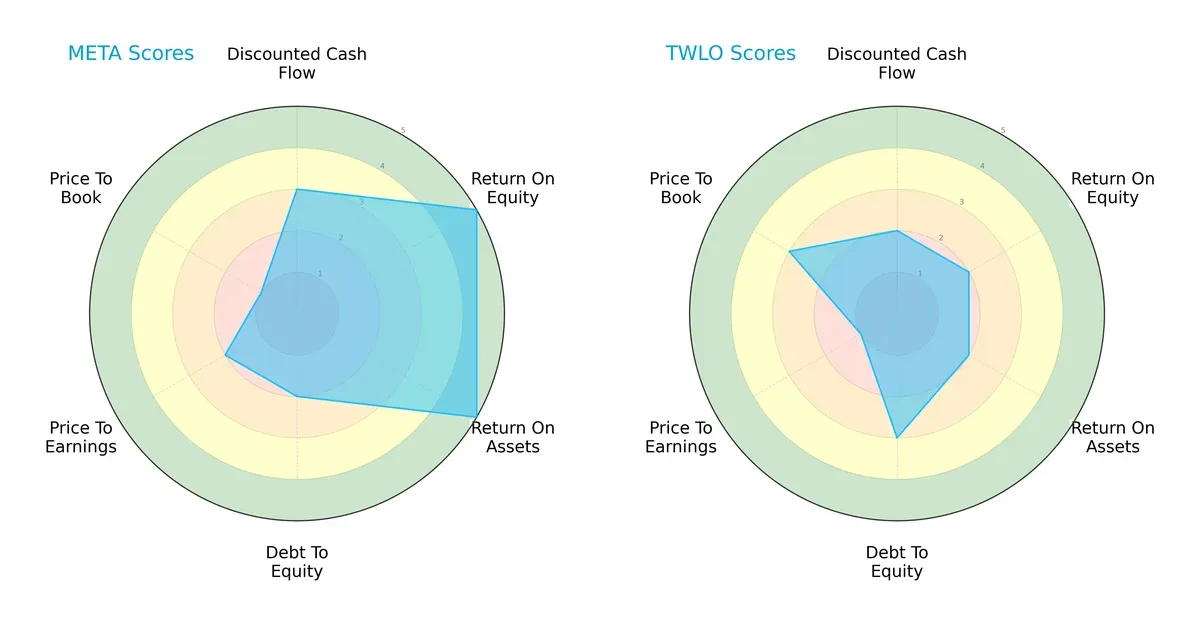
Meta shows superior efficiency with very favorable ROE and ROA scores, reflecting excellent asset and equity utilization. Twilio has a slightly stronger debt management score but lags significantly in profitability and valuation metrics. Meta’s profile is more balanced, leveraging operational strength despite moderate debt. Twilio relies more on capital structure advantages but struggles with earnings and valuation.
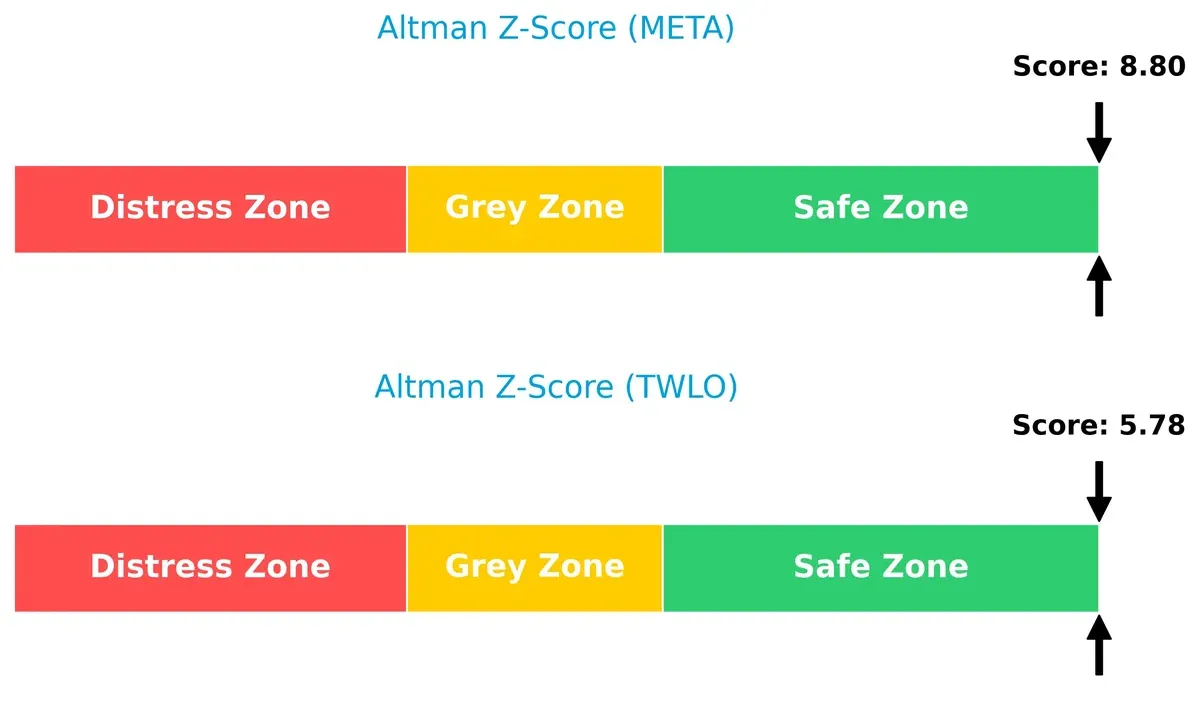
Bankruptcy Risk: Solvency Showdown
Meta’s Altman Z-Score of 8.8 versus Twilio’s 5.8 places both firms firmly in the safe zone, signaling strong long-term solvency. However, Meta’s higher score suggests greater resilience against economic downturns and financial stress:
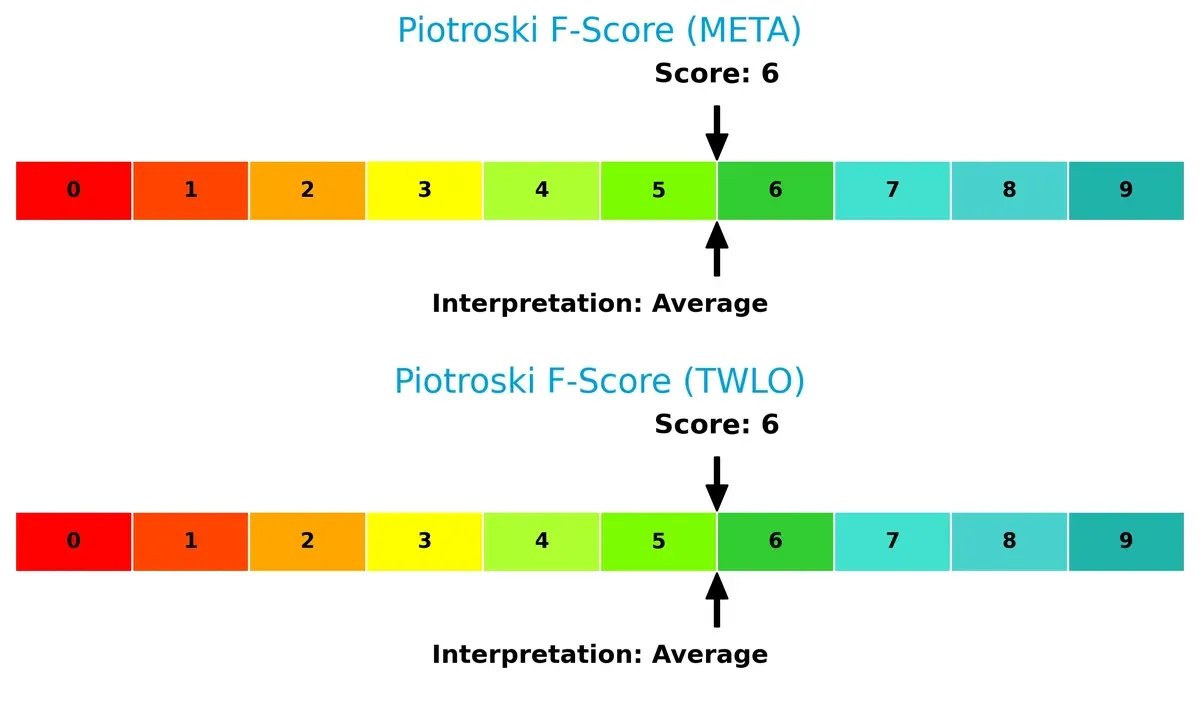
Financial Health: Quality of Operations
Both companies share an average Piotroski F-Score of 6, indicating moderate financial health. Neither exhibits red flags, but neither achieves peak operational quality, suggesting room for improvement in internal financial metrics:
How are the two companies positioned?
This section dissects the operational DNA of META and TWLO by comparing their revenue distribution and internal dynamics, including strengths and weaknesses. The goal is to confront their economic moats to identify which business model offers the most resilient and sustainable competitive advantage today.
Revenue Segmentation: The Strategic Mix
This visual comparison dissects how Meta Platforms, Inc. and Twilio Inc. diversify their income streams and reveals where their primary sector bets lie:
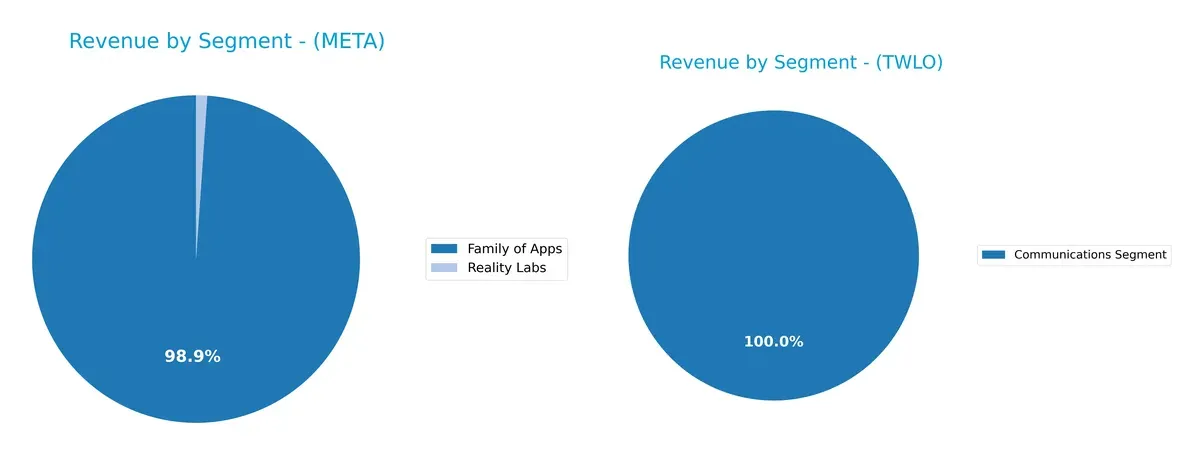
Meta Platforms anchors its revenue in the Family of Apps segment with $199B in 2025, dwarfing its Reality Labs at $2.2B. This concentration highlights a powerful ecosystem lock-in but presents some concentration risk. Twilio shows a more diversified profile with $4.16B in Communications Segment and smaller contributions from Other Communications, Software, and Services. Twilio pivots on infrastructure dominance, spreading risk across multiple communication technologies.
Strengths and Weaknesses Comparison
This table compares the Strengths and Weaknesses of Meta Platforms, Inc. and Twilio Inc.:
Meta Strengths
- High net margin and ROE indicate strong profitability
- Favorable leverage and liquidity ratios ensure financial stability
- Significant global revenue diversification with strong US & international presence
Twilio Strengths
- Low debt and debt-to-assets ratios reduce financial risk
- Favorable quick ratio supports short-term liquidity
- High fixed asset turnover shows efficient use of fixed assets
Meta Weaknesses
- High price-to-earnings and price-to-book ratios may indicate overvaluation
- Moderate asset turnover suggests room for operational efficiency improvement
- Low dividend yield may deter income-focused investors
Twilio Weaknesses
- Negative profitability ratios signal ongoing losses
- Interest coverage ratio at zero poses financial distress risk
- Unfavorable current ratio and asset turnover indicate liquidity and efficiency concerns
Meta excels in profitability and financial health, supported by broad global revenue streams. Twilio struggles with profitability but maintains operational efficiency in fixed assets and low leverage. Both companies face distinct challenges that could shape their strategic priorities.
The Moat Duel: Analyzing Competitive Defensibility
A structural moat alone shields long-term profits from relentless competitive erosion. Here’s how two tech giants stack up:
Meta Platforms, Inc.: Network Effects Powerhouse
Meta’s moat stems from massive network effects across Facebook, Instagram, and WhatsApp. This translates into high ROIC and stable 30%+ net margins. However, declining ROIC signals emerging competitive challenges in 2026.
Twilio Inc.: Rapid Innovation with Switching Costs
Twilio’s competitive edge lies in its API platform’s switching costs, locking in developers. Despite negative ROIC vs. WACC, its accelerating ROIC trend reflects improving profitability and growth potential in new communication services.
Meta’s Network Effects vs. Twilio’s Developer Lock-in
Meta commands a wider moat with entrenched network effects and consistent value creation. Twilio’s moat is narrower but deepening as its ROIC improves. Meta remains better equipped to defend its market share over the long term.
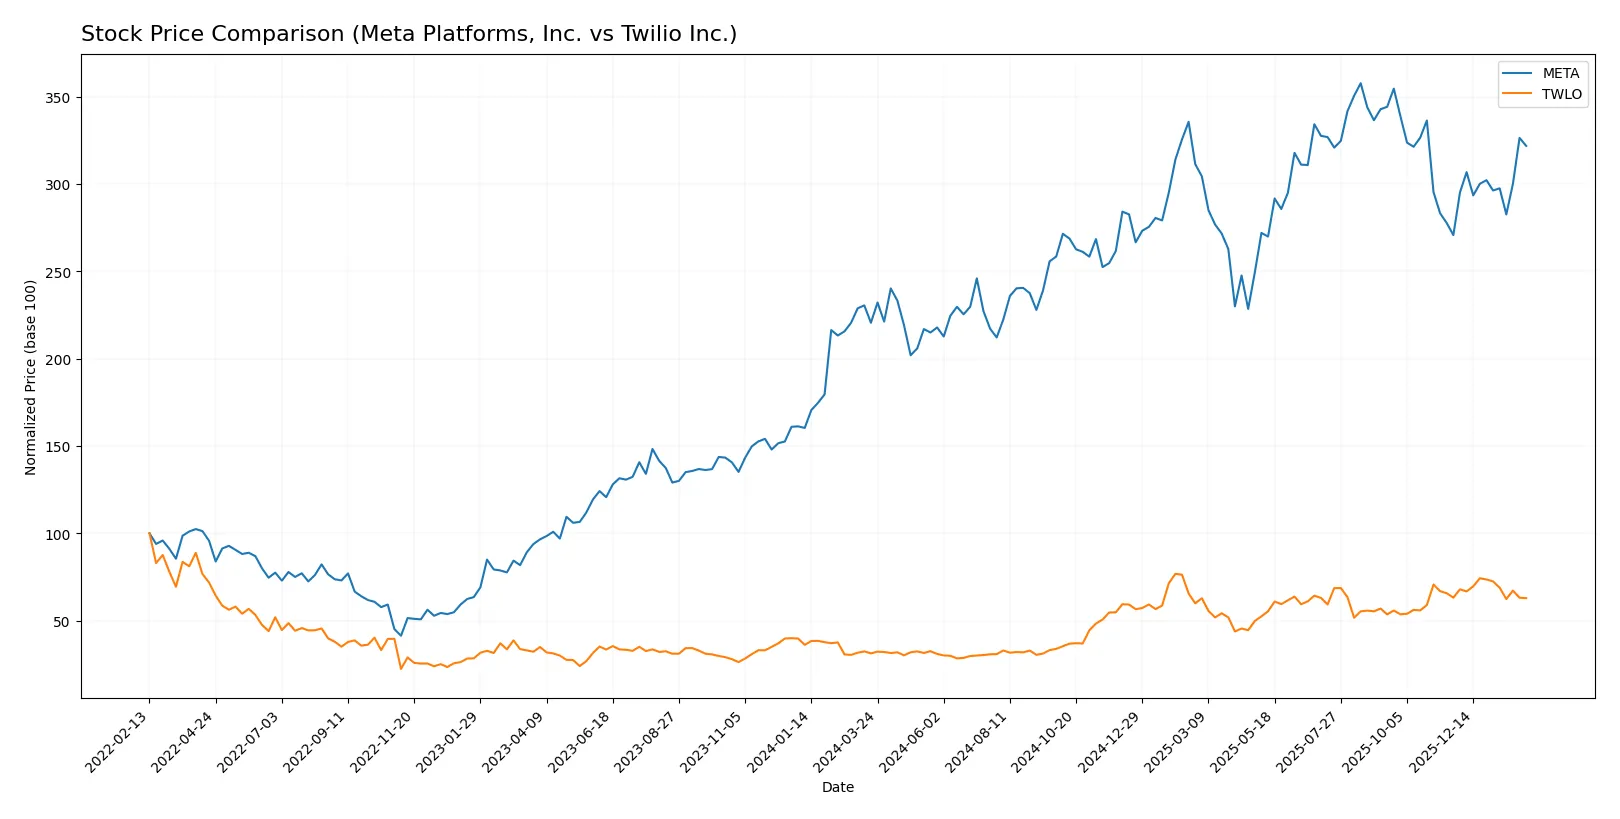
Which stock offers better returns?
Meta Platforms, Inc. and Twilio Inc. have shown starkly different price trajectories over the past year, with Meta accelerating gains and Twilio slowing down after a strong overall rise.
Trend Comparison
Meta Platforms, Inc. posted a 45.92% price increase over the past year, marking a bullish trend with accelerating momentum and a high volatility level of 91.25. The stock reached a peak of 785.23 and a low of 443.29.
Twilio Inc. more than doubled its price with a 101.14% gain over the same period, indicating a bullish trend but with decelerating momentum. Volatility was moderate at 27.9, with prices ranging from 54.24 to 146.58.
Comparing both stocks, Twilio delivered the highest market performance despite recent deceleration, while Meta showed a steadier acceleration with stronger recent buyer dominance.
Target Prices
Analysts present a clear target price consensus for Meta Platforms and Twilio, reflecting measured optimism.
| Company | Target Low | Target High | Consensus |
|---|---|---|---|
| Meta Platforms, Inc. | 700 | 1117 | 853 |
| Twilio Inc. | 100 | 170 | 147.27 |
Meta’s consensus target of 853 sits about 20% above its current 706 price, signaling upside potential. Twilio’s 147 consensus exceeds its present 120 price by roughly 22%, suggesting growth expectations.

Don’t Let Luck Decide Your Entry Point
Optimize your entry points with our advanced ProRealTime indicators. You’ll get efficient buy signals with precise price targets for maximum performance. Start outperforming now!
How do institutions grade them?
Meta Platforms, Inc. Grades
Here are recent grades from leading financial institutions for Meta Platforms, Inc.:
| Grading Company | Action | New Grade | Date |
|---|---|---|---|
| Cantor Fitzgerald | maintain | Overweight | 2024-09-30 |
| Monness, Crespi, Hardt | maintain | Buy | 2024-09-30 |
| Baird | maintain | Outperform | 2024-09-26 |
| JMP Securities | maintain | Market Outperform | 2024-09-26 |
| B of A Securities | maintain | Buy | 2024-09-26 |
| Rosenblatt | maintain | Buy | 2024-09-26 |
| Wedbush | maintain | Outperform | 2024-09-26 |
| JP Morgan | maintain | Overweight | 2024-09-26 |
| Cantor Fitzgerald | maintain | Overweight | 2024-09-23 |
| Citigroup | maintain | Buy | 2024-09-23 |
Twilio Inc. Grades
Below are recent grades from reputable firms for Twilio Inc.:
| Grading Company | Action | New Grade | Date |
|---|---|---|---|
| Morgan Stanley | maintain | Overweight | 2026-01-15 |
| Rosenblatt | maintain | Buy | 2026-01-07 |
| Piper Sandler | downgrade | Neutral | 2026-01-05 |
| RBC Capital | maintain | Underperform | 2026-01-05 |
| Citizens | maintain | Market Outperform | 2025-12-30 |
| Keybanc | maintain | Overweight | 2025-10-31 |
| Piper Sandler | maintain | Overweight | 2025-10-31 |
| B of A Securities | maintain | Underperform | 2025-10-31 |
| Mizuho | maintain | Outperform | 2025-10-31 |
| TD Cowen | maintain | Hold | 2025-10-31 |
Which company has the best grades?
Meta Platforms, Inc. consistently receives buy and outperform ratings from multiple top-tier firms. Twilio Inc. shows a mix of overweight and underperform grades with some downgrades. Meta’s stronger consensus grades suggest more bullish institutional sentiment.
Risks specific to each company
In the evolving 2026 market, these categories reveal critical pressure points and systemic threats confronting both Meta Platforms, Inc. and Twilio Inc.:
1. Market & Competition
Meta Platforms, Inc.
- Dominates with strong network effects but faces regulatory scrutiny and innovation pressure.
Twilio Inc.
- Faces intense competition in cloud communications and must scale rapidly to maintain market share.
2. Capital Structure & Debt
Meta Platforms, Inc.
- Maintains a conservative debt-to-equity ratio (0.39) with strong interest coverage.
Twilio Inc.
- Low leverage (debt-to-equity 0.14) but zero interest coverage signals potential liquidity risk.
3. Stock Volatility
Meta Platforms, Inc.
- Beta of 1.28 shows moderate sensitivity to market swings typical for tech giants.
Twilio Inc.
- Beta of 1.31 indicates slightly higher volatility, reflecting growth-stage risk.
4. Regulatory & Legal
Meta Platforms, Inc.
- Faces significant regulatory risks tied to privacy and content moderation globally.
Twilio Inc.
- Regulatory risks exist but less pronounced; data security compliance is critical.
5. Supply Chain & Operations
Meta Platforms, Inc.
- Complex global operations with exposure to hardware supply chain challenges for Reality Labs.
Twilio Inc.
- Dependence on cloud infrastructure and developer ecosystem poses operational scaling risks.
6. ESG & Climate Transition
Meta Platforms, Inc.
- Increasing pressure to reduce carbon footprint and enhance social governance transparency.
Twilio Inc.
- Emerging ESG initiatives but less public scrutiny; climate risk mainly indirect via cloud providers.
7. Geopolitical Exposure
Meta Platforms, Inc.
- Substantial exposure to U.S.-China tensions and global data sovereignty laws.
Twilio Inc.
- Moderate geopolitical risks focused on international data regulations and trade policies.
Which company shows a better risk-adjusted profile?
Meta’s robust profitability and conservative debt levels provide a safer financial base despite regulatory and geopolitical headwinds. Twilio’s negative margins, zero interest coverage, and higher operational risks undermine its risk profile. Meta’s Altman Z-Score of 8.8 confirms strong financial stability versus Twilio’s 5.8, though both remain in the safe zone. Meta’s dominant market position and better capital structure tip the scales in its favor.
Meta’s most impactful risk is regulatory and geopolitical pressure. Twilio’s biggest concern is its fragile capital structure and negative profitability. The recent data highlight Meta’s superior financial resilience despite external pressures. Investors seeking risk-adjusted stability should favor Meta Platforms, Inc.
Final Verdict: Which stock to choose?
Meta Platforms, Inc. wields unmatched efficiency in capital allocation, consistently generating returns well above its cost of capital. Its strong cash flow and robust balance sheet underpin this strength. The main point of vigilance remains its lofty valuation multiples, which might challenge near-term upside. Meta suits investors targeting aggressive growth with a tolerance for premium pricing.
Twilio Inc. boasts a strategic moat rooted in its communications platform’s recurring revenue and rapid revenue growth. While its value creation is currently negative, improving profitability signals potential. Compared to Meta, Twilio offers a safer balance sheet but faces operational challenges and high volatility. It fits portfolios seeking growth at a reasonable price (GARP) with a longer-term horizon.
If you prioritize consistent value creation and operational efficiency, Meta outshines due to its proven track record and scale. However, if you seek a growth story with improving profitability and are comfortable with elevated risk, Twilio offers better upside potential. Both profiles entail risks that warrant careful monitoring.
Disclaimer: Investment carries a risk of loss of initial capital. The past performance is not a reliable indicator of future results. Be sure to understand risks before making an investment decision.
Go Further
I encourage you to read the complete analyses of Meta Platforms, Inc. and Twilio Inc. to enhance your investment decisions: