Home > Comparison > Technology > META vs SNAP
The strategic rivalry between Meta Platforms, Inc. and Snap Inc. shapes the future of digital communication and content delivery. Meta operates as a sprawling technology conglomerate with diversified platforms and immersive reality ventures. Snap, by contrast, focuses on innovative, camera-centric social applications within communication services. This analysis evaluates their contrasting growth dynamics and operational models to determine which offers superior risk-adjusted returns for a diversified portfolio in today’s evolving tech landscape.

Table of contents
Companies Overview
Meta Platforms and Snap Inc. both shape the future of digital communication and content sharing globally.
Meta Platforms, Inc.: Social Media and Virtual Connection Leader
Meta dominates as a global social networking giant. Its core revenue comes from advertising across Facebook, Instagram, Messenger, and WhatsApp. In 2026, Meta focuses strategically on expanding its Reality Labs segment, investing heavily in augmented and virtual reality to enhance immersive social experiences.
Snap Inc.: Visual Communication Innovator
Snap Inc. operates primarily as a camera and social media company. It generates revenue through advertising on Snapchat and sales of Spectacles eyewear. The company’s 2026 strategy emphasizes augmented reality ads and short-form video content to deepen user engagement and expand its advertising footprint.
Strategic Collision: Similarities & Divergences
Both companies monetize through advertising-driven social platforms, but Meta embraces a broad ecosystem including virtual reality hardware, while Snap focuses on visual communication and AR ads. Their primary battleground lies in capturing younger demographics’ attention with innovative formats. Meta appeals with scale and immersive tech; Snap offers nimbleness and niche AR appeal, creating distinct investment profiles.
Income Statement Comparison
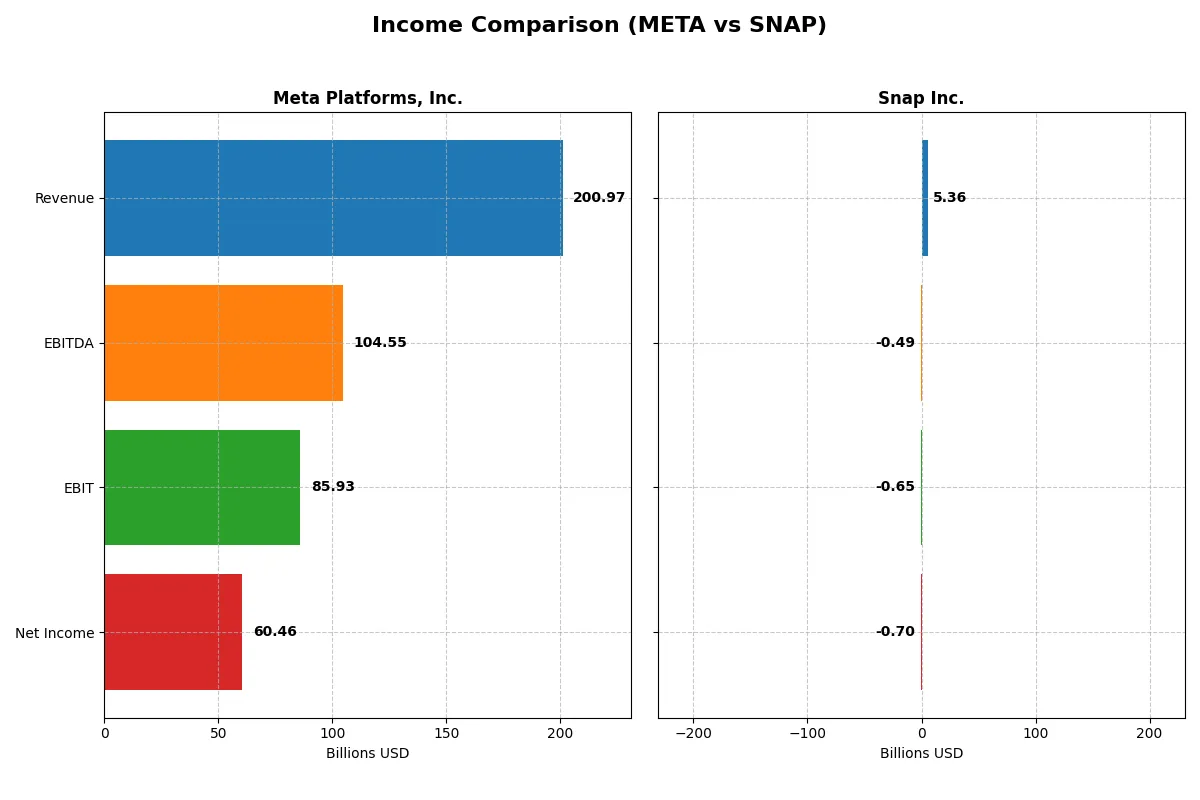
This table dissects the core profitability and scalability of both corporate engines to reveal who dominates the bottom line:
| Metric | Meta Platforms, Inc. (META) | Snap Inc. (SNAP) |
|---|---|---|
| Revenue | 201B | 5.36B |
| Cost of Revenue | 36.2B | 2.47B |
| Operating Expenses | 81.5B | 3.67B |
| Gross Profit | 165B | 2.89B |
| EBITDA | 104.5B | -493M |
| EBIT | 85.9B | -651M |
| Interest Expense | 0 | 21.6M |
| Net Income | 60.5B | -698M |
| EPS | 23.98 | -0.42 |
| Fiscal Year | 2025 | 2024 |
Income Statement Analysis: The Bottom-Line Duel
This income statement comparison reveals the true efficiency and profitability of Meta Platforms, Inc. and Snap Inc. over recent years.
Meta Platforms, Inc. Analysis
Meta’s revenue surged from 117.9B in 2021 to 201B in 2025, showing robust growth. Net income climbed from 39.4B to 60.5B, despite a slight dip in net margin to 30.1%. Its gross margin remained strong at 82%, and EBIT margin held at 42.8%, highlighting efficient cost control and operational momentum in 2025.
Snap Inc. Analysis
Snap expanded revenues from 2.5B in 2020 to 5.4B in 2024, doubling its top line. However, it still posted net losses, though shrinking from -945M to -698M. Gross margin improved to 53.9%, but EBIT margin stayed negative at -12.1%. The company gained momentum in 2024 with a 16.4% revenue increase and narrowing losses, signaling operational improvement.
Margin Power vs. Revenue Scale
Meta dominates with higher absolute profits and superior margins, boasting a 30.1% net margin versus Snap’s -13.0%. Snap shows impressive revenue growth and margin improvement but remains unprofitable. Investors seeking solid profitability will lean toward Meta, while those favoring growth potential might consider Snap’s improving trajectory.
Financial Ratios Comparison
These vital ratios act as a diagnostic tool to expose the underlying fiscal health, valuation premiums, and capital efficiency of the companies compared below:
| Ratios | Meta Platforms, Inc. (META) | Snap Inc. (SNAP) |
|---|---|---|
| ROE | 27.8% (2025) | -28.5% (2024) |
| ROIC | 17.9% (2025) | -11.7% (2024) |
| P/E | 27.5 (2025) | -25.6 (2024) |
| P/B | 7.66 (2025) | 7.29 (2024) |
| Current Ratio | 2.60 (2025) | 3.95 (2024) |
| Quick Ratio | 2.60 (2025) | 3.95 (2024) |
| D/E | 0.39 (2025) | 1.73 (2024) |
| Debt-to-Assets | 22.9% (2025) | 53.5% (2024) |
| Interest Coverage | N/A | N/A |
| Asset Turnover | 0.55 (2025) | 0.68 (2024) |
| Fixed Asset Turnover | 1.02 (2025) | 5.26 (2024) |
| Payout Ratio | 8.8% (2025) | 0% (2024) |
| Dividend Yield | 0.32% (2025) | 0% (2024) |
| Fiscal Year | 2025 | 2024 |
Efficiency & Valuation Duel: The Vital Signs
Financial ratios serve as a company’s DNA, exposing hidden risks and operational strength essential for investor insight.
Meta Platforms, Inc.
Meta delivers robust profitability with a 27.8% ROE and a strong 30.1% net margin, signaling operational excellence. However, its P/E of 27.5 and P/B of 7.7 mark the stock as relatively expensive. Meta maintains shareholder value through modest dividends (0.32% yield) alongside heavy reinvestment in R&D, fueling growth and innovation.
Snap Inc.
Snap struggles with negative returns: a -28.5% ROE and -13.0% net margin confirm ongoing profitability challenges. The P/E ratio is negative, reflecting losses, while a P/B of 7.3 indicates a stretched valuation relative to book value. Snap offers no dividends, instead prioritizing aggressive R&D spending to drive future growth amid operational headwinds.
Premium Valuation vs. Operational Safety
Meta offers superior profitability and operational safety despite a premium valuation, balancing risk and reward more effectively. Snap’s weak returns and high leverage increase risk, fitting investors with tolerance for turnaround plays rather than stable income or growth profiles.
Which one offers the Superior Shareholder Reward?
Meta Platforms, Inc. (META) delivers a more attractive shareholder reward than Snap Inc. (SNAP) in 2026. META pays a modest but sustainable dividend yield of 0.34%, backed by a low payout ratio near 8% and strong free cash flow coverage above 59%. It also executes robust buybacks, enhancing total returns. In contrast, SNAP pays no dividends and struggles with negative profit margins and weak operating cash flow ratios. Its buybacks are limited by high leverage and cash constraints. META’s balanced distribution—dividends plus aggressive buybacks—supports long-term value better. I conclude META offers superior total return potential and a more durable shareholder reward model in the current market cycle.
Comparative Score Analysis: The Strategic Profile
The radar chart reveals the fundamental DNA and trade-offs of Meta Platforms, Inc. and Snap Inc., highlighting their core financial strengths and vulnerabilities:
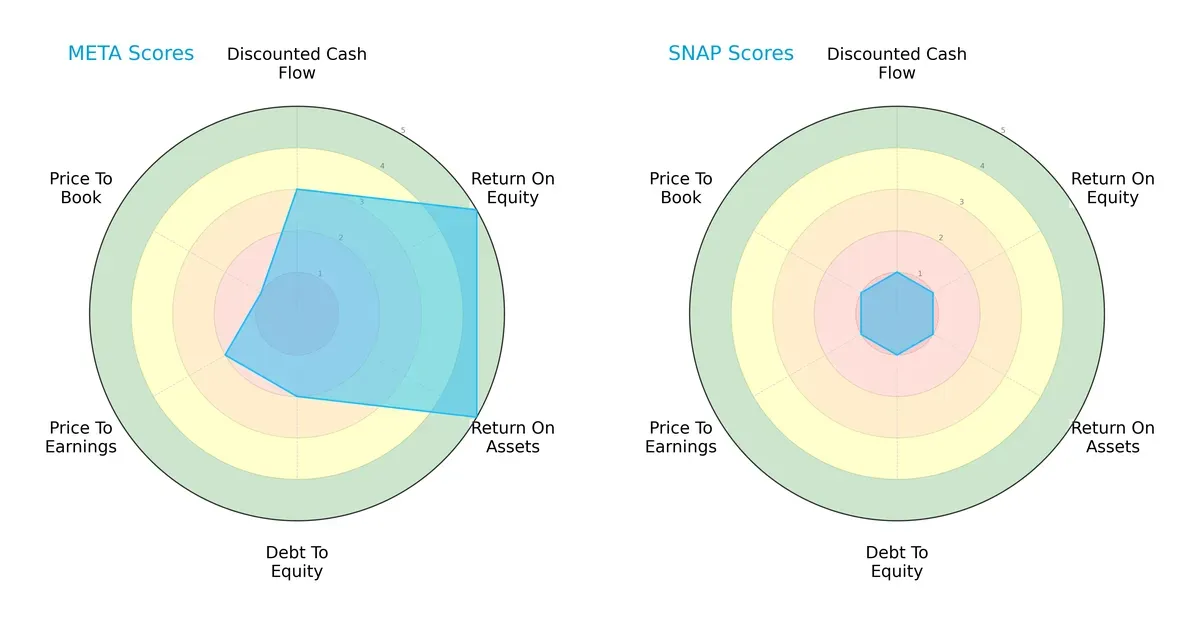
Meta dominates with superior ROE and ROA scores, signaling efficient profit generation and asset use. Snap lags significantly across all metrics, including DCF and leverage ratios. Meta’s profile is more balanced, while Snap relies heavily on a weak financial foundation, exposing it to higher risk.
Bankruptcy Risk: Solvency Showdown
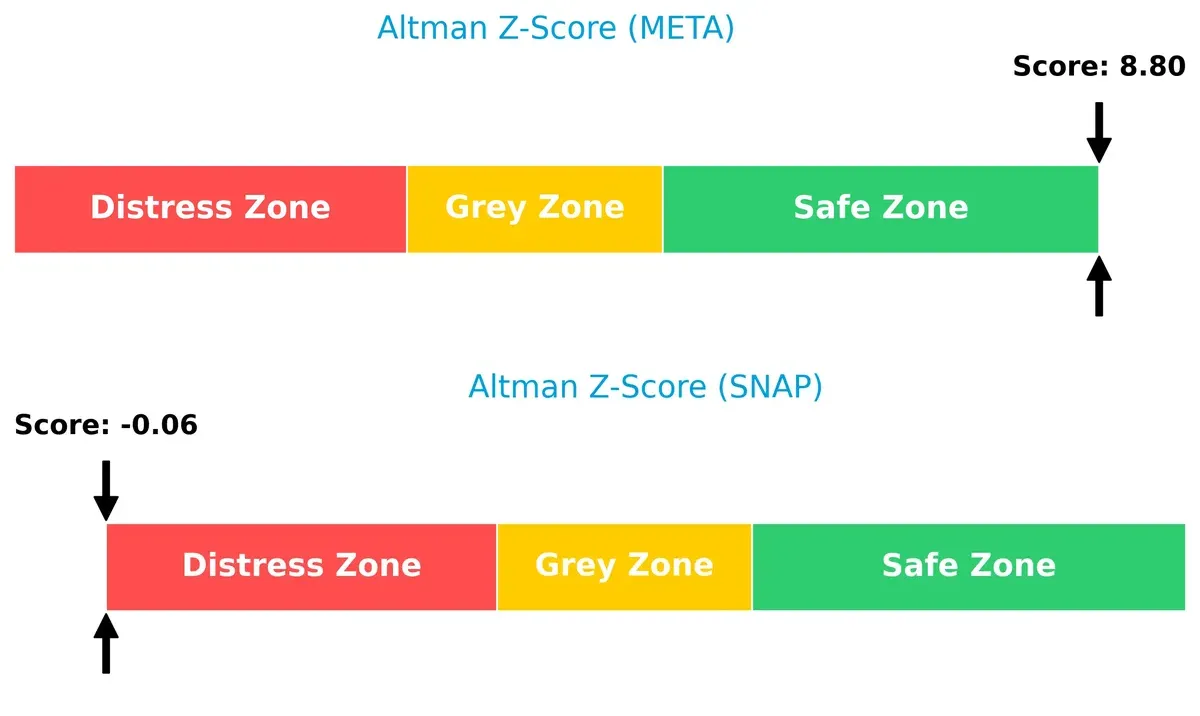
Meta’s Altman Z-Score of 8.8 places it firmly in the safe zone, indicating robust long-term survival prospects. Snap’s score below zero signals severe distress and elevated bankruptcy risk in this cycle:
Financial Health: Quality of Operations
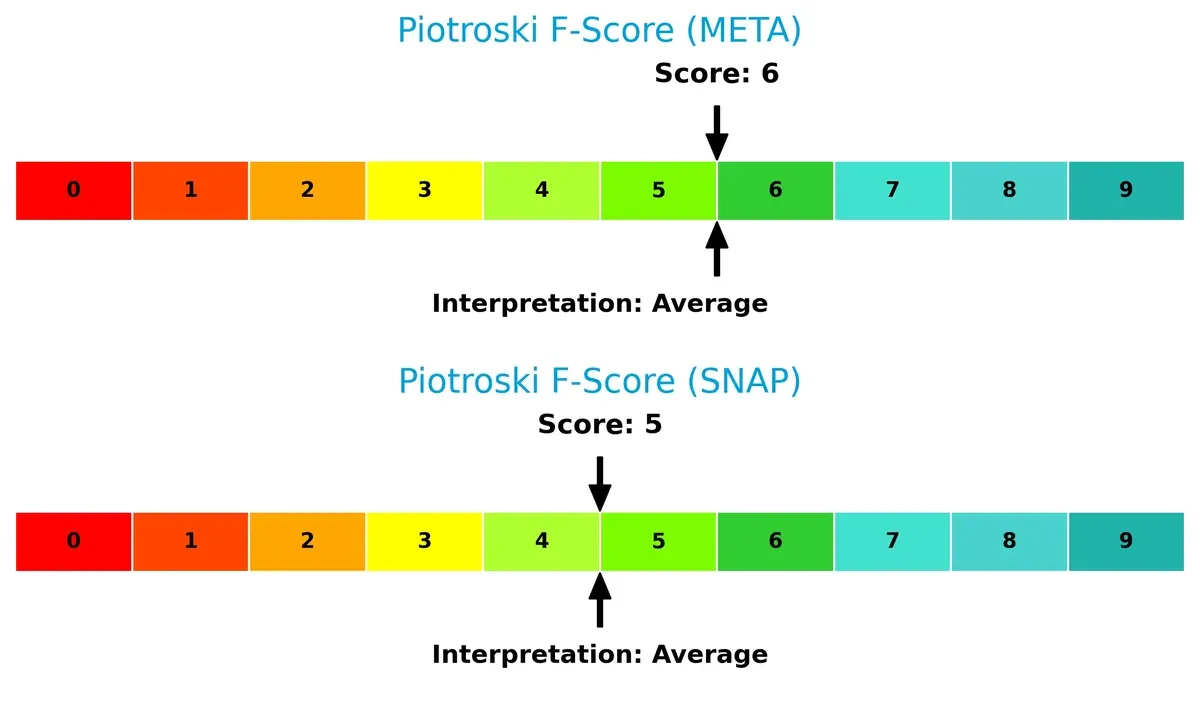
Meta and Snap have average Piotroski scores (6 and 5 respectively), reflecting moderate operational quality. Neither shows peak financial health, but Meta’s slight edge suggests better internal metrics and fewer red flags:
How are the two companies positioned?
This section dissects the operational DNA of Meta and Snap by comparing their revenue distribution and internal strengths and weaknesses. The goal is to confront their economic moats to reveal which model offers the most durable competitive advantage today.
Revenue Segmentation: The Strategic Mix
This visual comparison dissects how Meta Platforms, Inc. and Snap Inc. diversify their income streams and where their primary sector bets lie:
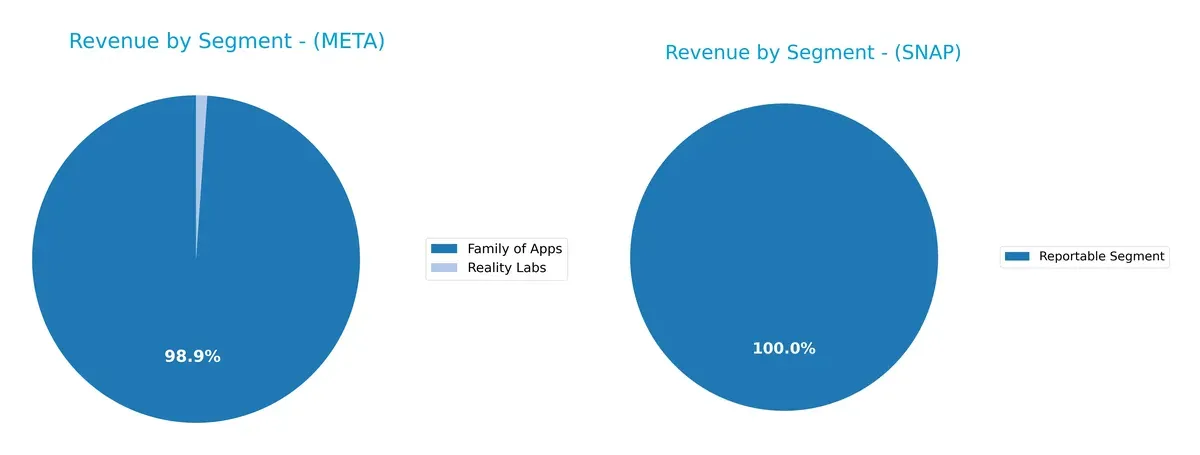
Meta Platforms dwarfs Snap with $199B from its Family of Apps in 2025, while Snap reports a single $5.36B segment. Meta’s revenue anchors on a dominant advertising ecosystem, showing infrastructure strength but concentration risk. Snap’s lack of segmentation data limits insight, but its smaller scale suggests less diversification. Meta’s strategic bet on a vast app family secures ecosystem lock-in; Snap’s narrower footprint signals dependency on a single revenue driver.
Strengths and Weaknesses Comparison
This table compares the strengths and weaknesses of Meta Platforms, Inc. and Snap Inc. based on key financial and strategic metrics:
Meta Strengths
- High net margin at 30.08%
- Strong ROE of 27.83%
- ROIC of 17.95% well above WACC
- Solid global presence with $79B revenue in US & Canada
- Diversified revenue streams including Family of Apps and Reality Labs
- Favorable debt ratios and liquidity with current ratio 2.6
Snap Strengths
- Favorable WACC at 6.55%
- Positive fixed asset turnover of 5.26 indicating efficient asset use
- Quick ratio 3.95 supports short-term liquidity
- Revenue diversification across North America, Europe, and Rest of World
- Presence in growing social media segment
Meta Weaknesses
- Unfavorable valuation metrics, high PE of 27.52 and PB of 7.66
- Dividend yield is low at 0.32%
- Neutral asset turnover ratios suggest moderate operational efficiency
- Heavy reliance on Family of Apps segment may limit diversification
- Innovation segment Reality Labs is a smaller revenue contributor
Snap Weaknesses
- Negative profitability with net margin -13.02% and ROE -28.48%
- High debt levels with debt/equity 1.73 and debt to assets 53.47%
- Negative interest coverage ratio at -30.19 signals financial distress
- Unfavorable current ratio despite strong quick ratio
- Unfavorable PB at 7.29 and zero dividend yield
Meta demonstrates robust profitability and global scale but faces valuation and concentration risks. Snap struggles with profitability and leverage issues despite operational efficiencies. These factors shape their strategic priorities in balancing growth, innovation, and financial stability.
The Moat Duel: Analyzing Competitive Defensibility
A structural moat shields long-term profits from relentless competition erosion. Its depth and durability determine market dominance:
Meta Platforms, Inc.: Network Effects Powerhouse
Meta’s moat rests on powerful network effects linking billions across Facebook, Instagram, and WhatsApp. This manifests in robust ROIC exceeding WACC by 8.4%, sustaining 82% gross margins. Despite a declining ROIC trend, new Reality Labs products may deepen its ecosystem in 2026.
Snap Inc.: Innovation-Driven Engagement
Snap leverages innovative camera technology and AR ads to build user engagement, contrasting Meta’s scale moat. Its ROIC lags WACC by 18%, signaling value destruction, yet improving profitability hints at emerging strength. Expansion in AR and global markets could boost its competitive position.
Network Effects vs. Innovation Edge: Who Defends Better?
Meta holds a wider moat with consistent value creation via entrenched network effects. Snap’s rising ROIC trend shows promise but remains less defensible. Meta is better poised to defend and extend its market share in 2026.
Which stock offers better returns?
Meta Platforms, Inc. shows a strong upward price movement over the past year, while Snap Inc. experiences a significant decline, reflecting contrasting trading dynamics between these tech peers.
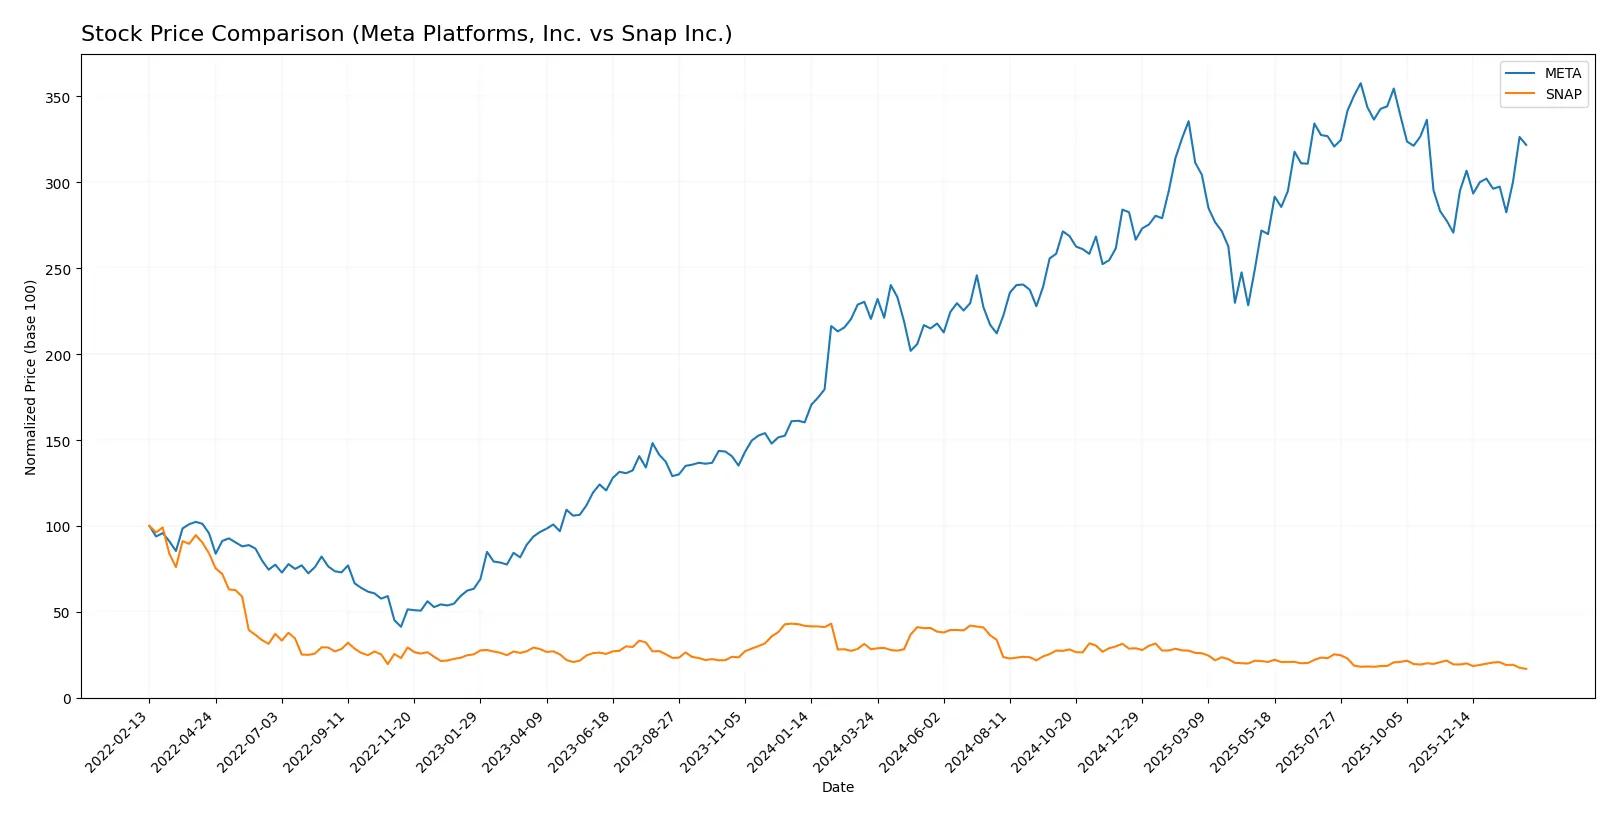
Trend Comparison
Meta Platforms, Inc. posts a 45.92% price increase over the past 12 months, indicating a bullish trend with accelerating momentum and a high volatility level at 91.25. The stock hit a high of 785.23 and a low of 443.29, confirming its upward trajectory.
Snap Inc. suffers a 40.48% drop over the same period, defining a bearish trend with accelerating downward pressure. Its price volatility remains low at 2.61, with a high of 16.61 and a low of 6.66, underscoring sustained weakness.
Meta’s bullish trend and substantial price gains outperform Snap’s bearish decline, making Meta the stronger market performer in this comparison.
Target Prices
Analysts present a mixed but generally optimistic target consensus for Meta Platforms and Snap Inc.
| Company | Target Low | Target High | Consensus |
|---|---|---|---|
| Meta Platforms, Inc. | 700 | 1117 | 853 |
| Snap Inc. | 7 | 10 | 8.72 |
Meta’s target consensus at 853 suggests upside from the current 706.41 price, indicating confidence in growth despite recent volatility. Snap’s consensus near 8.72 also implies modest upside versus its 6.67 price, reflecting cautious optimism among analysts.

Don’t Let Luck Decide Your Entry Point
Optimize your entry points with our advanced ProRealTime indicators. You’ll get efficient buy signals with precise price targets for maximum performance. Start outperforming now!
How do institutions grade them?
The following summarizes the latest institutional grades for Meta Platforms, Inc. and Snap Inc.:
Meta Platforms, Inc. Grades
This table shows recent grades from major financial institutions covering Meta Platforms, Inc.:
| Grading Company | Action | New Grade | Date |
|---|---|---|---|
| Cantor Fitzgerald | Maintain | Overweight | 2024-09-30 |
| Monness, Crespi, Hardt | Maintain | Buy | 2024-09-30 |
| Baird | Maintain | Outperform | 2024-09-26 |
| JMP Securities | Maintain | Market Outperform | 2024-09-26 |
| B of A Securities | Maintain | Buy | 2024-09-26 |
| Rosenblatt | Maintain | Buy | 2024-09-26 |
| Wedbush | Maintain | Outperform | 2024-09-26 |
| JP Morgan | Maintain | Overweight | 2024-09-26 |
| Cantor Fitzgerald | Maintain | Overweight | 2024-09-23 |
| Citigroup | Maintain | Buy | 2024-09-23 |
Snap Inc. Grades
Here are the most recent institutional grades for Snap Inc.:
| Grading Company | Action | New Grade | Date |
|---|---|---|---|
| Roth Capital | Maintain | Neutral | 2026-01-30 |
| UBS | Maintain | Neutral | 2026-01-20 |
| Morgan Stanley | Maintain | Equal Weight | 2026-01-13 |
| Goldman Sachs | Maintain | Neutral | 2026-01-13 |
| Guggenheim | Maintain | Neutral | 2025-12-19 |
| Citigroup | Maintain | Neutral | 2025-11-12 |
| Truist Securities | Maintain | Hold | 2025-11-07 |
| Cantor Fitzgerald | Maintain | Neutral | 2025-11-06 |
| BMO Capital | Maintain | Outperform | 2025-11-06 |
| Rosenblatt | Maintain | Neutral | 2025-11-06 |
Which company has the best grades?
Meta consistently receives Buy, Outperform, and Overweight ratings from top firms, indicating strong institutional confidence. Snap’s grades mostly range from Neutral to Hold, with fewer bullish calls. Investors may view Meta as having a more favorable analyst outlook.
Risks specific to each company
The following categories identify the critical pressure points and systemic threats facing both firms in the 2026 market environment:
1. Market & Competition
Meta Platforms, Inc.
- Dominates with vast user base and diversified platforms but faces intense competition from new social media entrants.
Snap Inc.
- Faces fierce competition from larger platforms and struggles to expand user base beyond niche segments.
2. Capital Structure & Debt
Meta Platforms, Inc.
- Maintains conservative debt-to-equity ratio at 0.39, signaling solid financial stability.
Snap Inc.
- High debt-to-equity at 1.73 raises risk; poor interest coverage indicates costly borrowing.
3. Stock Volatility
Meta Platforms, Inc.
- Beta of 1.28 shows moderate volatility typical for tech giants with market leadership.
Snap Inc.
- Lower beta of 0.80 suggests less sensitivity to market swings but vulnerable due to smaller size.
4. Regulatory & Legal
Meta Platforms, Inc.
- Faces ongoing scrutiny over data privacy and antitrust issues, a persistent regulatory risk.
Snap Inc.
- Also subject to regulatory challenges but less exposed given smaller scale and scope.
5. Supply Chain & Operations
Meta Platforms, Inc.
- Robust operations with diversified digital infrastructure; supply chain risks minimal.
Snap Inc.
- Smaller scale limits operational resilience; reliance on hardware (Spectacles) exposes to supply chain disruptions.
6. ESG & Climate Transition
Meta Platforms, Inc.
- Increasing pressure to meet ambitious ESG targets; significant energy use in data centers is a concern.
Snap Inc.
- Early-stage ESG efforts; lower footprint but lacks scale to leverage climate transition opportunities fully.
7. Geopolitical Exposure
Meta Platforms, Inc.
- Global presence exposes it to geopolitical tensions, especially in China and Europe.
Snap Inc.
- More concentrated market primarily in North America; lower geopolitical risk but limited growth avenues.
Which company shows a better risk-adjusted profile?
Meta’s dominant market position and strong balance sheet provide a robust risk-adjusted profile despite regulatory pressures. Snap’s high leverage and negative profitability amplify its risks, limiting its investment appeal. Meta’s Altman Z-score of 8.8 confirms financial safety, while Snap’s distress zone score signals vulnerability. These metrics underscore Meta’s superior stability in 2026.
Final Verdict: Which stock to choose?
Meta Platforms, Inc. leverages unmatched cash flow generation and a robust economic moat, driven by high returns on invested capital well above its cost of capital. Its main point of vigilance lies in a slightly declining profitability trend, which could challenge margins. Meta suits portfolios targeting aggressive growth with a tolerance for cyclic shifts.
Snap Inc. offers a strategic moat rooted in rapid user growth and innovation, reflected in its improving return on invested capital trajectory. Despite current losses and weaker financial stability compared to Meta, Snap’s growth momentum presents a compelling case for investors favoring growth at a reasonable price, albeit with higher risk tolerance.
If you prioritize durable profitability and solid cash generation, Meta outshines as the compelling choice due to its efficient capital use and stable financial footing. However, if you seek high-growth potential with an appetite for volatility, Snap offers superior upside through accelerating profitability and innovation-driven expansion. Each fits distinct investor profiles, emphasizing the importance of aligning choice with risk appetite and strategy.
Disclaimer: Investment carries a risk of loss of initial capital. The past performance is not a reliable indicator of future results. Be sure to understand risks before making an investment decision.
Go Further
I encourage you to read the complete analyses of Meta Platforms, Inc. and Snap Inc. to enhance your investment decisions: