Investors seeking innovative players in the technology hardware sector often consider Trimble Inc. and Mesa Laboratories, Inc. Both companies operate in hardware and equipment but serve distinct niches—Trimble focuses on advanced positioning and construction solutions, while Mesa specializes in life sciences tools and quality control products. This comparison explores their market strategies and growth potential to help you decide which company might be a smarter addition to your investment portfolio.
Table of contents
Companies Overview
I will begin the comparison between Trimble Inc. and Mesa Laboratories, Inc. by providing an overview of these two companies and their main differences.
Trimble Inc. Overview
Trimble Inc. delivers technology solutions that help professionals and mobile workers improve their work processes globally. It operates across several segments including Buildings and Infrastructure, Geospatial, Resources and Utilities, and Transportation, offering software and systems for construction, surveying, precision agriculture, and fleet management. Founded in 1978 and headquartered in California, Trimble is a major player in the hardware and equipment industry with a market cap of approximately 19B USD.
Mesa Laboratories, Inc. Overview
Mesa Laboratories, Inc. develops and sells life sciences tools and quality control products primarily for healthcare and biopharmaceutical sectors. Its segments include Sterilization and Disinfection Control, Biopharmaceutical Development, Calibration Solutions, and Clinical Genomics, providing instruments and systems for sterilization testing, protein analysis, calibration, and genetic testing. Founded in 1982 and based in Colorado, Mesa Labs is a smaller company with a market cap around 473M USD.
Key similarities and differences
Both companies operate in the hardware, equipment, and parts industry but serve distinct markets: Trimble focuses on technology solutions for construction, agriculture, and transportation, while Mesa Labs specializes in life sciences and healthcare quality control. Trimble is significantly larger with broader global reach and diversified segments, whereas Mesa Labs concentrates on specialized scientific instruments and services with a smaller workforce and market capitalization.
Income Statement Comparison
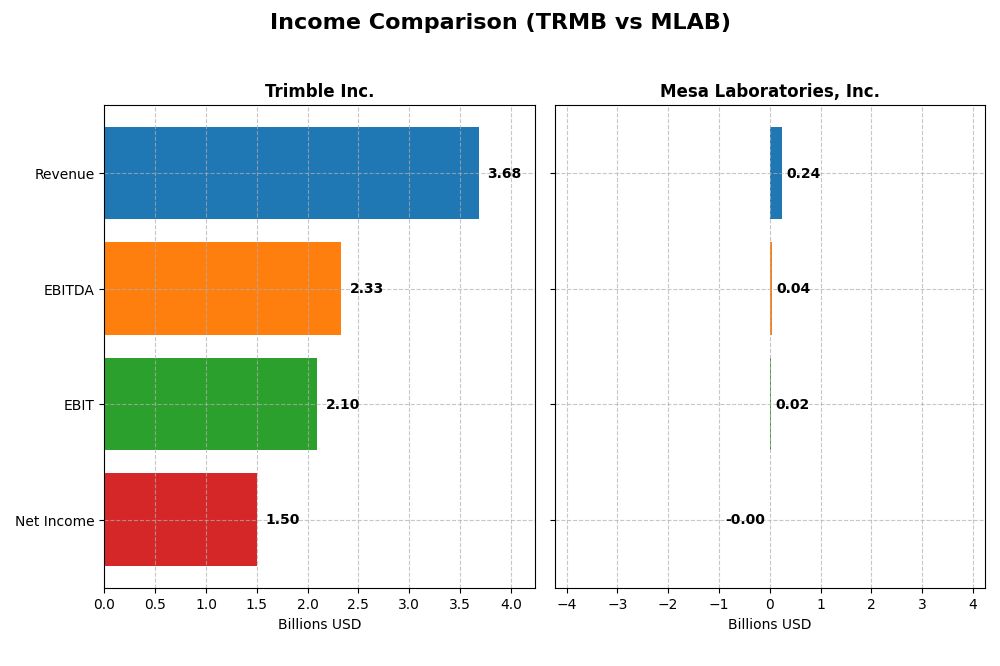
The table below compares the latest available income statement metrics for Trimble Inc. and Mesa Laboratories, Inc., highlighting key financial figures for the most recent fiscal year.
| Metric | Trimble Inc. (TRMB) | Mesa Laboratories, Inc. (MLAB) |
|---|---|---|
| Market Cap | 18.97B | 473M |
| Revenue | 3.68B | 241M |
| EBITDA | 2.33B | 42M |
| EBIT | 2.10B | 18M |
| Net Income | 1.50B | -2M |
| EPS | 6.13 | -0.36 |
| Fiscal Year | 2024 | 2025 |
Income Statement Interpretations
Trimble Inc.
Trimble’s revenue grew 17.02% over 2020-2024 but declined 3.04% in 2024 alone, while net income surged 285.84% overall, with a strong 398.4% increase last year. Margins are robust and improving, boasting a 65.06% gross margin and 40.84% net margin in 2024. Recent results show margin expansion despite slight revenue contraction.
Mesa Laboratories, Inc.
Mesa Labs achieved 79.92% revenue growth from 2021 to 2025, with an 11.47% increase last year, but net income declined overall by 160.29%, including a loss in 2025. Gross margin remains favorable at 62.61%, yet net margin is negative at -0.82%. EBIT margin is neutral, reflecting uneven profitability despite top-line gains.
Which one has the stronger fundamentals?
Trimble displays stronger fundamentals with consistently favorable margins, high net margin, and significant net income growth, despite a recent revenue dip. Mesa Labs shows solid revenue growth but suffers from negative net margins and net income declines, indicating profitability challenges. Trimble’s income statement health appears more stable and robust.
Financial Ratios Comparison
Below is a comparison of key financial ratios for Trimble Inc. (TRMB) and Mesa Laboratories, Inc. (MLAB) based on the most recent fiscal year data available.
| Ratios | Trimble Inc. (TRMB) FY 2024 | Mesa Laboratories, Inc. (MLAB) FY 2025 |
|---|---|---|
| ROE | 26.18% | -1.24% |
| ROIC | 4.49% | -1.45% |
| P/E | 11.52 | -326.35 |
| P/B | 3.02 | 4.03 |
| Current Ratio | 1.27 | 0.63 |
| Quick Ratio | 1.16 | 0.47 |
| D/E (Debt to Equity) | 0.26 | 1.14 |
| Debt-to-Assets | 15.96% | 41.88% |
| Interest Coverage | 5.08 | 1.38 |
| Asset Turnover | 0.39 | 0.56 |
| Fixed Asset Turnover | 11.81 | 7.45 |
| Payout ratio | 0% | -175.68% |
| Dividend yield | 0% | 0.54% |
Interpretation of the Ratios
Trimble Inc.
Trimble Inc. presents a generally favorable ratio profile with a strong net margin of 40.84% and a robust return on equity at 26.18%. However, its return on invested capital (4.49%) and weighted average cost of capital (10.81%) are less favorable, indicating some inefficiency in capital use. The company does not pay dividends, which may reflect a reinvestment strategy or focus on growth rather than shareholder distributions.
Mesa Laboratories, Inc.
Mesa Laboratories exhibits weak financial ratios, including negative net margin (-0.82%) and return on equity (-1.24%), signaling profitability challenges. Its debt-to-equity ratio (1.14) and interest coverage (1.5) are also unfavorable, hinting at higher financial risk. The company pays a small dividend yielding 0.54%, but given its negative earnings, this payout could be unsustainable in the long term.
Which one has the best ratios?
Trimble Inc. holds the advantage with a higher proportion of favorable ratios (57.14%) and a positive global evaluation, reflecting stronger profitability and financial health. Mesa Laboratories, with a majority of unfavorable ratios (64.29%) and weaker earnings metrics, faces more pronounced financial challenges, making its overall ratio profile less favorable.
Strategic Positioning
This section compares the strategic positioning of Trimble Inc. and Mesa Laboratories, Inc., focusing on market position, key segments, and exposure to technological disruption:
Trimble Inc.
- Large market cap of 19B USD with diversified competitive pressure in technology hardware.
- Diverse segments: Buildings and Infrastructure, Geospatial, Resources, Utilities, Transportation.
- Exposure to disruption through advanced software and autonomous systems across sectors.
Mesa Laboratories, Inc.
- Smaller market cap of 473M USD, facing competitive pressure in niche life sciences tools.
- Concentrated segments: Sterilization control, Biopharmaceutical, Calibration, Clinical Genomics.
- Exposure to disruption in automated protein analysis and genetic testing technologies.
Trimble Inc. vs Mesa Laboratories, Inc. Positioning
Trimble adopts a diversified approach across multiple technology-driven sectors, offering broad exposure but facing varied competitive pressures. Mesa Laboratories focuses on specialized life sciences tools, which narrows its market but may limit scale advantages.
Which has the best competitive advantage?
Both companies have a very unfavorable moat status with declining ROIC trends, indicating value destruction and weakening competitive advantages. Neither currently demonstrates a sustainable economic moat based on recent capital efficiency.
Stock Comparison
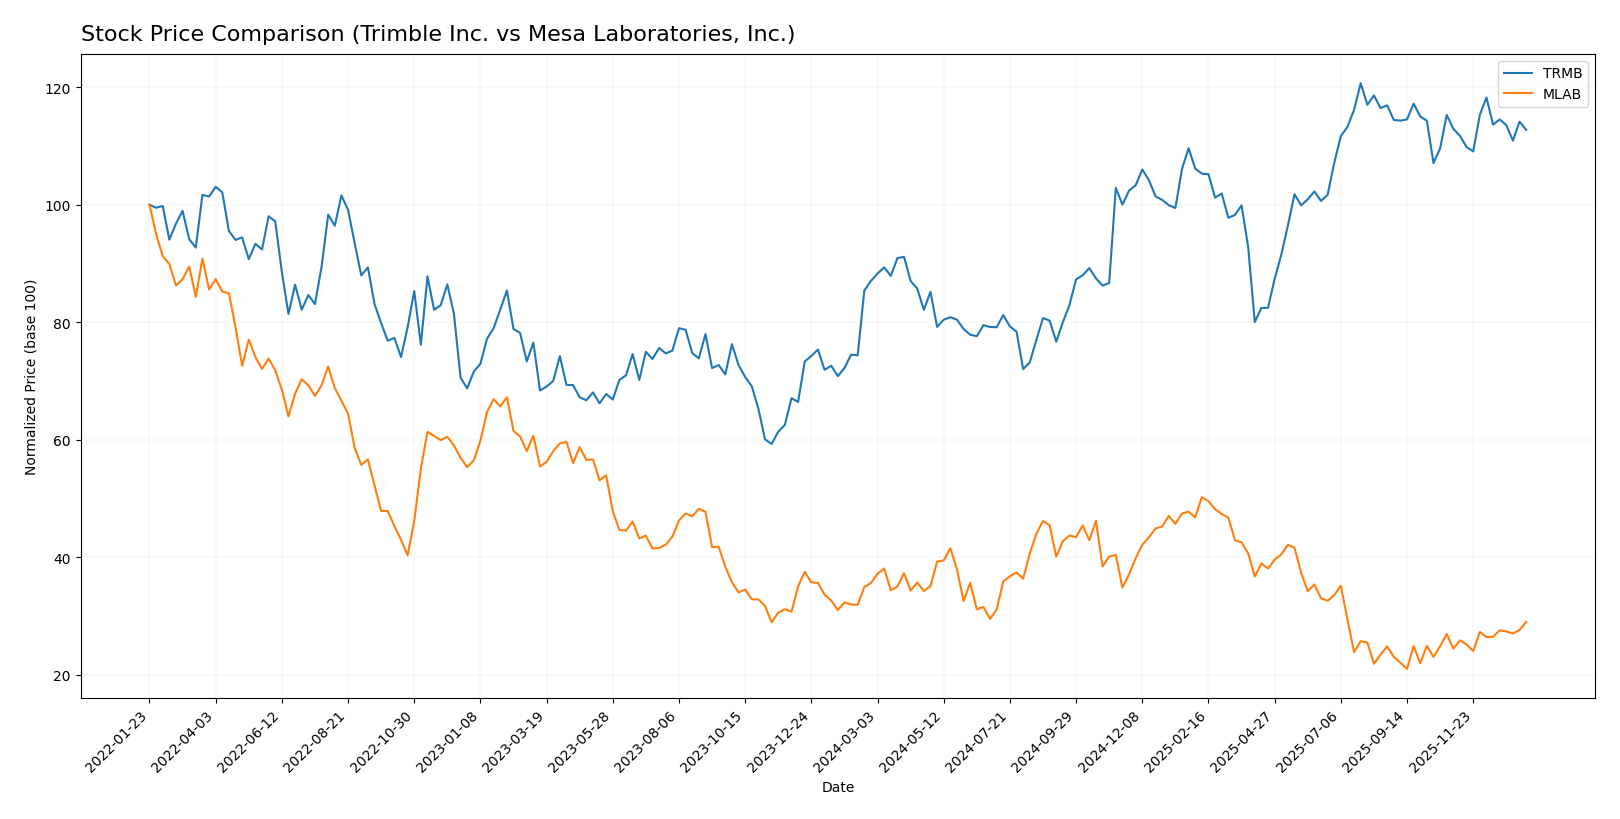
The stock price movements of Trimble Inc. (TRMB) and Mesa Laboratories, Inc. (MLAB) over the past year reveal contrasting trading dynamics, with TRMB showing a strong overall gain and MLAB experiencing a significant decline followed by recent recovery.
Trend Analysis
Trimble Inc. (TRMB) exhibited a bullish trend over the past 12 months with a 29.56% price increase, although this growth showed signs of deceleration. The stock ranged from a low of 50.86 to a high of 85.24, with moderate volatility at a 9.79 standard deviation.
Mesa Laboratories, Inc. (MLAB) followed a bearish trend over the same period, declining 18.61% with accelerating downward momentum. The stock’s price fluctuated widely, hitting a high of 147.79 and a low of 61.66, marked by higher volatility at a 23.26 standard deviation.
Comparing the two, Trimble Inc. delivered higher market performance with a positive gain, whereas Mesa Laboratories faced overall losses despite recent short-term price recovery.
Target Prices
The current analyst consensus indicates positive price targets for both Trimble Inc. and Mesa Laboratories, Inc.
| Company | Target High | Target Low | Consensus |
|---|---|---|---|
| Trimble Inc. | 102 | 94 | 98.2 |
| Mesa Laboratories, Inc. | 83 | 83 | 83 |
Trimble’s consensus target price of 98.2 suggests a potential upside from its current price of 79.7 USD, indicating moderate growth expectations. Mesa Laboratories’ target at 83 is slightly below its current price of 85.7 USD, signaling a cautious outlook by analysts.
Analyst Opinions Comparison
This section compares analysts’ ratings and grades for Trimble Inc. and Mesa Laboratories, Inc.:
Rating Comparison
Trimble Inc. Rating
- Rating: B-, considered very favorable by analysts.
- Discounted Cash Flow Score: Moderate score of 3.
- ROE Score: Moderate efficiency with a score of 3.
- ROA Score: Moderate asset utilization scoring 3.
- Debt To Equity Score: Moderate financial risk score of 2.
- Overall Score: Moderate overall financial standing with 2.
Mesa Laboratories, Inc. Rating
- Rating: C+, also considered very favorable by analysts.
- Discounted Cash Flow Score: Very favorable with a high score of 5.
- ROE Score: Very unfavorable low score of 1.
- ROA Score: Very unfavorable low score of 1.
- Debt To Equity Score: Very unfavorable higher financial risk with a score of 1.
- Overall Score: Also moderate overall score of 2.
Which one is the best rated?
Trimble Inc. holds a better overall rating (B-) compared to Mesa Laboratories’ C+, with more balanced scores across ROE, ROA, and debt to equity metrics. Mesa excels only in discounted cash flow, while Trimble shows more consistent moderate performance.
Scores Comparison
Here is a comparison of the Altman Z-Score and Piotroski Score for both companies:
TRMB Scores
- Altman Z-Score: 4.56, indicating a safe zone.
- Piotroski Score: 6, considered average.
MLAB Scores
- Altman Z-Score: 1.36, indicating distress zone.
- Piotroski Score: 5, considered average.
Which company has the best scores?
Trimble Inc. (TRMB) shows a significantly stronger Altman Z-Score, placing it in the safe zone, unlike Mesa Laboratories (MLAB), which is in the distress zone. Both have similar average Piotroski Scores.
Grades Comparison
Here is the comparison of recent grades and analyst ratings for Trimble Inc. and Mesa Laboratories, Inc.:
Trimble Inc. Grades
The following table summarizes recent analyst grades and actions for Trimble Inc.:
| Grading Company | Action | New Grade | Date |
|---|---|---|---|
| Barclays | Maintain | Overweight | 2026-01-12 |
| Keybanc | Upgrade | Overweight | 2025-12-16 |
| Piper Sandler | Maintain | Overweight | 2025-11-07 |
| JP Morgan | Maintain | Overweight | 2025-09-19 |
| JP Morgan | Maintain | Overweight | 2025-08-07 |
| Oppenheimer | Maintain | Outperform | 2025-08-07 |
| Raymond James | Maintain | Outperform | 2025-08-07 |
| Oppenheimer | Maintain | Outperform | 2025-07-17 |
| JP Morgan | Maintain | Overweight | 2025-07-10 |
| JP Morgan | Maintain | Overweight | 2025-05-14 |
Trimble consistently received “Overweight” and “Outperform” grades with mostly maintained positive outlooks from multiple reputable firms.
Mesa Laboratories, Inc. Grades
The following table summarizes recent analyst grades and actions for Mesa Laboratories, Inc.:
| Grading Company | Action | New Grade | Date |
|---|---|---|---|
| Wells Fargo | Maintain | Equal Weight | 2025-12-15 |
| Wells Fargo | Upgrade | Equal Weight | 2025-08-08 |
| Wells Fargo | Maintain | Underweight | 2025-05-30 |
| Evercore ISI Group | Maintain | Outperform | 2024-10-01 |
| Evercore ISI Group | Maintain | Outperform | 2024-08-06 |
| Evercore ISI Group | Maintain | Outperform | 2024-07-02 |
| Evercore ISI Group | Maintain | Outperform | 2024-04-04 |
| Evercore ISI Group | Upgrade | Outperform | 2024-01-04 |
| Evercore ISI Group | Downgrade | In Line | 2021-01-04 |
| Evercore ISI Group | Downgrade | In Line | 2021-01-03 |
Mesa Laboratories shows more mixed grades with both upgrades and downgrades; recent ratings mostly range from “Equal Weight” to “Outperform.”
Which company has the best grades?
Trimble Inc. has received more consistent and favorable grades, predominantly “Overweight” and “Outperform,” compared to Mesa Laboratories, which has more varied ratings including “Equal Weight” and “Underweight.” This suggests a stronger analyst confidence in Trimble’s outlook, potentially implying a more favorable perception of growth or stability for investors.
Strengths and Weaknesses
Below is a comparative overview of key strengths and weaknesses for Trimble Inc. (TRMB) and Mesa Laboratories, Inc. (MLAB) based on the most recent data.
| Criterion | Trimble Inc. (TRMB) | Mesa Laboratories, Inc. (MLAB) |
|---|---|---|
| Diversification | Broad product and service mix across multiple sectors including Buildings, Geospatial, Resources, and Transportation | Focused primarily on product sales with some service offerings in biopharma and calibration |
| Profitability | Strong net margin (40.8%) and ROE (26.2%) but ROIC below WACC indicates inefficiency | Negative net margin and ROIC, indicating ongoing losses and value destruction |
| Innovation | Consistent investment in advanced devices and engineering solutions | Moderate innovation in biological indicators and monitoring solutions, but financial metrics suggest challenges |
| Global presence | Significant global footprint across infrastructure and geospatial markets | More niche and less global scale, specialized in laboratory and biopharma sectors |
| Market Share | Substantial market presence in construction and geospatial technology | Smaller market share with niche focus, facing profitability pressures |
Key takeaways: Trimble demonstrates strong profitability metrics and diversification, though it struggles with capital efficiency. Mesa Laboratories faces significant profitability and liquidity challenges despite its niche market focus, representing higher investment risk.
Risk Analysis
Below is a comparative table outlining key risk factors for Trimble Inc. (TRMB) and Mesa Laboratories, Inc. (MLAB) based on the most recent data available in 2026:
| Metric | Trimble Inc. (TRMB) | Mesa Laboratories, Inc. (MLAB) |
|---|---|---|
| Market Risk | Beta 1.59, higher volatility; exposure to tech sector cyclicality | Beta 0.89, lower volatility but vulnerable to niche markets |
| Debt level | Low debt-to-equity 0.26, favorable leverage | High debt-to-equity 1.14, unfavorable leverage, financial strain |
| Regulatory Risk | Moderate, technology and infrastructure regulations | Moderate to high, healthcare and lab regulations sensitive |
| Operational Risk | Moderate; complex global operations, tech integration challenges | Elevated; smaller scale, dependency on innovation and product approvals |
| Environmental Risk | Moderate; sustainability initiatives in agriculture and construction | Low to moderate; medical device manufacturing impact controlled |
| Geopolitical Risk | Moderate; global supply chain exposure | Moderate; international sales subject to trade policies |
The most impactful risk for TRMB is market volatility due to its higher beta and exposure to global tech infrastructure markets, balanced by strong financial health and low debt. For MLAB, the critical risks are high financial leverage and operational vulnerability amid regulatory scrutiny in healthcare sectors, raising concerns about liquidity and sustainability. Investors should weigh TRMB’s moderate market risk against MLAB’s elevated financial and operational risks carefully.
Which Stock to Choose?
Trimble Inc. (TRMB) shows a generally favorable income evolution with strong net margin growth and profitability, supported by a solid return on equity of 26.18%. Its financial ratios are mostly positive, reflecting low debt levels and good liquidity, though return on invested capital is below its cost of capital, signaling value destruction. The company holds a very favorable rating with moderate overall scores and a safe Altman Z-Score.
Mesa Laboratories, Inc. (MLAB) presents mixed income results, with positive recent revenue growth but negative net margin and return on equity, indicating profitability challenges. Financial ratios are predominantly unfavorable, including high debt and weak liquidity metrics. Despite a very favorable overall rating and strong discounted cash flow score, it suffers from a distress zone Altman Z-Score and declining profitability.
Investors focused on stable profitability and financial strength might find Trimble’s profile more aligned with their goals, while those interested in potential turnaround or growth opportunities could interpret Mesa Laboratories’ recent revenue gains and valuation as a signal worth monitoring. Both companies exhibit declining returns on invested capital, suggesting caution regarding long-term value creation.
Disclaimer: Investment carries a risk of loss of initial capital. The past performance is not a reliable indicator of future results. Be sure to understand risks before making an investment decision.
Go Further
I encourage you to read the complete analyses of Trimble Inc. and Mesa Laboratories, Inc. to enhance your investment decisions: