Home > Comparison > Technology > TDY vs MLAB
The strategic rivalry between Teledyne Technologies Incorporated and Mesa Laboratories, Inc. shapes advances in the Technology sector’s Hardware, Equipment & Parts industry. Teledyne operates as a diversified industrial powerhouse with broad aerospace and defense applications. Mesa Laboratories focuses on niche life sciences tools and quality control products with a specialized biopharmaceutical edge. This analysis weighs their distinct growth and risk profiles to identify which company offers the superior risk-adjusted return potential for a balanced portfolio.

Table of contents
Companies Overview
Teledyne Technologies and Mesa Laboratories each hold critical roles in the hardware and equipment sector, serving distinct industrial niches with specialized technologies.
Teledyne Technologies Incorporated: Industrial Tech Powerhouse
Teledyne Technologies dominates with a diverse portfolio spanning instrumentation, digital imaging, aerospace, and engineered systems. Its revenue engine relies on high-tech products like sensors, imaging systems, and defense electronics sold globally. In 2026, Teledyne focused strategically on advancing integrated systems and expanding its aerospace and defense offerings to solidify its industrial growth market presence.
Mesa Laboratories, Inc.: Life Sciences Calibration Expert
Mesa Laboratories specializes in life sciences tools and quality control products, serving hospital, pharmaceutical, and biopharmaceutical sectors. Its core revenue derives from sterilization indicators, protein analysis systems, and genetic testing tools. In 2026, Mesa concentrated on enhancing automated systems for protein and peptide analysis while expanding clinical genomics capabilities to meet growing healthcare demands.
Strategic Collision: Similarities & Divergences
Teledyne adopts a broad technology integration approach, while Mesa opts for niche life sciences specialization. Their competitive battleground lies in precision instrumentation, but Teledyne targets industrial and defense markets, Mesa focuses on healthcare and biopharma. This divergence defines Teledyne as a diversified industrial tech giant and Mesa as a focused innovator in life sciences calibration and diagnostics.
Income Statement Comparison
The following data dissects the core profitability and scalability of both corporate engines to reveal who dominates the bottom line:
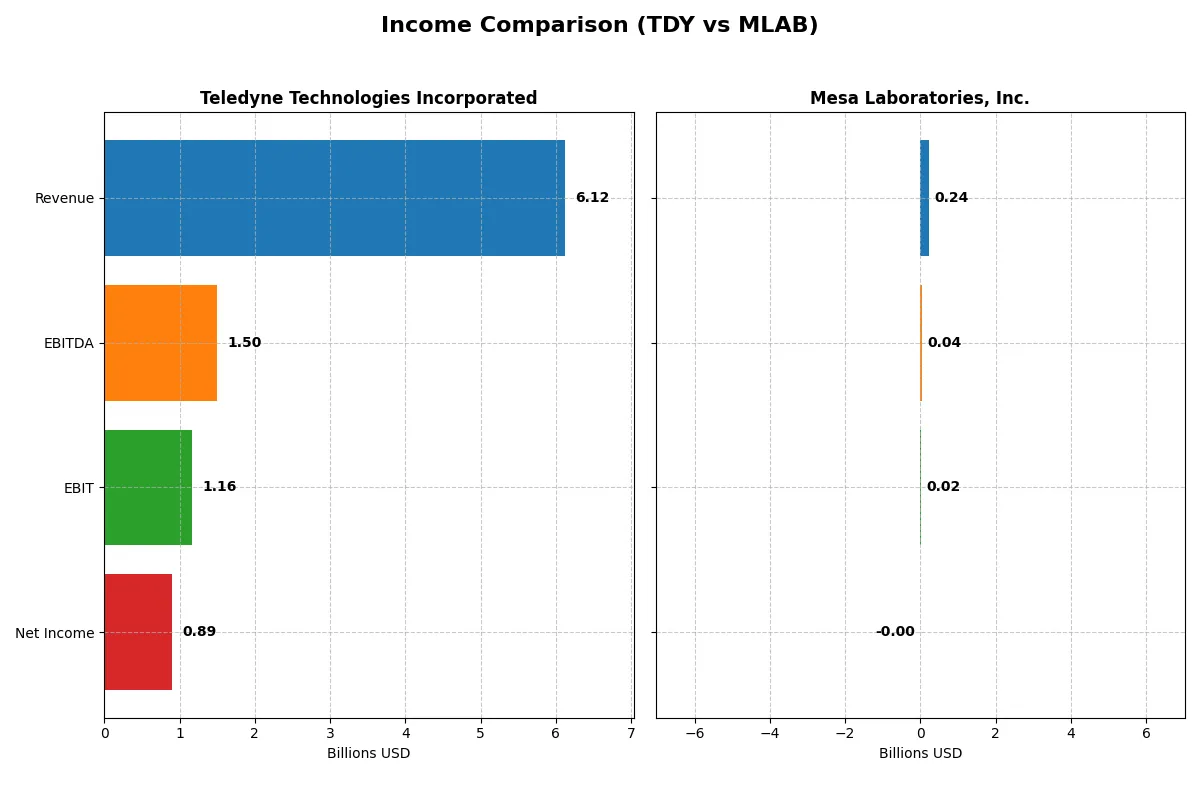
| Metric | Teledyne Technologies Incorporated (TDY) | Mesa Laboratories, Inc. (MLAB) |
|---|---|---|
| Revenue | 6.12B | 241M |
| Cost of Revenue | 3.72B | 90M |
| Operating Expenses | 1.25B | 135M |
| Gross Profit | 2.40B | 151M |
| EBITDA | 1.50B | 42M |
| EBIT | 1.16B | 18M |
| Interest Expense | 60M | 12M |
| Net Income | 895M | -2M |
| EPS | 18.88 | -0.36 |
| Fiscal Year | 2025 | 2025 |
Income Statement Analysis: The Bottom-Line Duel
This income statement comparison reveals which company runs its business with superior efficiency and sustainable profitability.
Teledyne Technologies Incorporated Analysis
Teledyne’s revenue rose steadily from 4.6B in 2021 to 6.1B in 2025, doubling net income over the period to 895M. Gross margins remain robust near 39%, and net margins improved to 14.6%, signaling strong cost control. In 2025, EBIT surged 17%, showing operational momentum and disciplined capital allocation.
Mesa Laboratories, Inc. Analysis
Mesa Laboratories grew revenue from 134M in 2021 to 241M in 2025, a 79.9% rise. However, net income suffered a 160% decline, turning negative at -2M in 2025. Despite a high gross margin of 62.6%, net margins are negative due to elevated operating expenses and interest costs. The latest year shows a sharp turnaround but remains loss-making.
Margin Strength vs. Profitability Sustainability
Teledyne dominates with consistent revenue growth, expanding net margins, and solid operational leverage. Mesa boasts higher gross margins but struggles with profitability and sustained losses. For investors prioritizing stable profits and efficiency, Teledyne’s profile clearly outshines Mesa’s volatile earnings and margin pressures.
Financial Ratios Comparison
These vital ratios act as a diagnostic tool to expose the underlying fiscal health, valuation premiums, and capital efficiency of the companies analyzed:
| Ratios | Teledyne Technologies (TDY) | Mesa Laboratories (MLAB) |
|---|---|---|
| ROE | 8.5% | -1.2% |
| ROIC | 6.8% | -1.4% |
| P/E | 27.3 | -326.3 |
| P/B | 2.33 | 4.03 |
| Current Ratio | 1.64 | 0.63 |
| Quick Ratio | 1.08 | 0.47 |
| D/E | 0.24 | 1.14 |
| Debt-to-Assets | 16.2% | 41.9% |
| Interest Coverage | 19.3 | 1.38 |
| Asset Turnover | 0.40 | 0.56 |
| Fixed Asset Turnover | 7.29 | 7.45 |
| Payout Ratio | 0% | -176.7% |
| Dividend Yield | 0% | 0.54% |
| Fiscal Year | 2025 | 2025 |
Efficiency & Valuation Duel: The Vital Signs
Ratios act as a company’s DNA, exposing hidden risks and highlighting operational excellence critical for investment decisions.
Teledyne Technologies Incorporated
Teledyne posts a solid net margin of 14.63% but a modest ROE of 8.51%, signaling moderate profitability. Its P/E of 27.35 suggests the stock is somewhat expensive. Teledyne maintains a healthy current ratio of 1.64 and prioritizes reinvestment in R&D over dividends, aiming for sustainable growth.
Mesa Laboratories, Inc.
Mesa Laboratories struggles with negative profitability metrics, posting a net margin of -0.82% and ROE of -1.24%, reflecting operational challenges. The stock’s P/E is negative but skewed by losses; its current ratio of 0.63 flags liquidity concerns. Mesa’s shareholder returns rely on growth investments rather than dividends, underlining elevated risk.
Balanced Efficiency vs. Strained Profitability
Teledyne offers a more balanced profile with favorable liquidity and moderate valuation despite some stretched multiples. Mesa faces unfavorable profitability and liquidity ratios, increasing risk. Investors seeking operational stability may prefer Teledyne, while those accepting higher risk might consider Mesa’s growth potential.
Which one offers the Superior Shareholder Reward?
Teledyne Technologies (TDY) pays no dividends but generates strong free cash flow (22.7/share in 2025) and supports buybacks, sustaining long-term value. Mesa Laboratories (MLAB) offers a modest 0.54% dividend yield but suffers net losses and high leverage, limiting buyback capacity. I favor TDY’s cash-rich, buyback-focused model for superior total return in 2026.
Comparative Score Analysis: The Strategic Profile
The radar chart reveals the fundamental DNA and trade-offs of Teledyne Technologies and Mesa Laboratories:
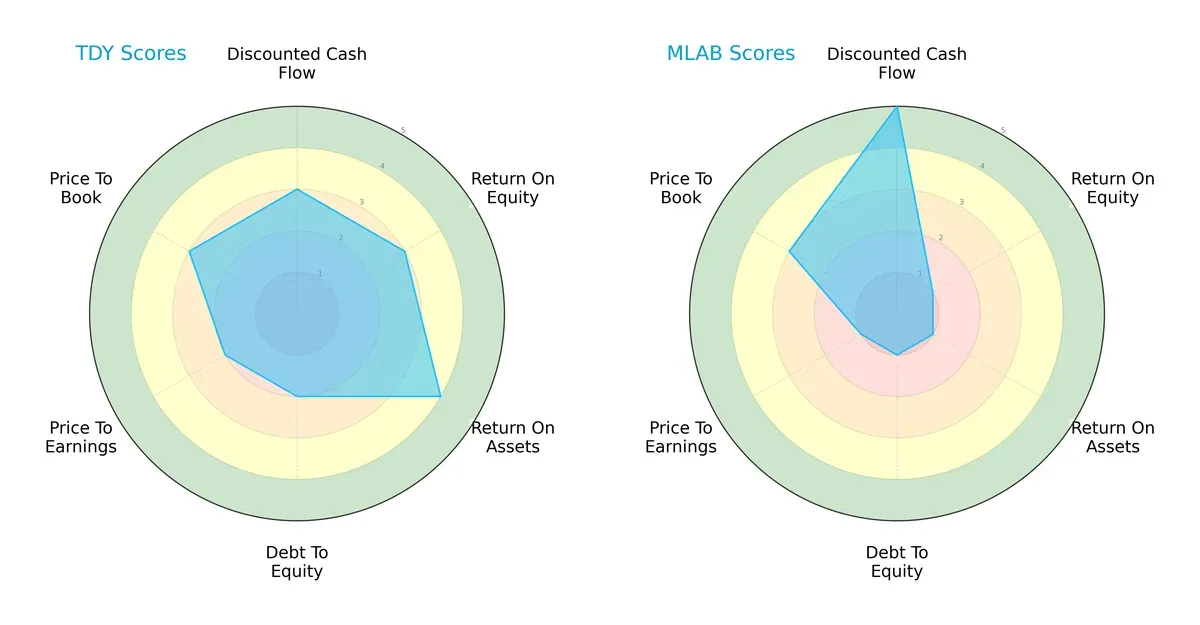
Teledyne Technologies shows a balanced profile with moderate DCF, ROE, and ROA scores, but a moderate debt load. Mesa Laboratories excels in discounted cash flow valuation but scores very low on profitability and financial stability metrics. Teledyne relies on consistent operational efficiency, while Mesa depends heavily on valuation advantages.
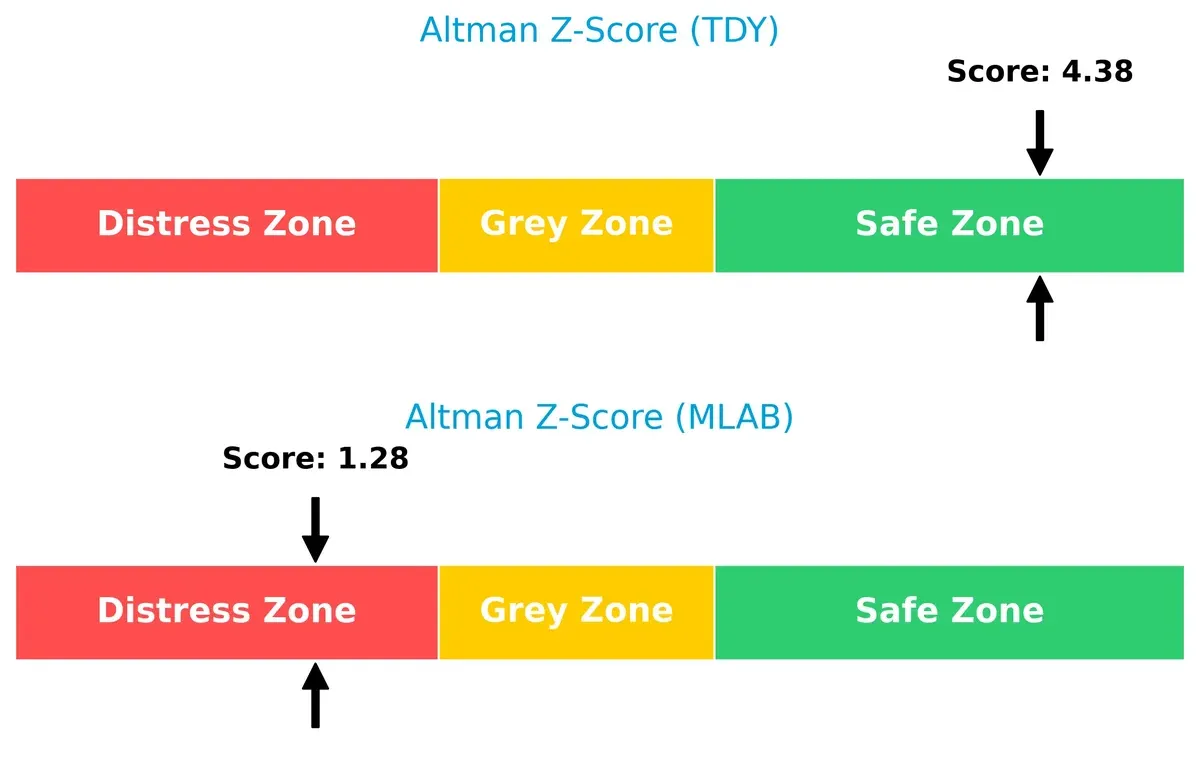
Bankruptcy Risk: Solvency Showdown
Teledyne’s Altman Z-Score of 4.38 places it firmly in the safe zone, while Mesa’s 1.28 signals distress risk. This gap highlights Teledyne’s stronger long-term survival prospects in this cycle:
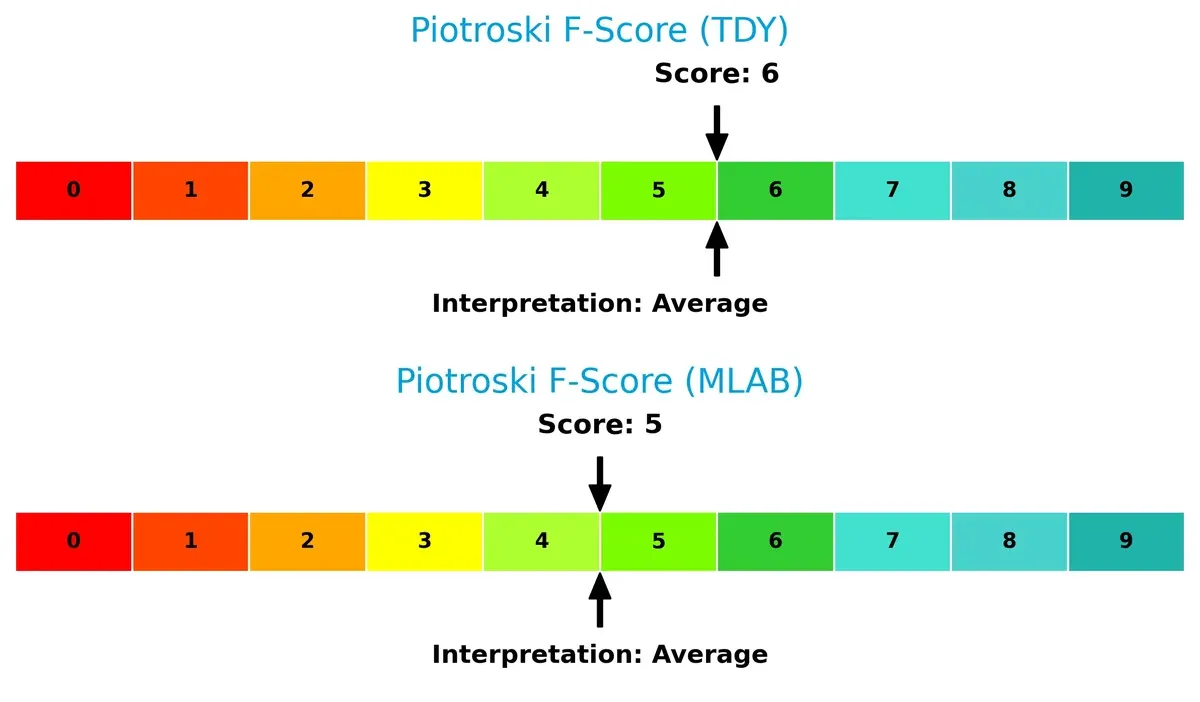
Financial Health: Quality of Operations
Both firms present average Piotroski F-Scores—Teledyne at 6 and Mesa at 5—indicating moderate financial health but no red flags. Neither shows peak operational quality, suggesting cautious optimism:
How are the two companies positioned?
This section dissects the operational DNA of TDY and MLAB by comparing their revenue distribution and internal dynamics. The objective is to confront their economic moats to reveal which business model offers a more resilient, sustainable competitive advantage today.
Revenue Segmentation: The Strategic Mix
This comparison dissects how Teledyne Technologies and Mesa Laboratories diversify income streams and reveals their primary sector bets in 2024–2025:
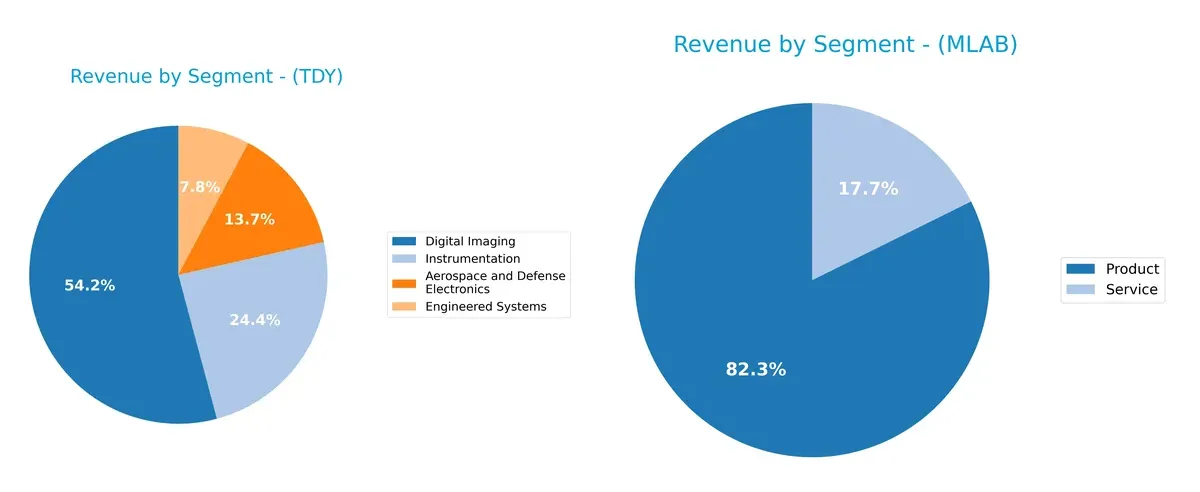
Teledyne dominates with a heavy Digital Imaging segment at $3.07B, dwarfing Aerospace & Defense Electronics ($777M) and others. This concentration anchors its strategy in imaging innovation but raises reliance risk. Mesa Laboratories shows a more balanced mix in 2025, splitting $198M product revenue and $43M services, signaling steady diversification and reduced concentration risk compared to Teledyne’s single-segment pivot.
Strengths and Weaknesses Comparison
This table compares the strengths and weaknesses of Teledyne Technologies Incorporated (TDY) and Mesa Laboratories, Inc. (MLAB):
TDY Strengths
- Strong revenue diversification across Aerospace, Imaging, Systems, and Instrumentation
- Favorable net margin at 14.63%
- Low debt-to-equity at 0.24 supports financial stability
- Robust current and quick ratios above 1.0
- Global presence with significant sales in US, Europe, and Asia
- High fixed asset turnover at 7.29 indicates efficient asset use
MLAB Strengths
- Presence in specialized biopharmaceutical and clinical genomics segments
- Favorable weighted average cost of capital at 6.62%
- Positive fixed asset turnover at 7.45
- Favorable price-to-earnings ratio despite negative earnings
- Product and service revenue streams offer some diversification
- Concentrated US and China markets provide focused geographic exposure
TDY Weaknesses
- Return on equity at 8.51% is unfavorable versus cost of capital
- Price-to-earnings ratio at 27.35 may suggest overvaluation
- Asset turnover at 0.4 is below ideal, indicating less efficient sales generation
- No dividend yield limits income investors
- Significant net margin and interest coverage contrasts mask some operational inefficiencies
- Moderate exposure to market cyclicality in Aerospace and Defense
MLAB Weaknesses
- Negative net margin (-0.82%) and negative ROE (-1.24%) indicate profitability challenges
- Current and quick ratios below 1.0 highlight liquidity risks
- High debt-to-equity at 1.14 increases financial leverage concerns
- Low interest coverage at 1.5 signals vulnerability to interest expenses
- Elevated price-to-book at 4.03 suggests overvaluation risks
- Limited geographic diversification, heavy reliance on US market
TDY demonstrates broad diversification and financial stability, though some efficiency and valuation metrics warrant attention. MLAB faces profitability and liquidity challenges but benefits from focused market niches and lower capital costs. These contrasts reflect differing strategic and operational positions within their sectors.
The Moat Duel: Analyzing Competitive Defensibility
A structural moat is the only barrier that shields long-term profits from relentless competitive pressure and market erosion:
Teledyne Technologies Incorporated: Diversified Technology Integration Moat
Teledyne’s moat stems from its broad technology portfolio integrating instrumentation, imaging, and defense electronics. This diversity supports stable margins and growing ROIC despite value erosion. New aerospace and defense innovations could deepen its moat in 2026.
Mesa Laboratories, Inc.: Specialized Life Sciences Quality Control Moat
Mesa relies on niche expertise in sterilization and biopharmaceutical tools, unlike Teledyne’s diversification. Its high gross margins belie declining ROIC trends, signaling weakening competitive strength. Expansion into genomic clinical testing might arrest this decline.
Verdict: Diversification Versus Niche Focus in Moat Sustainability
Teledyne’s diversified moat shows greater resilience with improving profitability trends. Mesa’s specialized moat faces shrinking returns and value destruction. I find Teledyne better positioned to defend and expand its market share in 2026.
Which stock offers better returns?
The past year reveals contrasting trajectories: Teledyne Technologies surges with strong acceleration, while Mesa Laboratories faces a significant decline despite recent mild recovery.
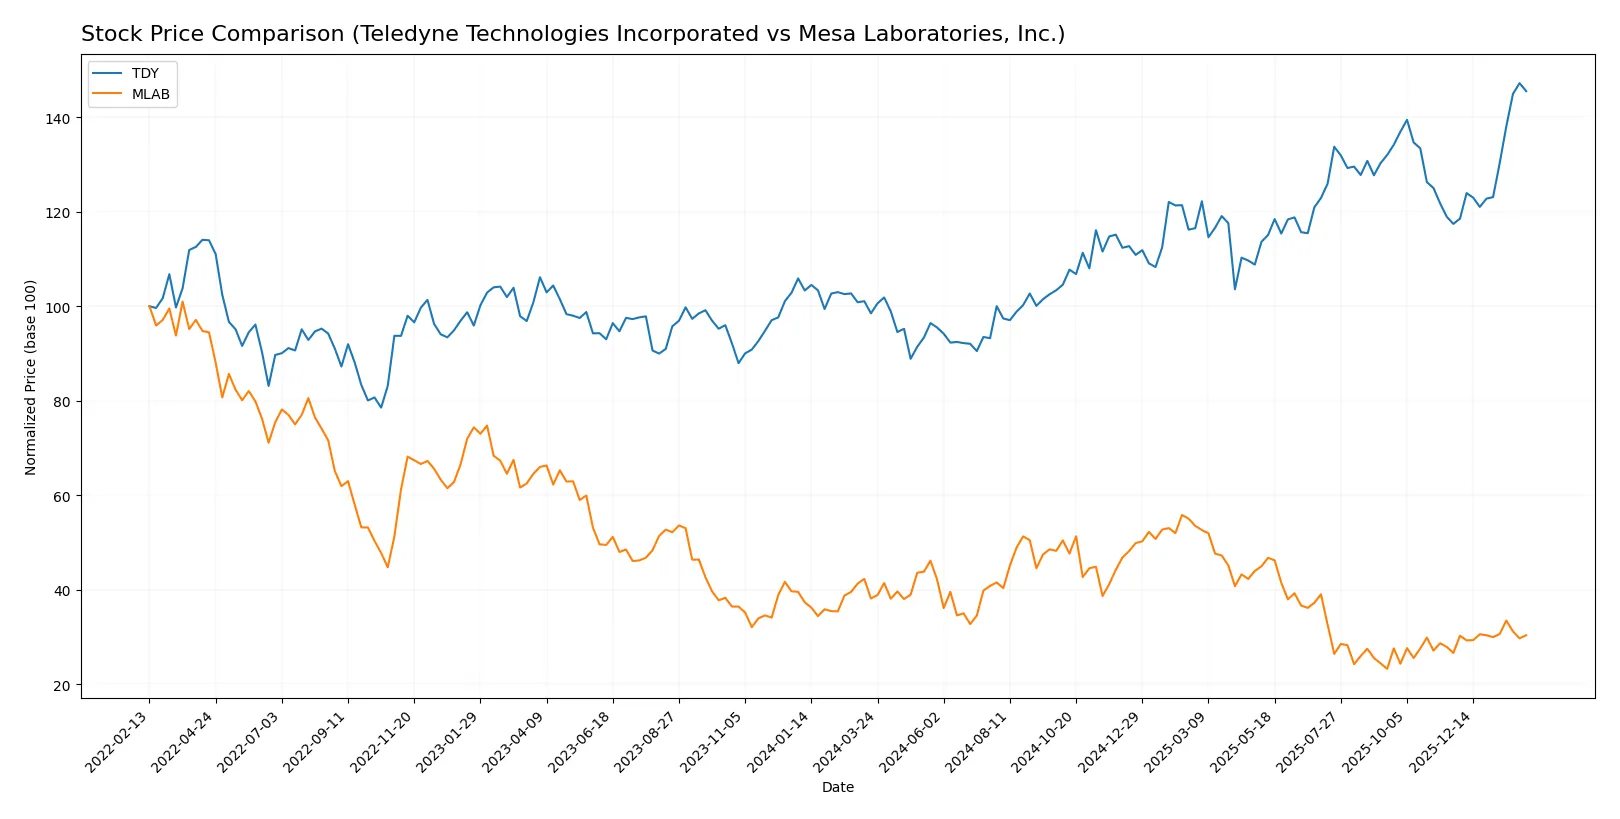
Trend Comparison
Teledyne Technologies shows a 47.72% price increase over the past 12 months, marking a bullish trend with accelerating momentum and high volatility. Its price ranged between 374.64 and 620.3.
Mesa Laboratories declined by 20.36% over the same period, reflecting a bearish trend with accelerating downward movement and lower volatility. The price fluctuated from 61.66 to 147.79.
Comparing the two, Teledyne clearly outperformed Mesa, delivering the highest market returns with robust upward acceleration, while Mesa’s overall performance remained negative despite recent modest gains.
Target Prices
Analysts present a clear target consensus for Teledyne Technologies and Mesa Laboratories.
| Company | Target Low | Target High | Consensus |
|---|---|---|---|
| Teledyne Technologies Incorporated | 599 | 720 | 638.5 |
| Mesa Laboratories, Inc. | 83 | 83 | 83 |
Teledyne’s consensus target price exceeds its current $613 stock price, suggesting moderate upside. Mesa Laboratories trades near its $80.5 price, with a tight target at $83, indicating limited near-term movement.

Don’t Let Luck Decide Your Entry Point
Optimize your entry points with our advanced ProRealTime indicators. You’ll get efficient buy signals with precise price targets for maximum performance. Start outperforming now!
How do institutions grade them?
Teledyne Technologies Incorporated Grades
Here are the most recent grades from major financial institutions for Teledyne Technologies Incorporated:
| Grading Company | Action | New Grade | Date |
|---|---|---|---|
| Barclays | maintain | Equal Weight | 2026-01-22 |
| Needham | maintain | Buy | 2026-01-22 |
| Stifel | maintain | Buy | 2026-01-22 |
| Citigroup | maintain | Neutral | 2026-01-13 |
| Barclays | maintain | Equal Weight | 2026-01-12 |
| Needham | maintain | Buy | 2025-10-23 |
| Barclays | maintain | Equal Weight | 2025-10-23 |
| Stifel | maintain | Buy | 2025-10-23 |
| Morgan Stanley | maintain | Equal Weight | 2025-10-15 |
| UBS | maintain | Buy | 2025-07-24 |
Mesa Laboratories, Inc. Grades
The following table shows recent grades issued by reputable institutions for Mesa Laboratories, Inc.:
| Grading Company | Action | New Grade | Date |
|---|---|---|---|
| Wells Fargo | maintain | Equal Weight | 2025-12-15 |
| Wells Fargo | upgrade | Equal Weight | 2025-08-08 |
| Wells Fargo | maintain | Underweight | 2025-05-30 |
| Evercore ISI Group | maintain | Outperform | 2024-10-01 |
| Evercore ISI Group | maintain | Outperform | 2024-08-06 |
| Evercore ISI Group | maintain | Outperform | 2024-07-02 |
| Evercore ISI Group | maintain | Outperform | 2024-04-04 |
| Evercore ISI Group | upgrade | Outperform | 2024-01-04 |
Which company has the best grades?
Teledyne Technologies holds a consistent Buy or Equal Weight rating from multiple top-tier firms. Mesa Laboratories shows strong Outperform ratings from Evercore ISI but mixed opinions from Wells Fargo. Investors might see Teledyne’s stable Buy consensus as lower risk, while Mesa’s Outperform grades indicate higher growth expectations with varied risk perception.
Risks specific to each company
The following categories identify the critical pressure points and systemic threats facing both firms in the 2026 market environment:
1. Market & Competition
Teledyne Technologies Incorporated
- Operates in diverse industrial and defense markets, facing competition from large tech and aerospace firms.
Mesa Laboratories, Inc.
- Focuses on niche life sciences and calibration tools, competing with specialized biotech and lab equipment firms.
2. Capital Structure & Debt
Teledyne Technologies Incorporated
- Maintains low debt levels (D/E 0.24), strong interest coverage (19.47), indicating financial stability.
Mesa Laboratories, Inc.
- High debt-to-equity (1.14) and weak interest coverage (1.5) raise concerns over leverage risk.
3. Stock Volatility
Teledyne Technologies Incorporated
- Beta near 1.0 (1.014) signals market-level volatility and moderate risk.
Mesa Laboratories, Inc.
- Lower beta (0.891) implies less sensitivity to market swings, but limited liquidity may cause price swings.
4. Regulatory & Legal
Teledyne Technologies Incorporated
- Aerospace and defense segments face stringent export controls and government contracting risks.
Mesa Laboratories, Inc.
- Life sciences products subject to regulatory approvals and compliance risks globally.
5. Supply Chain & Operations
Teledyne Technologies Incorporated
- Complex global supply chain for high-tech components vulnerable to geopolitical disruptions.
Mesa Laboratories, Inc.
- Smaller scale operations with reliance on specialized materials; less diversified supply base.
6. ESG & Climate Transition
Teledyne Technologies Incorporated
- Exposure to environmental regulations in aerospace and defense; growing pressure to improve sustainability.
Mesa Laboratories, Inc.
- Faces increasing ESG expectations in life sciences and manufacturing sectors; smaller footprint but limited resources.
7. Geopolitical Exposure
Teledyne Technologies Incorporated
- Significant international sales and defense contracts expose it to US-China tensions and trade policies.
Mesa Laboratories, Inc.
- Primarily US and Europe focused, lower direct geopolitical risk but sensitive to global biotech trade dynamics.
Which company shows a better risk-adjusted profile?
Teledyne’s strongest risk is geopolitical and operational complexity due to its global aerospace footprint. Mesa Laboratories struggles most with capital structure and regulatory risks, reflected in its distress-zone Altman Z-score. Teledyne’s balanced leverage, superior interest coverage, and safe-zone Z-score reveal a more robust risk-adjusted profile. Recent financials show Mesa’s negative margins and high debt as red flags, reinforcing Teledyne’s comparative stability.
Final Verdict: Which stock to choose?
Teledyne Technologies (TDY) excels as a precision capital allocator with a steadily growing return on capital despite currently shedding value. Its robust balance sheet and operational discipline make it a reliable engine of cash flow. A point of vigilance remains its premium valuation and modest asset turnover. It suits portfolios targeting disciplined, long-term growth with moderate risk tolerance.
Mesa Laboratories (MLAB) presents a strategic moat in its niche with promising revenue growth and strong gross margins. However, it struggles with value destruction and financial fragility, reflected in weak liquidity and profitability metrics. Compared to TDY, MLAB offers higher growth potential but with significantly elevated risk. It fits investors inclined toward speculative growth plays with a tolerance for volatility.
If you prioritize stable capital efficiency and consistent cash generation, Teledyne outshines as the compelling choice due to its improving profitability and solid financial footing. However, if you seek aggressive growth and can accept heightened risk, Mesa Laboratories offers superior top-line expansion and niche exposure. Each represents a distinct analytical scenario aligned with different investor risk profiles and time horizons.
Disclaimer: Investment carries a risk of loss of initial capital. The past performance is not a reliable indicator of future results. Be sure to understand risks before making an investment decision.
Go Further
I encourage you to read the complete analyses of Teledyne Technologies Incorporated and Mesa Laboratories, Inc. to enhance your investment decisions: