Home > Comparison > Technology > TEL vs MLAB
The strategic rivalry between TE Connectivity Ltd. and Mesa Laboratories, Inc. shapes the competitive landscape of the technology sector’s hardware, equipment, and parts industry. TE Connectivity operates as a global industrial powerhouse with diversified connectivity and sensor solutions, while Mesa Laboratories focuses on specialized life sciences instrumentation and quality control products. This head-to-head pits scale and diversification against niche innovation. This analysis aims to identify the superior risk-adjusted trajectory for a balanced investment portfolio.
Table of contents
Companies Overview
TE Connectivity Ltd. and Mesa Laboratories, Inc. hold significant positions in the hardware and equipment sector with distinct market approaches.
TE Connectivity Ltd.: Global Leader in Connectivity Solutions
TE Connectivity Ltd. dominates as a manufacturer of connectivity and sensor solutions worldwide. It generates revenue through three segments: Transportation, Industrial, and Communications Solutions. In 2026, its strategic focus remains on expanding product innovation and global distribution across approximately 140 countries, emphasizing automotive, aerospace, and data communication markets.
Mesa Laboratories, Inc.: Specialist in Life Sciences Tools
Mesa Laboratories, Inc. excels in developing quality control and analytical tools for life sciences. Its revenue stems from four segments, including Sterilization Control and Clinical Genomics. The company sharpens its focus on automated protein analysis and genetic testing solutions in 2026, targeting healthcare, pharmaceutical, and research sectors primarily in the U.S. and internationally.
Strategic Collision: Similarities & Divergences
TE Connectivity pursues broad, diversified industrial applications with a global footprint, while Mesa Labs specializes in niche life sciences instrumentation. Their competition centers on precision hardware reliability and innovation. TE Connectivity offers scale and product breadth, contrasting with Mesa’s focused clinical and calibration technology. These differences shape distinct risk and growth profiles for investors.
Income Statement Comparison
This data dissects the core profitability and scalability of both corporate engines to reveal who dominates the bottom line:
| Metric | TE Connectivity Ltd. (TEL) | Mesa Laboratories, Inc. (MLAB) |
|---|---|---|
| Revenue | 17B | 241M |
| Cost of Revenue | 11.2B | 90.1M |
| Operating Expenses | 2.7B | 135M |
| Gross Profit | 5.9B | 151M |
| EBITDA | 4.1B | 42.3M |
| EBIT | 3.3B | 17.8M |
| Interest Expense | 77M | 11.9M |
| Net Income | 1.8B | -2M |
| EPS | 6.2 | -0.36 |
| Fiscal Year | 2025 | 2025 |
Income Statement Analysis: The Bottom-Line Duel
This income statement comparison reveals which company operates with superior efficiency and sustainable profit generation.
TE Connectivity Ltd. Analysis
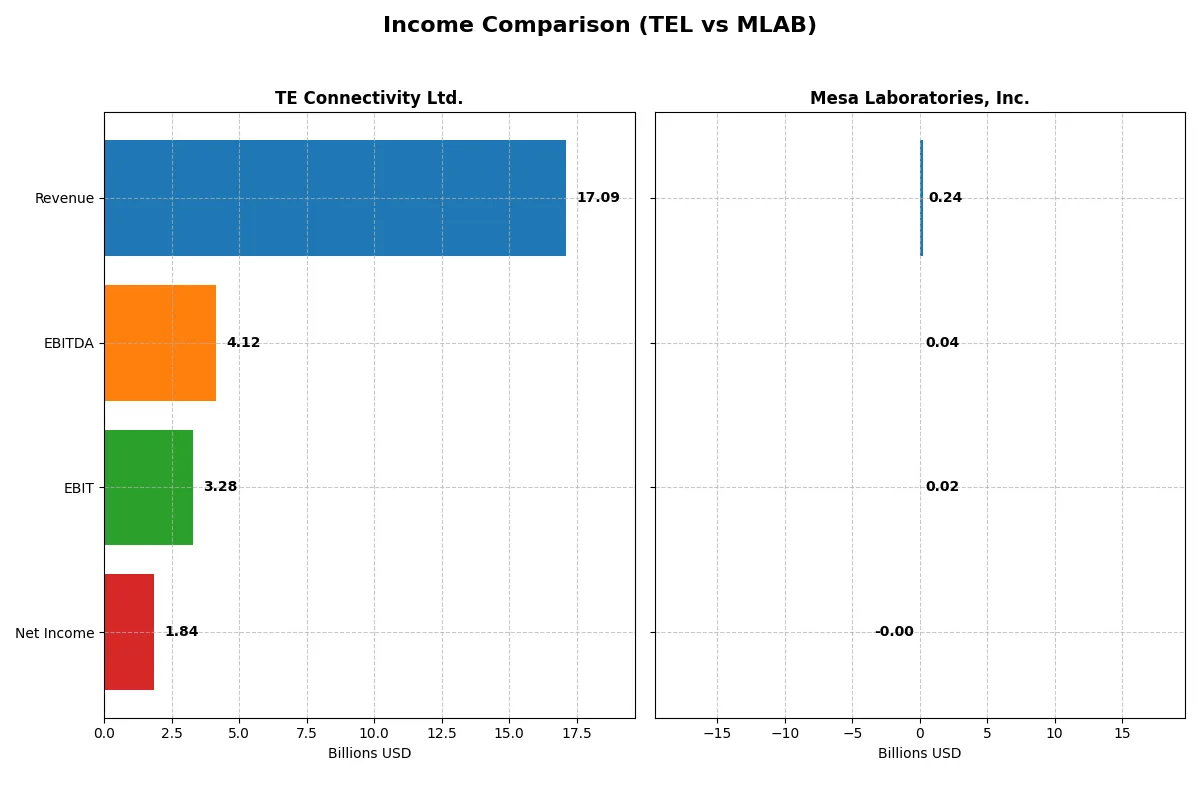
TE Connectivity’s revenue rose steadily from $14.9B in 2021 to $17.1B in 2025, reflecting solid top-line momentum. Gross margin remains healthy near 34.6%, while net margin sits at 10.8%, indicating efficient cost control. Despite a 7.9% revenue growth last year, net income declined sharply to $1.84B in 2025, signaling margin pressure and earnings volatility.
Mesa Laboratories, Inc. Analysis
Mesa Laboratories grew revenue from $134M in 2021 to $241M in 2025, showing robust expansion. The company boasts a strong gross margin of 62.6%, but net margin turned negative at -0.8% in the latest year. After a severe net loss in 2024, Mesa returned to near breakeven with a slight net loss of $2M in 2025, reflecting improving but still fragile profitability.
Revenue Scale vs. Margin Resilience
TE Connectivity delivers scale and consistent gross and net margins but faces recent net income headwinds despite revenue growth. Mesa Laboratories shows impressive revenue growth and gross margin strength but struggles to convert this into positive net profits. TE’s profile suits investors favoring established scale and margin stability, while Mesa appeals to those targeting growth with turnaround risks.
Financial Ratios Comparison
These vital ratios act as a diagnostic tool to expose the underlying fiscal health, valuation premiums, and capital efficiency of the companies analyzed:
| Ratios | TE Connectivity Ltd. (TEL) | Mesa Laboratories, Inc. (MLAB) |
|---|---|---|
| ROE | 14.6% | -1.2% |
| ROIC | 8.8% | -1.4% |
| P/E | 35.0 | -326.3 |
| P/B | 5.12 | 4.03 |
| Current Ratio | 1.56 | 0.63 |
| Quick Ratio | 1.03 | 0.47 |
| D/E | 0.52 | 1.14 |
| Debt-to-Assets | 26.1% | 41.9% |
| Interest Coverage | 41.7 | 1.38 |
| Asset Turnover | 0.68 | 0.56 |
| Fixed Asset Turnover | 3.96 | 7.45 |
| Payout ratio | 43.6% | -175.7% |
| Dividend yield | 1.25% | 0.54% |
| Fiscal Year | 2025 | 2025 |
Efficiency & Valuation Duel: The Vital Signs
Financial ratios act as a company’s DNA, unveiling hidden risks and its true operational strength beyond surface metrics.
TE Connectivity Ltd.
TE Connectivity delivers a solid 14.6% ROE and a healthy 10.8% net margin, reflecting operational efficiency. However, its P/E of 35 signals a stretched valuation compared to the sector. The company balances shareholder returns with a 1.25% dividend yield, indicating moderate cash return alongside steady reinvestment in R&D at 4.85% of revenue.
Mesa Laboratories, Inc.
Mesa Laboratories faces profitability challenges with negative ROE and net margin, signaling operational weakness. Despite a low P/E ratio, this reflects losses rather than value. The company shows limited shareholder returns, with a 0.54% dividend yield and a high debt load, raising concerns over financial stability and growth funding via R&D at 8.1% of revenue.
Premium Valuation vs. Operational Fragility
TE Connectivity offers a better balance of profitability and risk despite a high valuation. Mesa’s unfavorable profitability and financial metrics suggest caution. Investors seeking operational stability may prefer TE, while those targeting speculative turnaround potential might consider Mesa with heightened risk.
Which one offers the Superior Shareholder Reward?
I compare TE Connectivity Ltd. (TEL) and Mesa Laboratories, Inc. (MLAB) on dividend yield, payout ratios, and buyback intensity. TEL offers a 1.25% dividend yield with a sustainable 44% payout, covered 2.4x by free cash flow. Its steady buybacks complement returns. MLAB’s yield is only 0.54%, with a negative payout ratio reflecting losses, yet it reinvests heavily in growth. TEL’s consistent dividends and buybacks provide a more reliable, long-term total return. I conclude TEL offers superior shareholder reward in 2026.
Comparative Score Analysis: The Strategic Profile
The radar chart reveals the fundamental DNA and trade-offs of TE Connectivity Ltd. and Mesa Laboratories, Inc.:
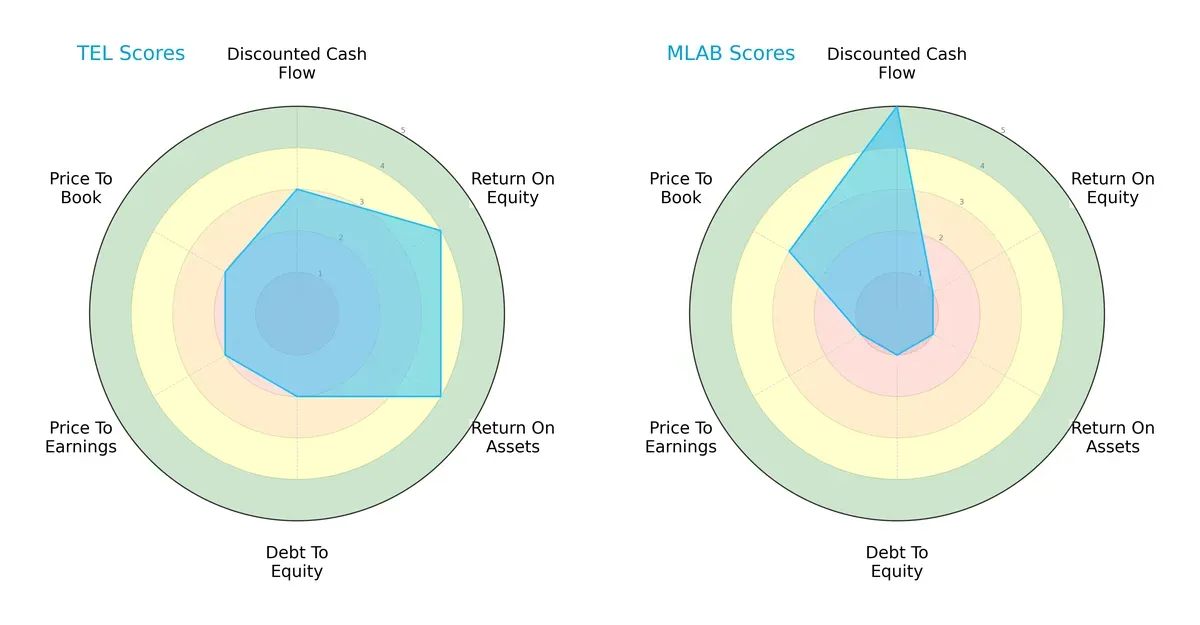
TE Connectivity delivers a more balanced profile with solid ROE (4) and ROA (4) scores, indicating efficient profit and asset use. Mesa Laboratories excels in discounted cash flow (5) but lags significantly in profitability (ROE 1, ROA 1) and financial stability (Debt/Equity 1). TE relies on operational strength, while Mesa’s edge is valuation potential with a moderate price-to-book score (3).
Bankruptcy Risk: Solvency Showdown
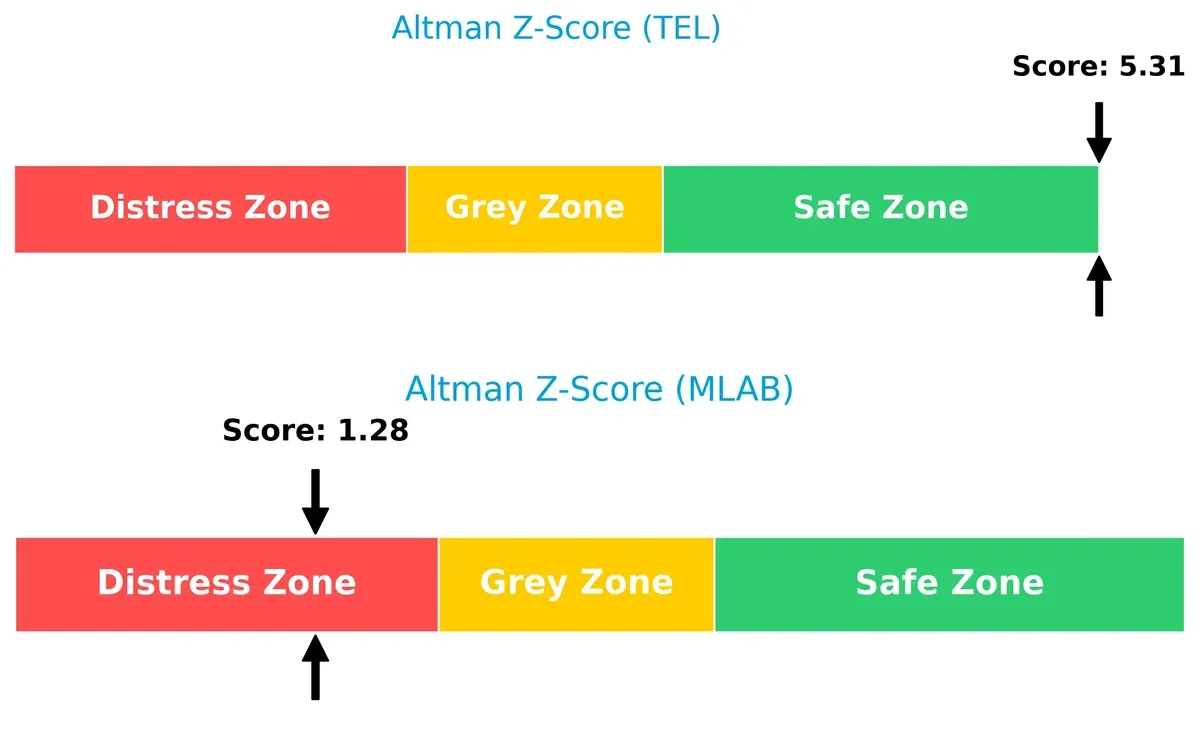
TE Connectivity’s Altman Z-Score of 5.3 signals robust financial health, while Mesa Laboratories’ 1.3 indicates distress risk, implying a stark contrast in long-term survival prospects in this cycle:
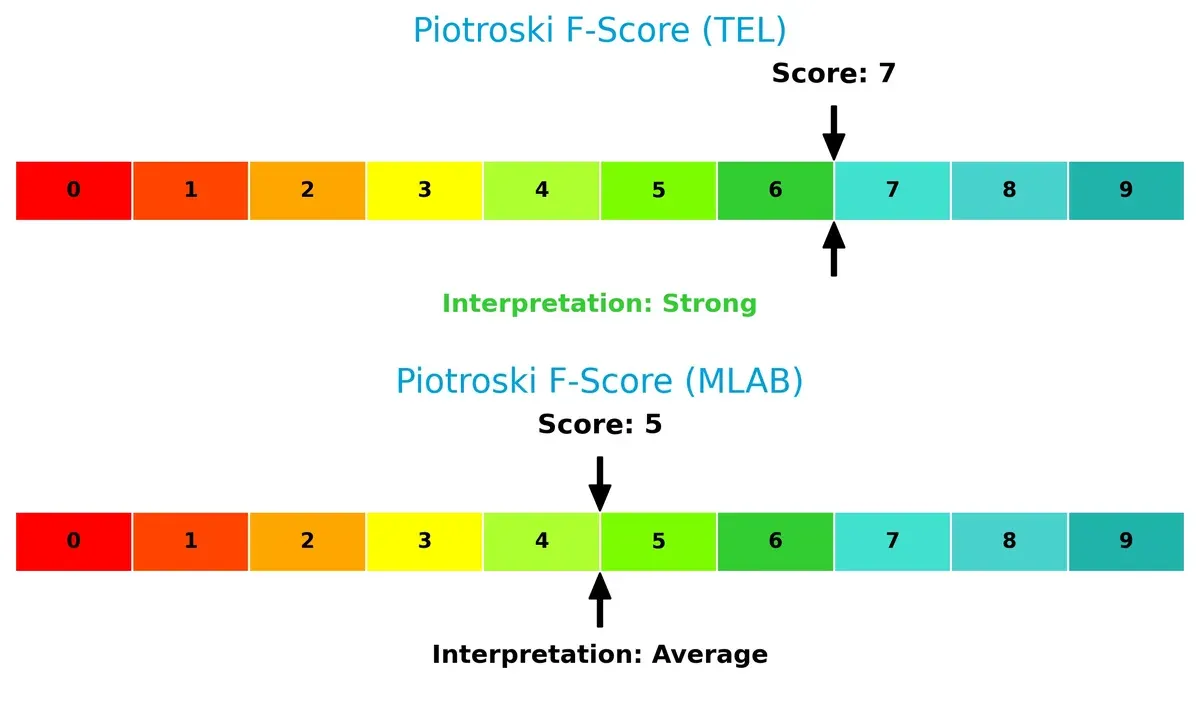
Financial Health: Quality of Operations
TE Connectivity scores a strong 7 on the Piotroski F-Score, reflecting solid internal metrics and operational quality. Mesa Laboratories’ 5 suggests average financial health with noticeable room for improvement:
How are the two companies positioned?
This section dissects TEL and MLAB’s operational DNA by comparing their revenue distribution and internal dynamics. The goal is to confront their economic moats and identify which model provides the most resilient competitive advantage today.
Revenue Segmentation: The Strategic Mix
This visual comparison dissects how TE Connectivity Ltd. and Mesa Laboratories, Inc. diversify their income streams and reveals where their primary sector bets lie:
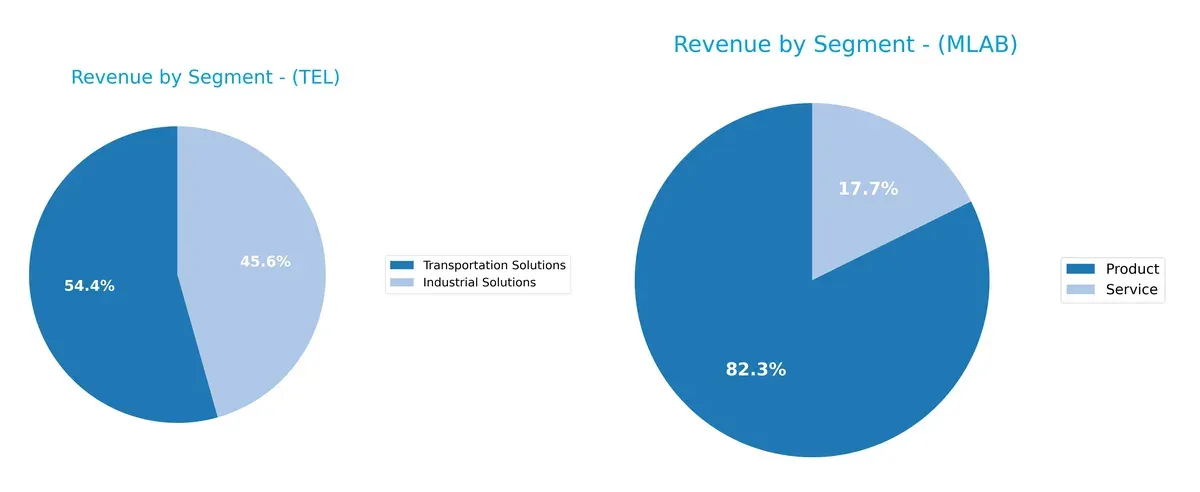
TE Connectivity leans heavily on Transportation Solutions at $9.4B and Industrial Solutions at $7.9B, showing moderate diversification within industrial markets. Mesa Laboratories pivots around a dominant Product segment at $198M, with Services trailing at $43M, indicating higher concentration risk. TE’s broader mix supports resilience and infrastructure dominance, while Mesa’s focus demands vigilance on product innovation and market shifts.
Strengths and Weaknesses Comparison
This table compares the Strengths and Weaknesses of TE Connectivity Ltd. and Mesa Laboratories, Inc.:
TEL Strengths
- Diversified revenue across Industrial and Transportation Solutions
- Favorable net margin of 10.78%
- Strong current and quick ratios over 1.0
- Low debt-to-assets ratio at 26.12%
- High interest coverage of 42.61
- Solid fixed asset turnover at 3.96
MLAB Strengths
- Favorable weighted average cost of capital at 6.62%
- Favorable PE ratio despite negative earnings
- Strong fixed asset turnover at 7.45
TEL Weaknesses
- Unfavorable high PE of 35.0 and PB of 5.12
- Neutral ROIC below WACC at 8.82% vs 9.1%
- Neutral asset turnover at 0.68
- Neutral ROE at 14.64%
- No explicit innovation or global presence noted
MLAB Weaknesses
- Negative net margin, ROE, and ROIC indicating unprofitability
- Unfavorable current and quick ratios below 1.0
- High debt-to-equity ratio of 1.14
- Low interest coverage at 1.5
- Unfavorable dividend yield of 0.54%
- Limited geographic diversification mostly US concentrated
TEL shows strengths in diversification and financial health with solid profitability metrics. MLAB exhibits operational efficiency in fixed assets but struggles with profitability and liquidity. These factors highlight TEL’s broader market footprint and financial stability versus MLAB’s tighter focus and financial challenges.
The Moat Duel: Analyzing Competitive Defensibility
A structural moat is the only reliable barrier protecting long-term profits from relentless competition erosion. Let’s dissect the moats of two tech hardware firms:
TE Connectivity Ltd.: Engineering a Cost Advantage Moat
TE Connectivity leverages a cost advantage moat rooted in global scale and diversified industrial reach. Its stable 19.2% EBIT margin reflects operational efficiency. In 2026, expanding sensor solutions in automotive and aerospace could deepen this moat, but margin pressures loom amid raw material costs.
Mesa Laboratories, Inc.: Specialized Intangible Assets Moat
Mesa’s moat stems from specialized intangible assets—patented life science tools and calibration tech. Unlike TE’s scale, Mesa’s niche focus drives a high 62.6% gross margin but a modest 7.4% EBIT margin signals tighter overall profitability. Growth in clinical genomics could disrupt its moat if competitors innovate rapidly.
Scale Efficiency vs. Niche Specialization: Who Defends Better?
TE Connectivity’s wider moat arises from scale and cost leadership, offering resilient margin stability across global markets. Mesa’s moat, while profitable in niches, faces higher disruption risk and weaker capital efficiency. TE is better positioned to defend market share amid 2026’s competitive headwinds.
Which stock offers better returns?
The past year reveals striking divergence: TE Connectivity surged over 63%, though momentum slowed recently. Mesa Laboratories dropped 20%, yet its recent rebound signals accelerating recovery.
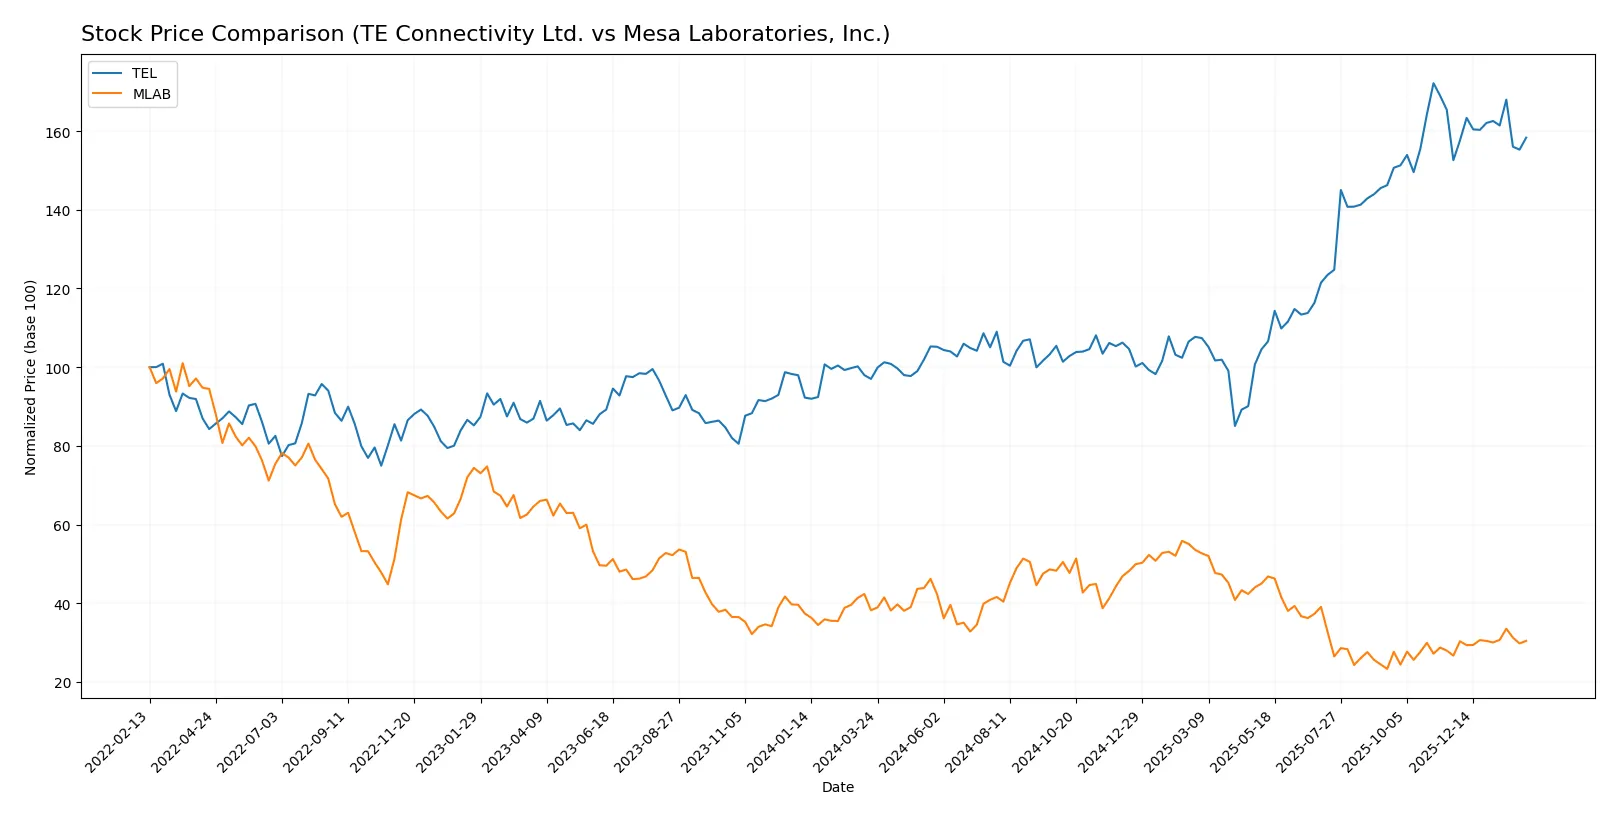
Trend Comparison
TE Connectivity’s stock gained 63.22% over 12 months, showing a bullish trend with decelerating momentum and high volatility (std dev 34.58). The price ranged from 122.0 to 247.01.
Mesa Laboratories declined 20.36% over the same period, marking a bearish trend despite accelerating recovery recently. Volatility is moderate (std dev 23.58), with prices between 61.66 and 147.79.
TE Connectivity outperformed Mesa Laboratories, delivering the highest market return with a strong yearlong rally despite recent deceleration.
Target Prices
Analysts present a confident target consensus for TE Connectivity Ltd. and Mesa Laboratories, Inc.
| Company | Target Low | Target High | Consensus |
|---|---|---|---|
| TE Connectivity Ltd. | 238 | 306 | 270.29 |
| Mesa Laboratories, Inc. | 83 | 83 | 83 |
TE Connectivity’s target consensus at 270.29 exceeds its current price of 227.13, suggesting upside potential. Mesa Laboratories’ consensus of 83 slightly surpasses its current 80.5, indicating modest growth expectations.

Don’t Let Luck Decide Your Entry Point
Optimize your entry points with our advanced ProRealTime indicators. You’ll get efficient buy signals with precise price targets for maximum performance. Start outperforming now!
How do institutions grade them?
TE Connectivity Ltd. Grades
Here are the recent institutional grades and actions on TE Connectivity Ltd.:
| Grading Company | Action | New Grade | Date |
|---|---|---|---|
| Oppenheimer | Upgrade | Outperform | 2026-01-27 |
| Barclays | Maintain | Overweight | 2026-01-23 |
| Truist Securities | Maintain | Hold | 2026-01-22 |
| Wells Fargo | Maintain | Equal Weight | 2026-01-22 |
| UBS | Maintain | Buy | 2026-01-14 |
| Truist Securities | Maintain | Hold | 2025-12-19 |
| Wells Fargo | Maintain | Equal Weight | 2025-12-09 |
| Truist Securities | Maintain | Hold | 2025-11-21 |
| Barclays | Maintain | Overweight | 2025-11-21 |
| TD Cowen | Maintain | Buy | 2025-11-17 |
Mesa Laboratories, Inc. Grades
Presented below are the latest institutional grades and actions on Mesa Laboratories, Inc.:
| Grading Company | Action | New Grade | Date |
|---|---|---|---|
| Wells Fargo | Maintain | Equal Weight | 2025-12-15 |
| Wells Fargo | Upgrade | Equal Weight | 2025-08-08 |
| Wells Fargo | Maintain | Underweight | 2025-05-30 |
| Evercore ISI Group | Maintain | Outperform | 2024-10-01 |
| Evercore ISI Group | Maintain | Outperform | 2024-08-06 |
| Evercore ISI Group | Maintain | Outperform | 2024-07-02 |
| Evercore ISI Group | Maintain | Outperform | 2024-04-04 |
| Evercore ISI Group | Upgrade | Outperform | 2024-01-04 |
| Evercore ISI Group | Downgrade | In Line | 2021-01-04 |
| Evercore ISI Group | Downgrade | In Line | 2021-01-03 |
Which company has the best grades?
TE Connectivity Ltd. holds stronger recent grades, including upgrades to Outperform and Buy by respected firms. Mesa Laboratories, Inc. shows consistent Outperform ratings but lacks recent upgrades. Investors may view TE Connectivity’s more frequent positive revisions as a sign of stronger institutional confidence.
Risks specific to each company
The following categories identify critical pressure points and systemic threats facing TE Connectivity Ltd. and Mesa Laboratories, Inc. in the 2026 market environment:
1. Market & Competition
TE Connectivity Ltd.
- Operates globally in diversified sectors; faces intense competition in connectivity and sensor markets.
Mesa Laboratories, Inc.
- Focuses on niche life sciences tools and quality control; smaller scale limits competitive leverage.
2. Capital Structure & Debt
TE Connectivity Ltd.
- Moderate debt-to-equity of 0.52; strong interest coverage at 42.6x reduces refinancing risk.
Mesa Laboratories, Inc.
- High debt-to-equity of 1.14; weak interest coverage at 1.5x signals financial strain.
3. Stock Volatility
TE Connectivity Ltd.
- Beta at 1.24 indicates above-market volatility but within industry norms.
Mesa Laboratories, Inc.
- Lower beta at 0.89 suggests less price sensitivity but potential liquidity concerns.
4. Regulatory & Legal
TE Connectivity Ltd.
- Exposure to regulation across automotive, aerospace, and communication sectors globally.
Mesa Laboratories, Inc.
- Faces regulatory scrutiny in life sciences and healthcare markets, with compliance complexity.
5. Supply Chain & Operations
TE Connectivity Ltd.
- Large scale global supply chain with inherent risks but diversified sourcing.
Mesa Laboratories, Inc.
- Smaller scale supply chain; potential vulnerabilities to disruptions and supplier concentration.
6. ESG & Climate Transition
TE Connectivity Ltd.
- Industry pressure to innovate sustainable products; ESG initiatives critical for client retention.
Mesa Laboratories, Inc.
- ESG risks less publicized but regulatory pressure in healthcare sector rising.
7. Geopolitical Exposure
TE Connectivity Ltd.
- Operations spread across Europe, Americas, and Asia; exposed to trade tensions and currency risks.
Mesa Laboratories, Inc.
- Primarily US-based but with international sales; moderate geopolitical risk.
Which company shows a better risk-adjusted profile?
TE Connectivity’s strongest risk is market competition amid global supply chain complexities, but its robust capital structure and financial health provide resilience. Mesa Laboratories faces critical financial distress risk, with weak liquidity and high leverage undermining stability. TE’s safer Altman Z-score (5.3) versus Mesa’s distress zone score (1.3) confirms TE’s superior risk-adjusted profile. The recent sharp contrast in interest coverage ratios highlights Mesa’s vulnerability to rising borrowing costs, intensifying risk concerns.
Final Verdict: Which stock to choose?
TE Connectivity’s superpower lies in its resilient cash flow generation and operational efficiency. It balances growth with solid financial health, making its high valuation a point of vigilance. This stock suits portfolios aiming for steady, industrial growth with moderate risk tolerance.
Mesa Laboratories boasts a niche moat through specialized products and consistent revenue growth, despite struggling profitability and balance sheet stress. Its recent price recovery offers a speculative edge for investors prioritizing turnaround stories and value traps in small-cap arenas.
If you prioritize stable cash generation and operational discipline, TE Connectivity outshines due to superior balance sheet strength and cash flow resilience. However, if you seek aggressive growth potential with a higher risk appetite, Mesa Laboratories offers better upside from its recovery trajectory despite financial vulnerabilities.
Disclaimer: Investment carries a risk of loss of initial capital. The past performance is not a reliable indicator of future results. Be sure to understand risks before making an investment decision.
Go Further
I encourage you to read the complete analyses of TE Connectivity Ltd. and Mesa Laboratories, Inc. to enhance your investment decisions: