Home > Comparison > Technology > SANM vs MLAB
The strategic rivalry between Sanmina Corporation and Mesa Laboratories defines a critical juncture in the Technology sector’s Hardware, Equipment & Parts industry. Sanmina operates as a capital-intensive integrated manufacturing powerhouse, while Mesa focuses on niche life sciences tools with high-margin quality control products. This analysis pits scale and diversification against specialized innovation to reveal which trajectory offers superior risk-adjusted returns for a diversified portfolio in 2026.
Table of contents
Companies Overview
Sanmina and Mesa Laboratories both hold critical roles in the hardware and equipment sector, influencing industrial and life sciences markets.
Sanmina Corporation: Global Integrated Manufacturing Leader
Sanmina dominates as a provider of integrated manufacturing solutions. Its revenue stems from manufacturing components, assemblies, and systems, combined with product design, logistics, and after-market services. In 2026, Sanmina emphasizes expanding its cloud-based manufacturing execution software, targeting industrial, medical, and aerospace OEMs.
Mesa Laboratories, Inc.: Precision Life Sciences Innovator
Mesa Laboratories specializes in life sciences tools and quality control products. Its core revenue comes from sterilization indicators, biopharmaceutical development systems, and calibration solutions. In 2026, Mesa focuses on advancing its clinical genomics segment, developing genetic analysis tools for clinical labs across therapeutic areas.
Strategic Collision: Similarities & Divergences
Sanmina pursues a broad, integrated manufacturing ecosystem, while Mesa targets niche life sciences instrumentation. Their battleground lies in high-tech equipment servicing specialized industries. Sanmina offers scale and diversity; Mesa delivers precision and innovation—each presents a distinct risk-reward profile aligned with their unique market focus.
Income Statement Comparison
The data below dissects the core profitability and scalability of both corporate engines to reveal who dominates the bottom line:
| Metric | Sanmina Corporation (SANM) | Mesa Laboratories, Inc. (MLAB) |
|---|---|---|
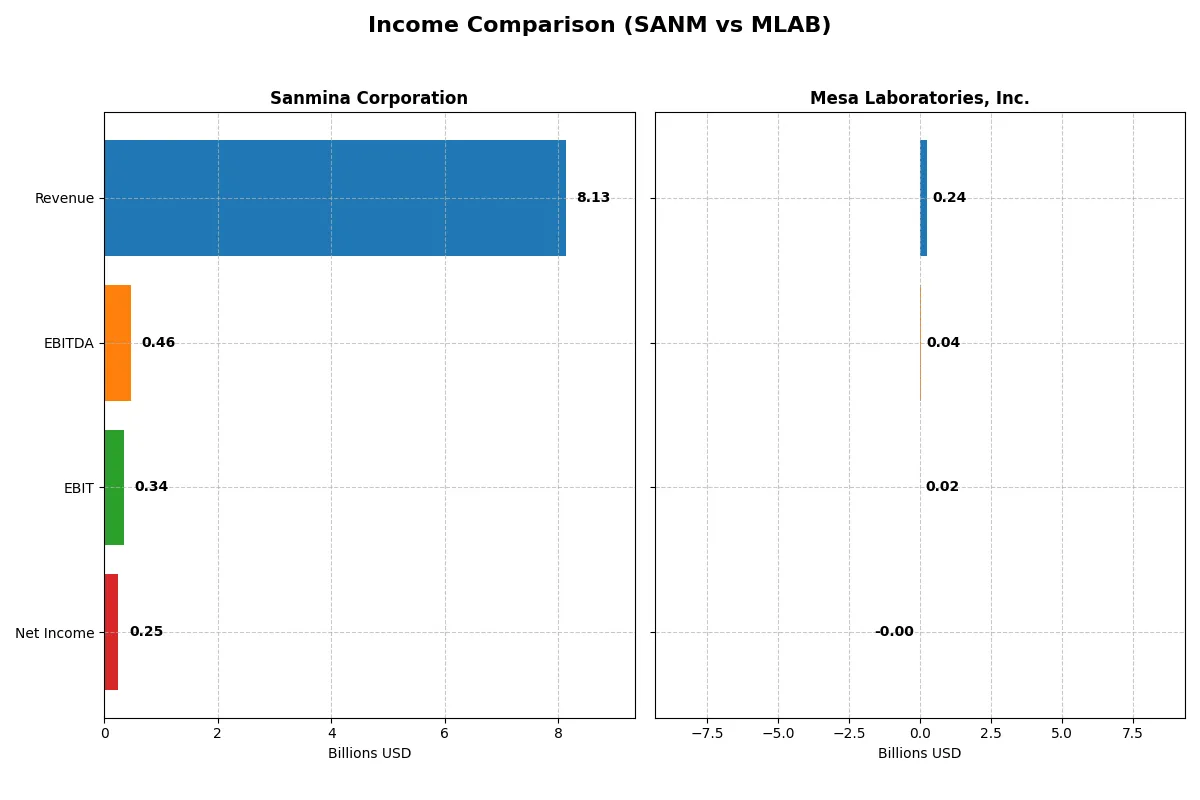
| Revenue | 8.13B | 241M |
| Cost of Revenue | 7.41B | 90.1M |
| Operating Expenses | 362M | 135M |
| Gross Profit | 716M | 151M |
| EBITDA | 463M | 42.3M |
| EBIT | 344M | 17.8M |
| Interest Expense | 4.3M | 11.9M |
| Net Income | 246M | -1.97M |
| EPS | 4.56 | -0.36 |
| Fiscal Year | 2025 | 2025 |
Income Statement Analysis: The Bottom-Line Duel
This income statement comparison reveals how efficiently each company converts revenue into profit amid changing market conditions.
Sanmina Corporation Analysis
Sanmina’s revenue grew steadily by 7.4% in 2025, reaching $8.13B, while net income rose modestly to $246M. Gross margin holds neutral at 8.8%, and net margin remains stable near 3%. Despite slight EBIT decline, EPS improved by 14%, signaling cautious but consistent operational efficiency.
Mesa Laboratories, Inc. Analysis
Mesa Laboratories showed a strong 11.5% revenue increase to $241M in 2025, yet net income stayed negative at -$2M. Its gross margin is robust at 62.6%, reflecting efficient cost control, but net margin remains unfavorable at -0.8%. However, double-digit EBIT and EPS growth indicate a potential turnaround underway.
Margin Stability vs. Growth Ambition
Sanmina delivers stable margins and modest profit growth on a large revenue base, whereas Mesa excels in margin expansion but struggles to translate it into net profits. Sanmina’s profile suits investors favoring steady returns, while Mesa appeals to those willing to risk losses for growth potential.
Financial Ratios Comparison
These vital ratios act as a diagnostic tool to expose the underlying fiscal health, valuation premiums, and capital efficiency of the companies presented below:
| Ratios | Sanmina Corporation (SANM) | Mesa Laboratories, Inc. (MLAB) |
|---|---|---|
| ROE | 10.4% | -1.24% |
| ROIC | 9.04% | -1.45% |
| P/E | 25.6 | -326.3 |
| P/B | 2.67 | 4.03 |
| Current Ratio | 1.72 | 0.63 |
| Quick Ratio | 1.02 | 0.47 |
| D/E | 0.17 | 1.14 |
| Debt-to-Assets | 6.7% | 41.9% |
| Interest Coverage | 82.5 | 1.38 |
| Asset Turnover | 1.39 | 0.56 |
| Fixed Asset Turnover | 11.9 | 7.45 |
| Payout ratio | 0 | -176.7% |
| Dividend yield | 0 | 0.54% |
| Fiscal Year | 2025 | 2025 |
Efficiency & Valuation Duel: The Vital Signs
Ratios act as a company’s DNA, revealing hidden risks and operational excellence that raw numbers alone cannot capture.
Sanmina Corporation
Sanmina delivers a neutral ROE of 10.45% and a modest net margin of 3.03%, signaling average profitability. Its P/E of 25.59 suggests the stock is somewhat expensive relative to earnings. The firm maintains a strong current ratio of 1.72 and minimal debt, supporting operational stability. Sanmina pays no dividend, instead reinvesting in R&D to fuel growth.
Mesa Laboratories, Inc.
Mesa Laboratories shows weak profitability, with negative ROE at -1.24% and a net margin of -0.82%, reflecting operational challenges. Despite a favorable negative P/E due to losses, its P/B ratio of 4.03 and low liquidity ratios indicate a stretched financial position. The company offers a small dividend yield but struggles with high debt and poor interest coverage.
Balanced Operational Strength vs. Financial Strain
Sanmina offers a better risk-reward balance, combining operational efficiency with prudent leverage and reinvestment strategies. Mesa’s financial strain and negative returns pose significant risks despite a low earnings multiple. Investors prioritizing stability and steady growth will find Sanmina’s profile more appealing.
Which one offers the Superior Shareholder Reward?
Sanmina Corporation (SANM) and Mesa Laboratories, Inc. (MLAB) follow contrasting shareholder reward strategies. SANM pays no dividends but generates solid free cash flow (8.6/share in 2025) and reinvests through moderate capex, with no payout strain. Its buybacks are modest but sustainable given a stable current ratio (~1.7) and low leverage (debt/equity ~0.17). MLAB, by contrast, pays a small dividend yield (~0.54%) but suffers negative net income (-0.36/share in 2025) and weak profitability, relying heavily on debt (debt/equity >1) to fund dividends and buybacks. MLAB’s free cash flow is strong but overshadowed by financial risk and uneven cash coverage. I see SANM’s no-dividend, cash-flow-focused buyback model as more sustainable and offering superior total return potential in 2026.
Comparative Score Analysis: The Strategic Profile
The radar chart reveals the fundamental DNA and trade-offs of Sanmina Corporation and Mesa Laboratories, Inc., highlighting strategic strengths and vulnerabilities:
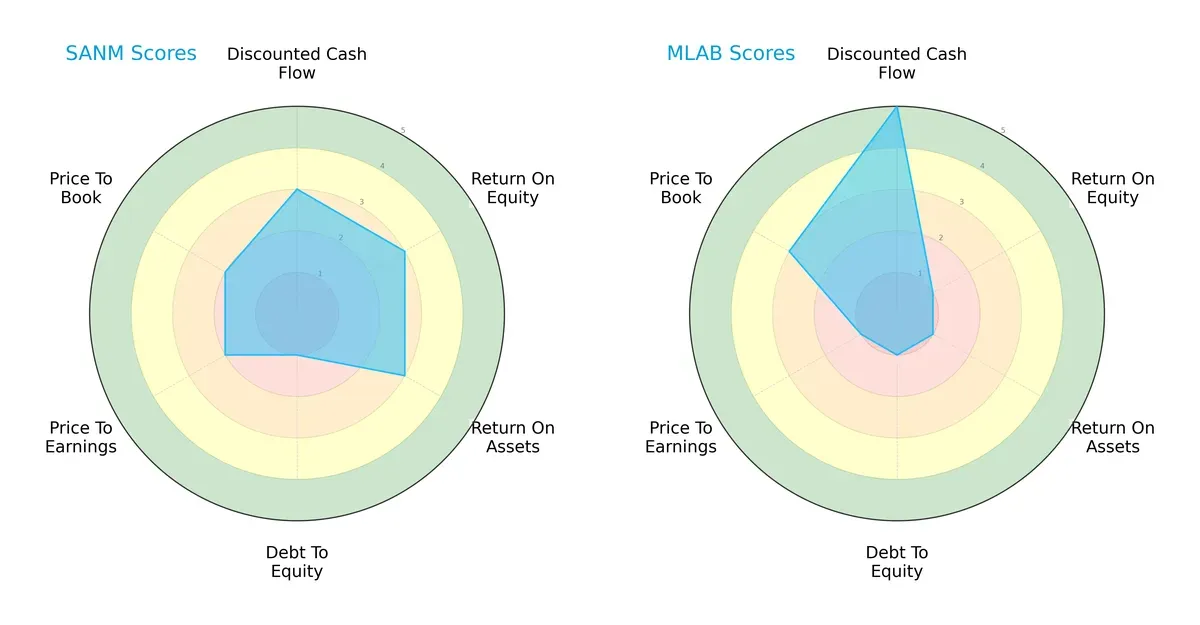
Sanmina shows a balanced profile with moderate scores in DCF (3), ROE (3), and ROA (3), but suffers from a weak debt-to-equity score (1). Mesa excels in discounted cash flow (5) and price-to-book (3) but struggles with profitability metrics like ROE (1) and ROA (1). Sanmina relies on operational efficiency, while Mesa depends heavily on valuation advantages.
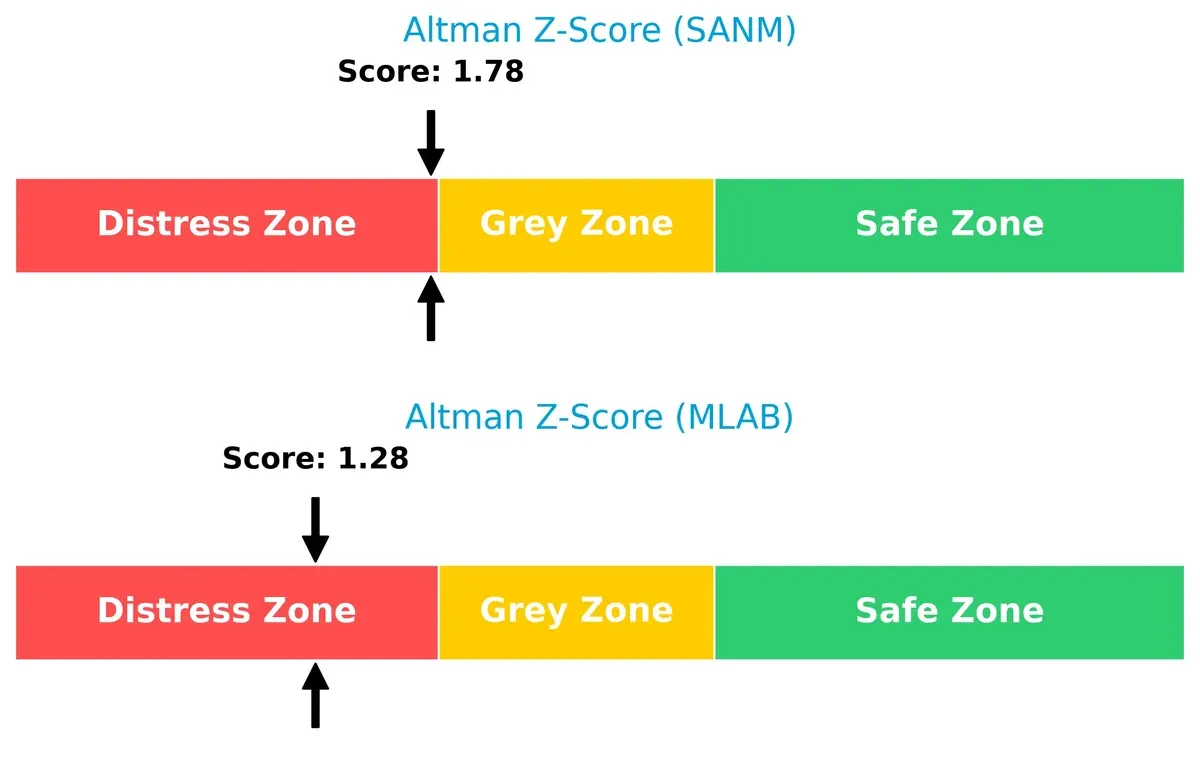
Bankruptcy Risk: Solvency Showdown
The Altman Z-Scores place both firms in the distress zone, with Sanmina at 1.78 and Mesa at 1.28, indicating elevated bankruptcy risk in this cycle:
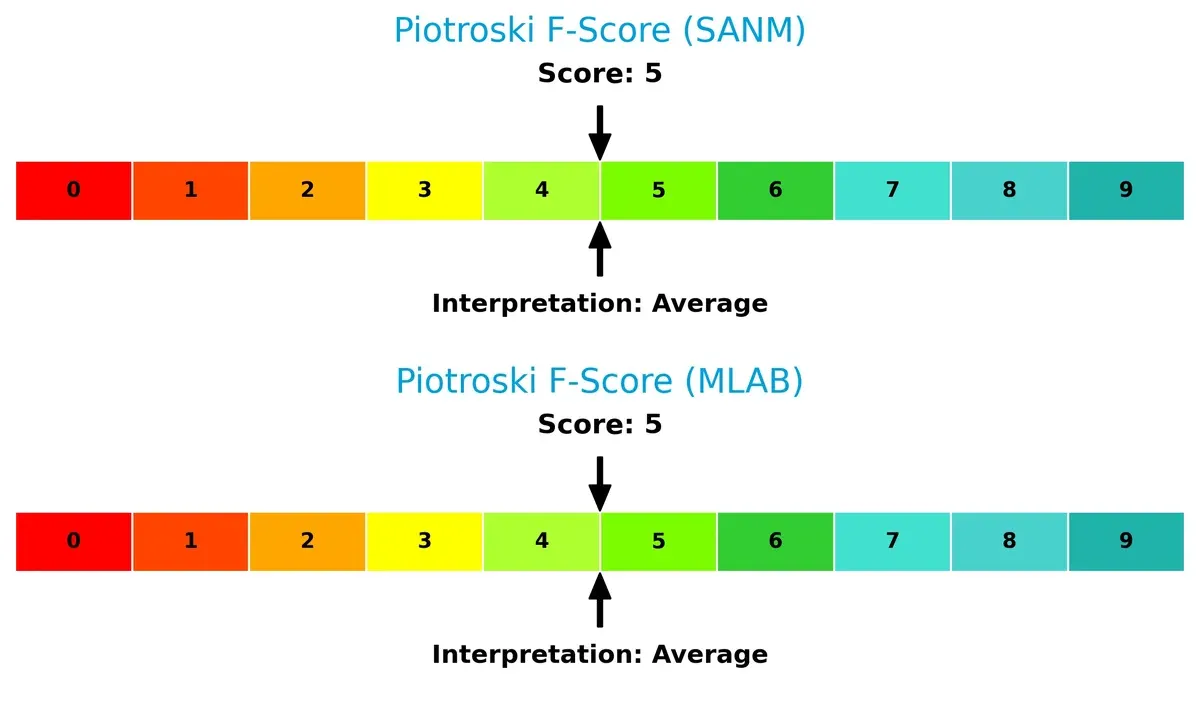
Financial Health: Quality of Operations
Both companies have identical Piotroski F-Scores of 5, reflecting average financial health, with no clear red flags dominating either firm’s internal metrics:
How are the two companies positioned?
This section dissects the operational DNA of Sanmina and Mesa by comparing their revenue distribution by segment alongside their internal strengths and weaknesses. The objective is to confront their economic moats to reveal which business model delivers the most resilient, sustainable competitive advantage today.
Revenue Segmentation: The Strategic Mix
This comparison dissects how Sanmina Corporation and Mesa Laboratories diversify their income streams and where their primary sector bets lie:
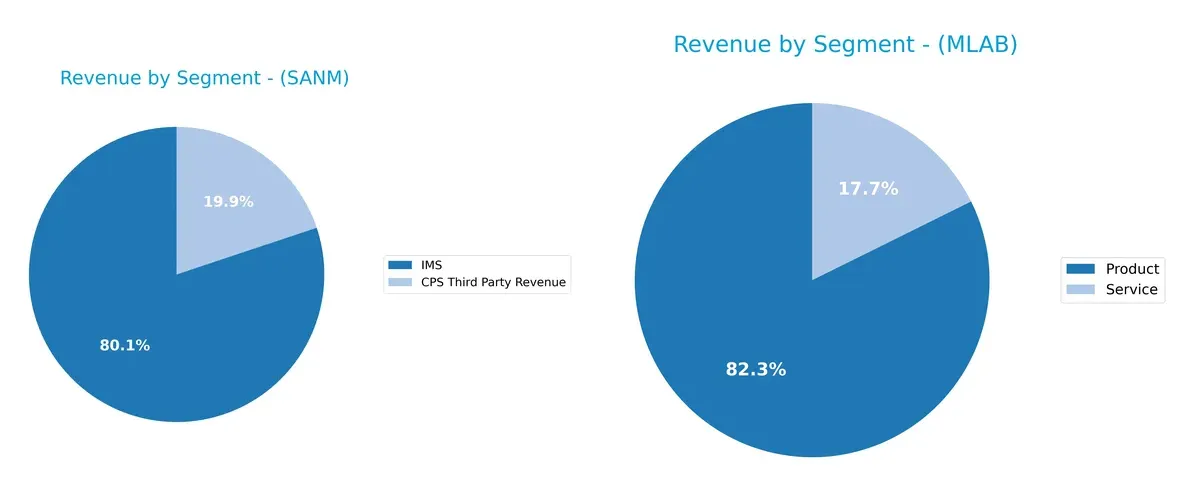
Sanmina anchors revenue in its IMS segment with $6.5B in 2025, dwarfing its $1.6B CPS Third Party revenue. This concentration underscores infrastructure dominance but raises concentration risk. Mesa Laboratories shows a more balanced mix, with $198M from Product and $43M from Service in 2025, indicating diversified exposure across biopharmaceutical and calibration solutions. Mesa’s diversification mitigates risk, while Sanmina’s focus may leverage scale and ecosystem lock-in.
Strengths and Weaknesses Comparison
This table compares the Strengths and Weaknesses of Sanmina Corporation and Mesa Laboratories, Inc.:
Sanmina Strengths
- Diversified revenue across CPS, IMS, and other segments
- Favorable liquidity ratios with current ratio at 1.72
- Low debt-to-equity of 0.17 indicating conservative leverage
- Strong asset and fixed asset turnover ratios
- Global presence with solid Americas and Asia Pacific sales
Mesa Laboratories Strengths
- Favorable WACC at 6.62% supports cost-efficient capital
- Fixed asset turnover strong at 7.45
- Presence in US and China markets
- Product and service revenue diversification
- Favorable P/E despite negative net margin
Sanmina Weaknesses
- Low net margin at 3.03% flagged as unfavorable
- P/E ratio at 25.59 considered high
- No dividend yield
- Neutral ROE and ROIC close to WACC
- Slightly unfavorable net margin and valuation metrics
Mesa Laboratories Weaknesses
- Negative net margin, ROE, and ROIC reflect profitability struggles
- Low current and quick ratios signal liquidity issues
- High debt-to-equity of 1.14 raises solvency concerns
- Low interest coverage ratio at 1.5 indicates risk
- Unfavorable P/B ratio and dividend yield
Sanmina’s strengths lie in liquidity, leverage, and asset efficiency supporting stable operations. Mesa faces significant profitability and liquidity challenges that could pressure strategic flexibility. These contrasts highlight differing financial health and operational risks.
The Moat Duel: Analyzing Competitive Defensibility
A structural moat is the only thing protecting long-term profits from the erosion of competition. Let’s dissect the competitive moats of Sanmina Corporation and Mesa Laboratories:
Sanmina Corporation: Integrated Manufacturing Scale Moat
Sanmina’s advantage lies in its cost efficiency and scale in integrated manufacturing solutions. This drives stable margins despite modest ROIC below WACC. Expansion into cloud-based manufacturing software could deepen its moat by enhancing customer lock-in in 2026.
Mesa Laboratories, Inc.: Specialized Niche Innovation Moat
Mesa’s moat stems from specialized life sciences tools and quality control products, yielding high gross margins but volatile net profitability. Its niche market focus limits scale but supports premium pricing. Innovation in genomics tools may unlock new growth avenues beyond 2026.
Verdict: Scale Efficiency vs. Niche Specialization
Sanmina’s broader manufacturing scale offers a wider moat, though its profitability trends are slightly unfavorable. Mesa’s niche innovation is sharper but financially more vulnerable. Sanmina appears better equipped to defend market share against competition in 2026.
Which stock offers better returns?
The past year reveals starkly contrasting dynamics: Sanmina Corporation surged 152%, albeit with decelerating momentum, while Mesa Laboratories, Inc. declined 20%, though showing recent acceleration.
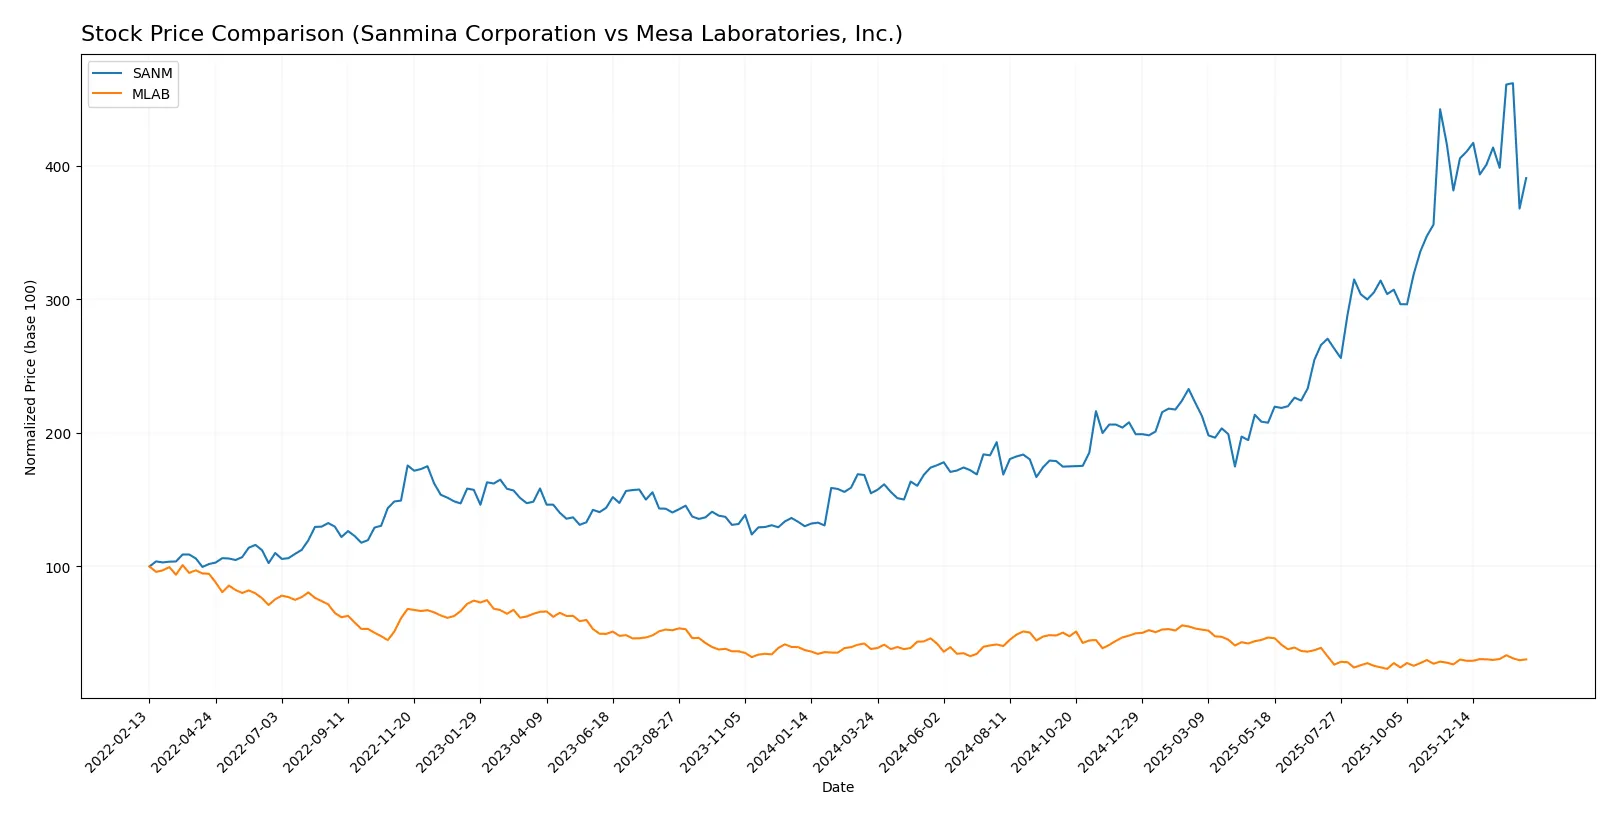
Trend Comparison
Sanmina Corporation’s stock rose 152.42% over the past year, marking a strong bullish trend with decelerating growth. It reached a high of 177.83 and a low of 57.79, reflecting significant volatility.
Mesa Laboratories, Inc. fell 20.36% over the same period, confirming a bearish trend with accelerating decline. Its price fluctuated between 61.66 and 147.79, showing notable but less extreme volatility.
Sanmina outperformed Mesa clearly, delivering strong positive returns against Mesa’s significant loss, despite recent partial recoveries in both stocks.
Target Prices
Analysts present a clear target consensus for both Sanmina Corporation and Mesa Laboratories, Inc.
| Company | Target Low | Target High | Consensus |
|---|---|---|---|
| Sanmina Corporation | 200 | 200 | 200 |
| Mesa Laboratories, Inc. | 83 | 83 | 83 |
Sanmina’s target price at $200 suggests a 33% upside from its current price near $150. Mesa Laboratories shows a modest 3% upside from $80.5, indicating limited near-term growth expectations.

Don’t Let Luck Decide Your Entry Point
Optimize your entry points with our advanced ProRealTime indicators. You’ll get efficient buy signals with precise price targets for maximum performance. Start outperforming now!
How do institutions grade them?
Sanmina Corporation Grades
The following table summarizes recent institutional grades for Sanmina Corporation.
| Grading Company | Action | New Grade | Date |
|---|---|---|---|
| Argus Research | Maintain | Buy | 2026-01-28 |
| B of A Securities | Maintain | Neutral | 2025-07-11 |
| B of A Securities | Maintain | Neutral | 2025-06-09 |
| B of A Securities | Upgrade | Neutral | 2025-01-29 |
| Craig-Hallum | Maintain | Hold | 2024-11-05 |
| Craig-Hallum | Downgrade | Hold | 2024-04-30 |
| Sidoti & Co. | Upgrade | Buy | 2022-11-08 |
| Sidoti & Co. | Upgrade | Buy | 2022-11-07 |
| Sidoti & Co. | Downgrade | Neutral | 2022-10-31 |
| Sidoti & Co. | Downgrade | Neutral | 2022-10-30 |
Mesa Laboratories, Inc. Grades
This table presents the recent institutional grades for Mesa Laboratories, Inc.
| Grading Company | Action | New Grade | Date |
|---|---|---|---|
| Wells Fargo | Maintain | Equal Weight | 2025-12-15 |
| Wells Fargo | Upgrade | Equal Weight | 2025-08-08 |
| Wells Fargo | Maintain | Underweight | 2025-05-30 |
| Evercore ISI Group | Maintain | Outperform | 2024-10-01 |
| Evercore ISI Group | Maintain | Outperform | 2024-08-06 |
| Evercore ISI Group | Maintain | Outperform | 2024-07-02 |
| Evercore ISI Group | Maintain | Outperform | 2024-04-04 |
| Evercore ISI Group | Upgrade | Outperform | 2024-01-04 |
| Evercore ISI Group | Downgrade | In Line | 2021-01-04 |
| Evercore ISI Group | Downgrade | In Line | 2021-01-03 |
Which company has the best grades?
Mesa Laboratories consistently earns Outperform ratings from Evercore ISI Group, indicating strong institutional confidence. Sanmina’s grades vary more, with recent Buy and Neutral ratings. This divergence may influence investor perceptions of growth versus stability.
Risks specific to each company
The following categories identify the critical pressure points and systemic threats facing both firms in the 2026 market environment:
1. Market & Competition
Sanmina Corporation
- Faces intense competition in diversified manufacturing sectors, requiring constant innovation to maintain market share.
Mesa Laboratories, Inc.
- Operates in niche life sciences tools, but struggles with market penetration and pricing pressure.
2. Capital Structure & Debt
Sanmina Corporation
- Maintains a low debt-to-equity ratio (0.17), signaling conservative leverage and financial stability.
Mesa Laboratories, Inc.
- Carries high debt-to-equity (1.14), increasing financial risk and interest burden.
3. Stock Volatility
Sanmina Corporation
- Beta near 1.03 indicates market-level volatility, typical for technology hardware firms.
Mesa Laboratories, Inc.
- Lower beta at 0.89 suggests less sensitivity to market swings but potential illiquidity risks.
4. Regulatory & Legal
Sanmina Corporation
- Exposed to complex regulations in defense, aerospace, and medical sectors, requiring stringent compliance.
Mesa Laboratories, Inc.
- Faces regulatory scrutiny in healthcare products and genetic testing, with evolving standards.
5. Supply Chain & Operations
Sanmina Corporation
- Benefits from global integrated manufacturing but vulnerable to component shortages and logistics disruptions.
Mesa Laboratories, Inc.
- Smaller scale limits supply chain complexity but heightens impact of supplier delays or failures.
6. ESG & Climate Transition
Sanmina Corporation
- Increasing pressure to meet sustainability targets across manufacturing footprint.
Mesa Laboratories, Inc.
- ESG initiatives less transparent; climate transition risks may affect regulatory costs.
7. Geopolitical Exposure
Sanmina Corporation
- Global operations expose it to geopolitical tensions, trade restrictions, and tariffs.
Mesa Laboratories, Inc.
- Primarily US-based with limited direct exposure but still affected by international regulatory changes.
Which company shows a better risk-adjusted profile?
Sanmina’s dominant risk lies in market competition but benefits from strong financial stability and manageable leverage. Mesa Laboratories faces critical capital structure risks, evidenced by high debt and weak profitability. Sanmina’s Altman Z-score near 1.78 versus Mesa’s 1.28 highlights its relatively safer financial footing. The stark contrast in debt-to-equity ratios and interest coverage further favors Sanmina. As of 2026, Sanmina’s robust asset turnover and liquidity ratios justify confidence amid sector challenges. Mesa’s persistent negative margins and weak coverage flag elevated distress risk. Overall, Sanmina offers a superior risk-adjusted profile for prudent investors.
Final Verdict: Which stock to choose?
Sanmina Corporation’s superpower lies in its consistent operational efficiency and solid balance sheet. Its ability to manage working capital and generate free cash flow stands out. A point of vigilance remains its slightly declining profitability margins. Sanmina suits portfolios targeting steady, moderate growth with manageable risks.
Mesa Laboratories commands a strategic moat through its specialized niche and strong gross margins. However, it carries financial fragility with weak liquidity and persistent losses, making it a riskier choice. Mesa fits investors seeking high-growth potential with tolerance for volatility and turnaround scenarios.
If you prioritize stable cash generation and capital discipline, Sanmina is the compelling choice due to its operational resilience and balance sheet strength. However, if you seek aggressive growth fueled by niche positioning and are prepared for financial headwinds, Mesa offers superior upside potential despite its risks. Each represents a distinct investor profile shaped by risk tolerance and growth expectations.
Disclaimer: Investment carries a risk of loss of initial capital. The past performance is not a reliable indicator of future results. Be sure to understand risks before making an investment decision.
Go Further
I encourage you to read the complete analyses of Sanmina Corporation and Mesa Laboratories, Inc. to enhance your investment decisions: