Home > Comparison > Technology > SNDK vs MLAB
The strategic rivalry between Sandisk Corporation and Mesa Laboratories, Inc. shapes the competitive dynamics within the Technology sector. Sandisk operates as a capital-intensive hardware manufacturer specializing in NAND flash storage solutions. Mesa Laboratories offers a diversified portfolio of life sciences tools and quality control products, emphasizing precision and innovation. This analysis will evaluate which company presents a superior risk-adjusted profile for a diversified portfolio amid evolving sector demands.
Table of contents
Companies Overview
Sandisk Corporation and Mesa Laboratories, Inc. stand as influential players in the hardware and technology sectors with distinct market footprints.
Sandisk Corporation: Pioneer in Flash Storage Solutions
Sandisk dominates the NAND flash technology market by developing, manufacturing, and selling solid-state drives, embedded products, and removable memory cards. Its revenue primarily stems from advanced storage devices. In 2026, Sandisk’s strategic focus remained on expanding its product portfolio and reinforcing its leadership in high-performance storage solutions for consumer and enterprise markets.
Mesa Laboratories, Inc.: Specialist in Life Sciences and Calibration Tools
Mesa Laboratories operates within the life sciences tools and quality control niche, generating revenue through sterilization indicators, protein analysis systems, and calibration equipment. Its diversified segments serve healthcare, pharmaceutical, and research industries. Mesa’s 2026 strategy centered on enhancing its clinical genomics capabilities while expanding automated peptide synthesizers and calibration solutions globally.
Strategic Collision: Similarities & Divergences
Sandisk and Mesa both innovate within hardware, but Sandisk pursues a high-volume, consumer-driven market, while Mesa targets specialized, regulated scientific equipment buyers. Their competition lies less in product overlap and more in technological precision and reliability. Investors face distinct profiles: Sandisk offers scale and volatility typical of tech giants, Mesa provides niche stability with steady growth potential in healthcare technology.
Income Statement Comparison
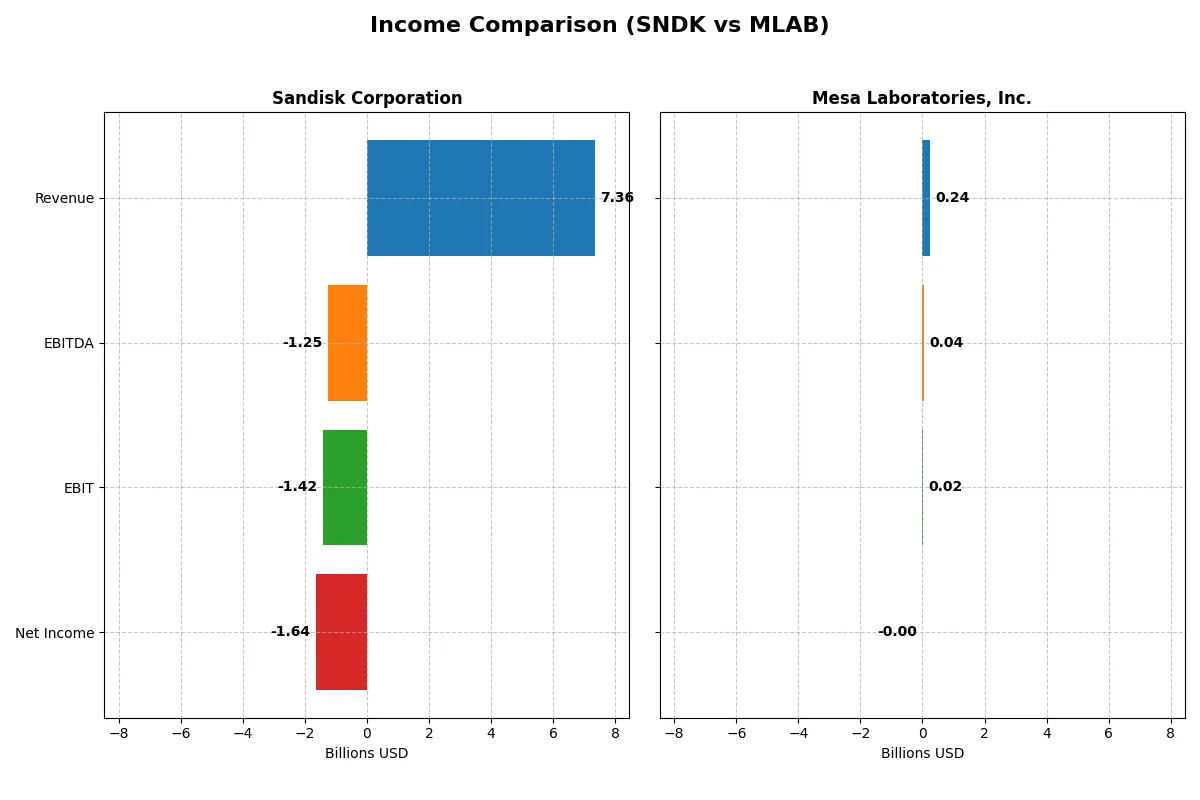
This table dissects the core profitability and scalability of both corporate engines to reveal who dominates the bottom line:
| Metric | Sandisk Corporation (SNDK) | Mesa Laboratories, Inc. (MLAB) |
|---|---|---|
| Revenue | 7.36B | 241M |
| Cost of Revenue | 5.14B | 90.1M |
| Operating Expenses | 3.59B | 135M |
| Gross Profit | 2.21B | 151M |
| EBITDA | -1.25B | 42.3M |
| EBIT | -1.42B | 17.8M |
| Interest Expense | 63M | 11.9M |
| Net Income | -1.64B | -1.97M |
| EPS | -11.32 | -0.36 |
| Fiscal Year | 2025 | 2025 |
Income Statement Analysis: The Bottom-Line Duel
This income statement comparison reveals which company operates with greater financial efficiency and bottom-line strength.
Sandisk Corporation Analysis
Sandisk’s revenue shows a mixed trajectory, declining 25% from 2022 to 2025 but rising 10% in the latest year. Gross margins improve sharply to 30%, yet the net margin remains deeply negative at -22%, reflecting high costs and operational losses. The 2025 year highlights accelerating losses with net income plunging to -$1.64B, signaling weak profitability and margin compression.
Mesa Laboratories, Inc. Analysis
Mesa Laboratories posts steady revenue growth of 80% over 2021-2025, with 11% growth in the latest year. Gross margin stands robust at 63%, and the EBIT margin is positive at 7%, though net margin remains slightly negative at -0.8%. The most recent year shows improving operational efficiency and a narrowing net loss of just $2M, indicating momentum towards profitability.
Margin Strength vs. Revenue Resilience
Mesa Laboratories outperforms Sandisk with stronger gross and EBIT margins and healthier revenue growth. Sandisk suffers from steep net losses despite improving gross profit. Mesa’s profile offers a more efficient cost structure and better operational momentum. Investors prioritizing margin quality and improving bottom-line trends may find Mesa’s income statement more attractive.
Financial Ratios Comparison
These vital ratios act as a diagnostic tool to expose the underlying fiscal health, valuation premiums, and capital efficiency of the companies compared below:
| Ratios | Sandisk Corporation (SNDK) | Mesa Laboratories, Inc. (MLAB) |
|---|---|---|
| ROE | -17.8% | -1.2% |
| ROIC | -11.9% | -1.4% |
| P/E | -4.17 | -326.35 |
| P/B | 0.74 | 4.03 |
| Current Ratio | 3.56 | 0.63 |
| Quick Ratio | 2.11 | 0.47 |
| D/E | 0.22 | 1.14 |
| Debt-to-Assets | 15.7% | 41.9% |
| Interest Coverage | -21.9 | 1.38 |
| Asset Turnover | 0.57 | 0.56 |
| Fixed Asset Turnover | 11.9 | 7.45 |
| Payout ratio | 0 | -176.7% |
| Dividend yield | 0 | 0.54% |
| Fiscal Year | 2025 | 2025 |
Efficiency & Valuation Duel: The Vital Signs
Financial ratios serve as a company’s DNA, uncovering hidden risks and operational strengths that raw numbers alone cannot reveal.
Sandisk Corporation
Sandisk’s profitability suffers with a -17.81% ROE and -22.31% net margin, signaling operational challenges. Its valuation appears attractive with a low P/E of -4.17 and P/B of 0.74, suggesting the stock is undervalued. The company reinvests heavily in R&D and growth, as it pays no dividend.
Mesa Laboratories, Inc.
Mesa Laboratories reports a weak -1.24% ROE and a slim -0.82% net margin, reflecting poor profitability. Its P/E is deeply negative at -326.35, indicating valuation stress, while a high P/B of 4.03 signals overvaluation. Despite a modest 0.54% dividend yield, its high leverage and weak liquidity raise concerns.
Valuation Edge vs. Operational Fragility
Sandisk offers a better valuation profile despite poor profitability, with stronger liquidity and moderate leverage. Mesa’s high price multiples and financial weakness heighten risk. Investors seeking value amid operational uncertainty may lean toward Sandisk’s profile, while Mesa fits those tolerating higher risk for potential turnaround.
Which one offers the Superior Shareholder Reward?
I compare Sandisk Corporation (SNDK) and Mesa Laboratories, Inc. (MLAB) on distribution strategies, dividend yields, payout ratios, and share buybacks. Sandisk pays no dividends, suffering losses and negative free cash flow, indicating no current shareholder distributions. Mesa yields 0.54%, with modest payout ratios around 1.7–3.6%, supported by positive free cash flow near 7.8/share and steady operating cash flow. Buyback data is absent, so I focus on dividends and cash flow. Mesa’s dividend and free cash flow coverage suggest a sustainable, though modest, shareholder return. Sandisk’s losses and zero dividends highlight risk and no immediate reward. For 2026, I find Mesa offers a superior total return profile due to its positive cash flow, dividend yield, and sustainable payout approach.
Comparative Score Analysis: The Strategic Profile
The radar chart reveals the fundamental DNA and trade-offs of Sandisk Corporation and Mesa Laboratories, highlighting their distinctive financial strengths and weaknesses:
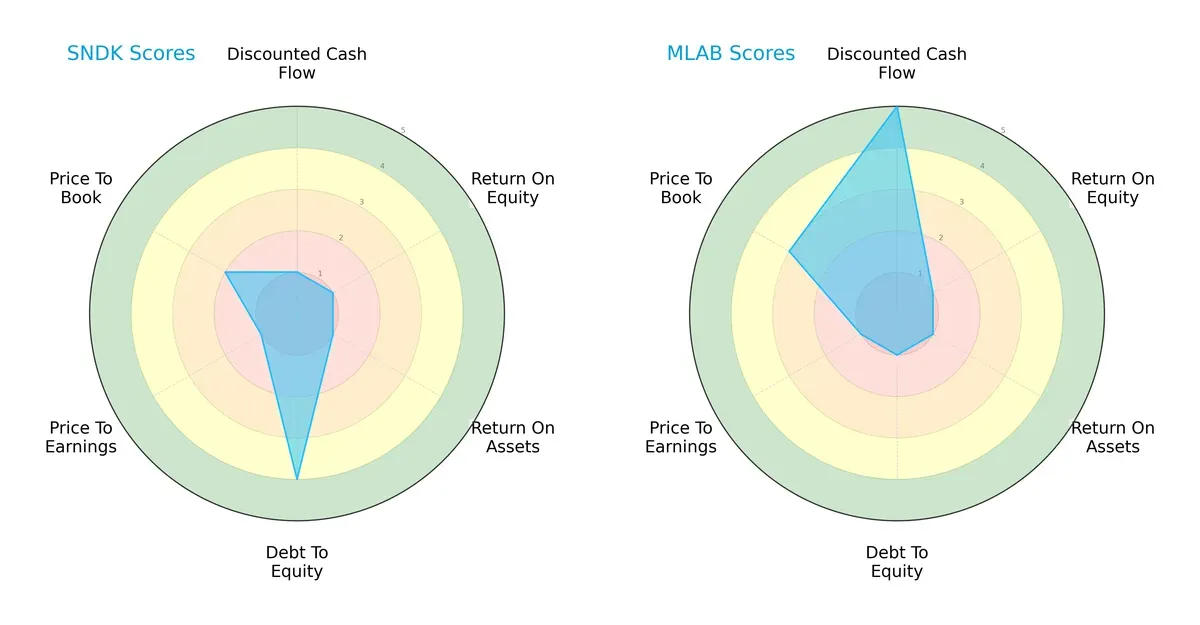
Mesa Laboratories excels in discounted cash flow (DCF) with a top score of 5, signaling strong future cash flow expectations. Sandisk outperforms in debt management with a debt-to-equity score of 4, reflecting a more conservative balance sheet. Both firms score low on return on equity (ROE) and return on assets (ROA), indicating operational challenges. Valuation metrics (PE/PB) remain moderate to unfavorable for both, but Mesa holds a slight edge in price-to-book.
—
Bankruptcy Risk: Solvency Showdown
The Altman Z-Score gap sharply favors Sandisk, indicating a much stronger solvency position in this market cycle:
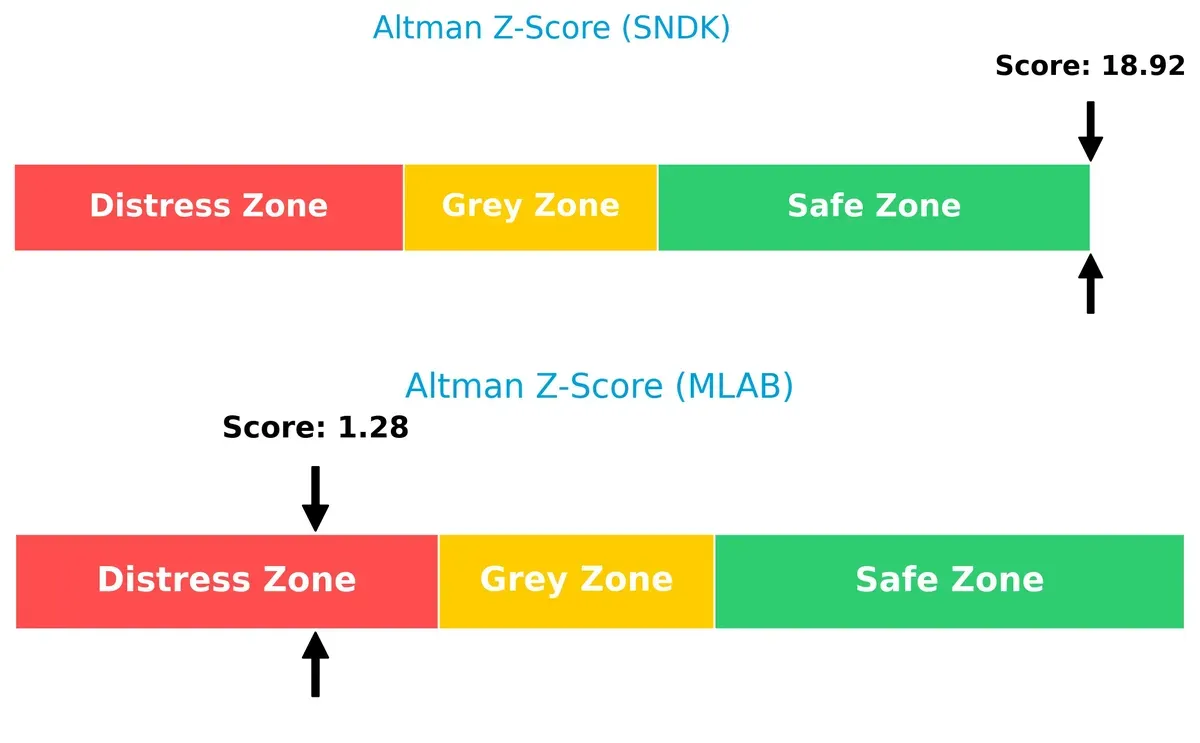
Sandisk’s Z-Score near 19 places it firmly in the safe zone, signaling negligible bankruptcy risk. Mesa’s score below 1.8 flags financial distress and a high risk of insolvency under current conditions. This disparity demands caution for Mesa investors.
—
Financial Health: Quality of Operations
Both Sandisk and Mesa Laboratories share an average Piotroski F-Score of 5, signaling moderate financial health with room for improvement:
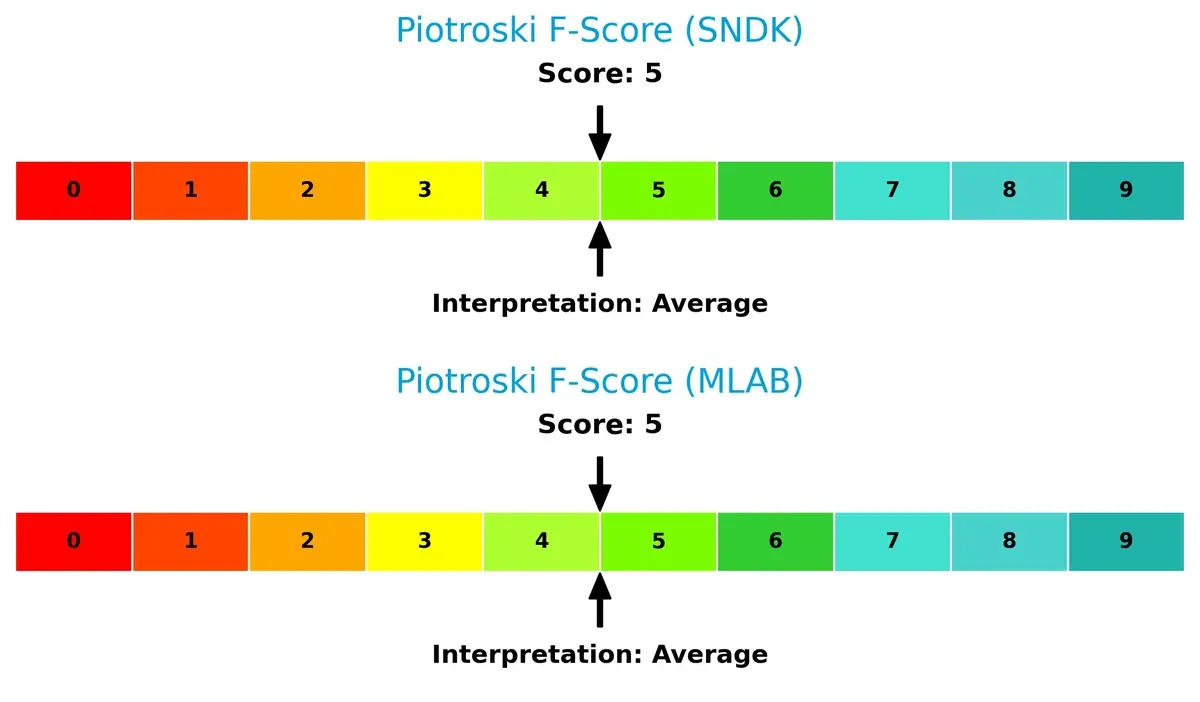
A score of 5 indicates neither company is in peak form. Investors should watch for red flags in profitability and operational efficiency, as neither firm demonstrates robust internal financial quality. This parity suggests similar operational risk profiles.
How are the two companies positioned?
This section dissects the operational DNA of Sandisk and Mesa by comparing their revenue distribution by segment and internal strengths and weaknesses. The goal is to confront their economic moats and identify which model delivers the most resilient, sustainable competitive advantage today.
Revenue Segmentation: The Strategic Mix
This comparison dissects how Sandisk Corporation and Mesa Laboratories diversify their income streams and where their primary sector bets lie:
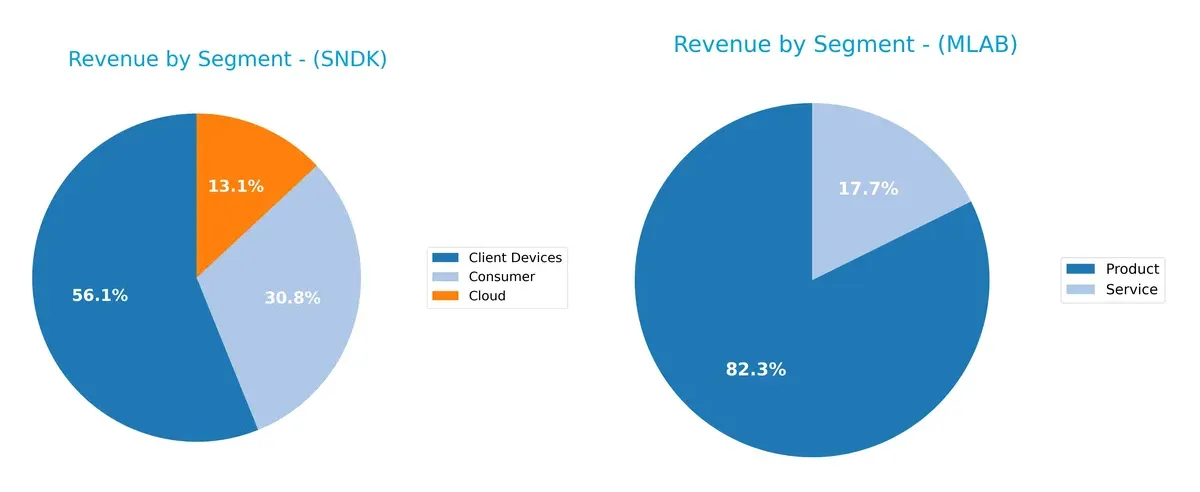
Sandisk anchors 4.13B in Client Devices, dwarfing its 2.27B Consumer and 960M Cloud segments, showing a strong reliance on hardware. Mesa Laboratories, with 198M in Product and 43M in Service revenue, displays a tighter focus but more balance between offerings. Sandisk’s concentration risks hinge on consumer tech cycles, while Mesa’s diversified healthcare tools reduce vulnerability and suggest steady niche dominance.
Strengths and Weaknesses Comparison
This table compares the strengths and weaknesses of Sandisk Corporation and Mesa Laboratories, Inc.:
Sandisk Corporation Strengths
- Diversified revenue across Client Devices, Cloud, and Consumer segments
- Strong global presence with significant sales in China, US, and Asia
- Favorable quick ratio and low debt-to-assets ratio
- High fixed asset turnover showing efficient use of tangible assets
Mesa Laboratories, Inc. Strengths
- Diverse product and service offerings including biopharmaceutical and calibration solutions
- Favorable weighted average cost of capital (6.62%) indicating cheaper capital
- Positive fixed asset turnover reflects efficient asset use
Sandisk Corporation Weaknesses
- Negative profitability metrics: net margin (-22.31%), ROE (-17.81%), ROIC (-11.89%)
- Unfavorable interest coverage and high WACC (25.99%)
- Current ratio unusually high (3.56) signaling potential asset inefficiency
- No dividend yield
Mesa Laboratories, Inc. Weaknesses
- Negative profitability with net margin (-0.82%) and ROE (-1.24%)
- Poor liquidity ratios: current ratio (0.63), quick ratio (0.47)
- High debt-to-equity (1.14) and unfavorable interest coverage (1.5)
- Unfavorable price-to-book ratio (4.03) and low dividend yield (0.54%)
Overall, Sandisk exhibits a broader global footprint and better asset efficiency but struggles with profitability and cost of capital. Mesa shows segment diversification and manageable capital costs but faces liquidity and leverage challenges. These factors crucially shape each company’s strategic options.
The Moat Duel: Analyzing Competitive Defensibility
A structural moat is the only reliable barrier protecting long-term profits from the relentless erosion of competition. Let’s examine two contrasting moats:
Sandisk Corporation: Cost Advantage Powerhouse
Sandisk leverages its cost advantage in NAND flash technology, reflected in its sizable market cap and solid gross margins. However, declining ROIC signals rising competitive pressure and potential margin compression in 2026.
Mesa Laboratories, Inc.: Specialized Intangible Assets
Mesa’s moat stems from specialized life sciences tools and quality control products, supporting robust gross margins and revenue growth. Despite a shrinking ROIC, its niche focus offers growth potential in expanding clinical genomics markets.
Verdict: Cost Leadership vs. Specialized Innovation
Both companies suffer declining ROIC, signaling value destruction. Yet, Sandisk’s broader scale and cost advantage provide a wider moat. Mesa’s intangible asset moat, while narrower, may offer resilience through innovation. Sandisk remains better positioned to defend market share amid intensifying competition.
Which stock offers better returns?
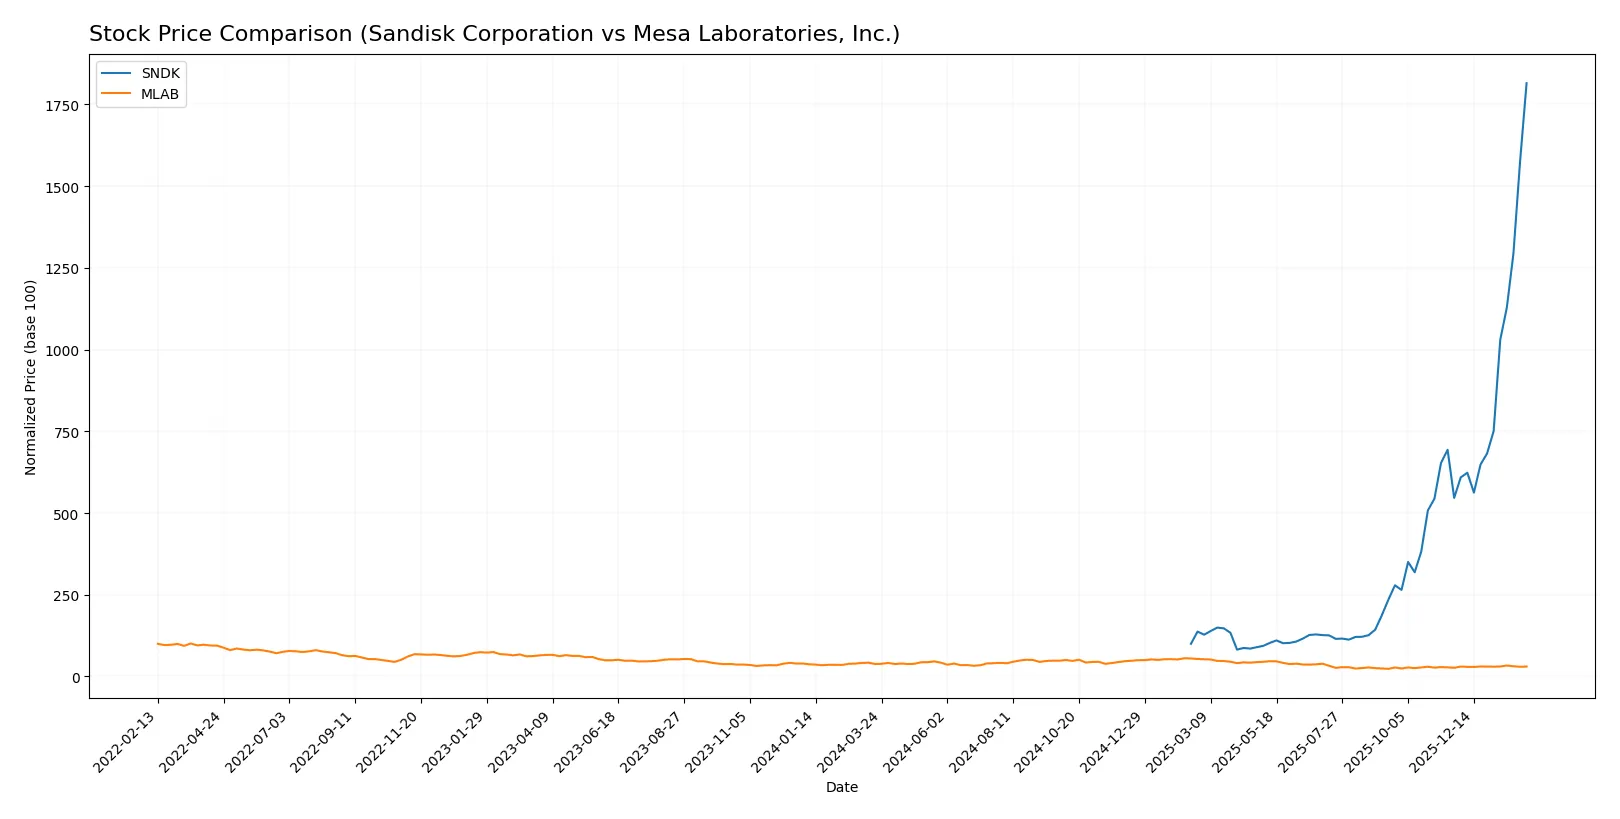
The past year reveals stark contrasts in price movements: Sandisk Corporation’s shares soared sharply, while Mesa Laboratories, Inc. faced a clear downward trajectory.
Trend Comparison
Sandisk Corporation’s stock rose 1715.12% over the past year, showing a strong bullish trend with accelerating momentum and high volatility, reaching a peak price of 665.24.
Mesa Laboratories, Inc. declined 20.36% in the same period, marking a bearish trend with accelerating decline, moderate volatility, and a high of 147.79 before falling to a low near 61.66.
Sandisk’s stock vastly outperformed Mesa’s, delivering the highest market returns with sustained acceleration and dominant buyer activity, contrasting Mesa’s bearish performance and neutral volume behavior.
Target Prices
Analysts present a broad consensus on target prices for Sandisk Corporation and Mesa Laboratories, Inc.
| Company | Target Low | Target High | Consensus |
|---|---|---|---|
| Sandisk Corporation | 220 | 1000 | 675 |
| Mesa Laboratories, Inc. | 83 | 83 | 83 |
Sandisk’s target consensus at 675 slightly exceeds its current price of 665.24, signaling moderate upside potential. Mesa Laboratories’ consensus of 83 aligns closely with its 80.5 market price, indicating a near-term price stability expectation.

Don’t Let Luck Decide Your Entry Point
Optimize your entry points with our advanced ProRealTime indicators. You’ll get efficient buy signals with precise price targets for maximum performance. Start outperforming now!
How do institutions grade them?
Sandisk Corporation Grades
Below are the recent institutional grades for Sandisk Corporation from top-tier firms:
| Grading Company | Action | New Grade | Date |
|---|---|---|---|
| Barclays | Maintain | Equal Weight | 2026-02-02 |
| Citigroup | Maintain | Buy | 2026-02-02 |
| RBC Capital | Maintain | Sector Perform | 2026-01-30 |
| Wedbush | Maintain | Outperform | 2026-01-30 |
| Jefferies | Maintain | Buy | 2026-01-30 |
| Goldman Sachs | Maintain | Buy | 2026-01-30 |
| Cantor Fitzgerald | Maintain | Overweight | 2026-01-30 |
| Morgan Stanley | Maintain | Overweight | 2026-01-30 |
| Citigroup | Maintain | Buy | 2026-01-20 |
| Benchmark | Maintain | Buy | 2026-01-15 |
Mesa Laboratories, Inc. Grades
Below are the recent institutional grades for Mesa Laboratories, Inc. from recognized firms:
| Grading Company | Action | New Grade | Date |
|---|---|---|---|
| Wells Fargo | Maintain | Equal Weight | 2025-12-15 |
| Wells Fargo | Upgrade | Equal Weight | 2025-08-08 |
| Wells Fargo | Maintain | Underweight | 2025-05-30 |
| Evercore ISI Group | Maintain | Outperform | 2024-10-01 |
| Evercore ISI Group | Maintain | Outperform | 2024-08-06 |
| Evercore ISI Group | Maintain | Outperform | 2024-07-02 |
| Evercore ISI Group | Maintain | Outperform | 2024-04-04 |
| Evercore ISI Group | Upgrade | Outperform | 2024-01-04 |
| Evercore ISI Group | Downgrade | In Line | 2021-01-04 |
| Evercore ISI Group | Downgrade | In Line | 2021-01-03 |
Which company has the best grades?
Sandisk Corporation consistently receives Buy to Outperform ratings from multiple top-tier institutions. Mesa Laboratories shows a mixed profile, with recent Equal Weight and Outperform grades but some downgrades earlier. Sandisk’s stronger consensus could indicate greater institutional confidence, potentially influencing investor sentiment more positively.
Risks specific to each company
The following categories identify critical pressure points and systemic threats facing both firms in the challenging 2026 market environment:
1. Market & Competition
Sandisk Corporation
- Faces intense competition in NAND flash and storage tech, pressured by rapid innovation cycles.
Mesa Laboratories, Inc.
- Operates in niche life sciences tools and quality control, facing moderate competition but with specialized products.
2. Capital Structure & Debt
Sandisk Corporation
- Maintains low debt-to-equity (0.22), signaling conservative leverage and financial prudence.
Mesa Laboratories, Inc.
- Exhibits high debt-to-equity (1.14), raising concern over financial risk and balance sheet strain.
3. Stock Volatility
Sandisk Corporation
- Beta near 4.8 indicates very high market sensitivity and price swings, increasing investment risk.
Mesa Laboratories, Inc.
- Beta below 0.9 suggests lower volatility and more stable stock price behavior.
4. Regulatory & Legal
Sandisk Corporation
- Subject to technology industry regulations with potential IP and data security risks.
Mesa Laboratories, Inc.
- Operates under strict healthcare and life sciences regulations, exposing it to compliance and liability risks.
5. Supply Chain & Operations
Sandisk Corporation
- Relies on complex global supply chains vulnerable to semiconductor shortages and geopolitical disruptions.
Mesa Laboratories, Inc.
- Supply chain risks are lower but include specialized component sourcing for lab and medical equipment.
6. ESG & Climate Transition
Sandisk Corporation
- Technology sector pressure to reduce carbon footprint and improve sustainable manufacturing processes.
Mesa Laboratories, Inc.
- Faces increasing demand for ESG compliance in healthcare products and sustainable operational practices.
7. Geopolitical Exposure
Sandisk Corporation
- High exposure to US-China tensions impacting semiconductor supply and export controls.
Mesa Laboratories, Inc.
- More diversified global footprint but exposed to international regulatory changes affecting healthcare trade.
Which company shows a better risk-adjusted profile?
Sandisk’s most impactful risk lies in extreme stock volatility, complicating timing and risk management for investors. Mesa’s critical risk is its high leverage, threatening financial stability amid modest profitability. Despite Sandisk’s operational challenges, its strong balance sheet and safe Altman Z-score (18.9) indicate a better risk-adjusted profile. Mesa’s distress-level Z-score (1.28) and unfavorable debt metrics heighten default risk despite lower stock volatility. The recent surge in Sandisk’s share price (+15.4%) underscores market optimism but also volatility concerns investors must heed.
Final Verdict: Which stock to choose?
Sandisk Corporation’s superpower lies in its robust liquidity and operational scale, giving it a notable cash cushion. However, its shrinking profitability and value destruction remain points of vigilance. It suits investors with a high-risk appetite seeking aggressive growth and turnaround potential.
Mesa Laboratories commands a strategic moat through its high gross margins and steady revenue growth, offering a measure of recurring revenue safety. Compared to Sandisk, it presents lower volatility but carries financial leverage risks. It fits more conservative portfolios focused on growth at a reasonable price.
If you prioritize aggressive growth and can withstand volatility, Sandisk outshines with its financial scale and bullish momentum despite profitability challenges. However, if you seek stability with a moderate growth profile, Mesa Laboratories offers better stability but commands caution due to financial risks. Both require careful risk management given their value destruction trends.
Disclaimer: Investment carries a risk of loss of initial capital. The past performance is not a reliable indicator of future results. Be sure to understand risks before making an investment decision.
Go Further
I encourage you to read the complete analyses of Sandisk Corporation and Mesa Laboratories, Inc. to enhance your investment decisions: