Investors seeking opportunities in innovative hardware and technology sectors often compare Mesa Laboratories, Inc. (MLAB) and MicroVision, Inc. (MVIS), two U.S.-based companies listed on NASDAQ. Both operate in the hardware, equipment, and parts industry but focus on distinct yet overlapping advanced technologies—Mesa on life sciences tools and quality control, and MicroVision on lidar sensors and display tech. This analysis will help you identify which company offers the most compelling investment potential in 2026.

Table of contents
Companies Overview
I will begin the comparison between Mesa Laboratories, Inc. and MicroVision, Inc. by providing an overview of these two companies and their main differences.
Mesa Laboratories, Inc. Overview
Mesa Laboratories, Inc. develops, manufactures, and sells life sciences tools and quality control products globally. Its segments include sterilization control, biopharmaceutical development, calibration solutions, and clinical genomics. Mesa serves industries such as healthcare, pharmaceuticals, and medical devices, positioning itself as a diversified provider of precision measurement and testing solutions with a market cap of approximately 472M USD.
MicroVision, Inc. Overview
MicroVision, Inc. specializes in developing lidar sensors for automotive safety and autonomous driving, along with micro-display technologies for augmented reality headsets and smart devices. Its core technology includes laser beam scanning and MEMS modules. With a market cap of about 293M USD, MicroVision primarily targets original equipment and design manufacturers in emerging tech markets like AR and consumer lidar systems.
Key similarities and differences
Both companies operate in the hardware, equipment, and parts industry within the technology sector. Mesa Laboratories focuses on life sciences and quality control instruments, serving medical and pharmaceutical fields, while MicroVision is centered on lidar and display technologies for automotive and consumer electronics. Mesa is more diversified across multiple segments, whereas MicroVision concentrates on innovative scanning and sensing solutions for niche applications.
Income Statement Comparison
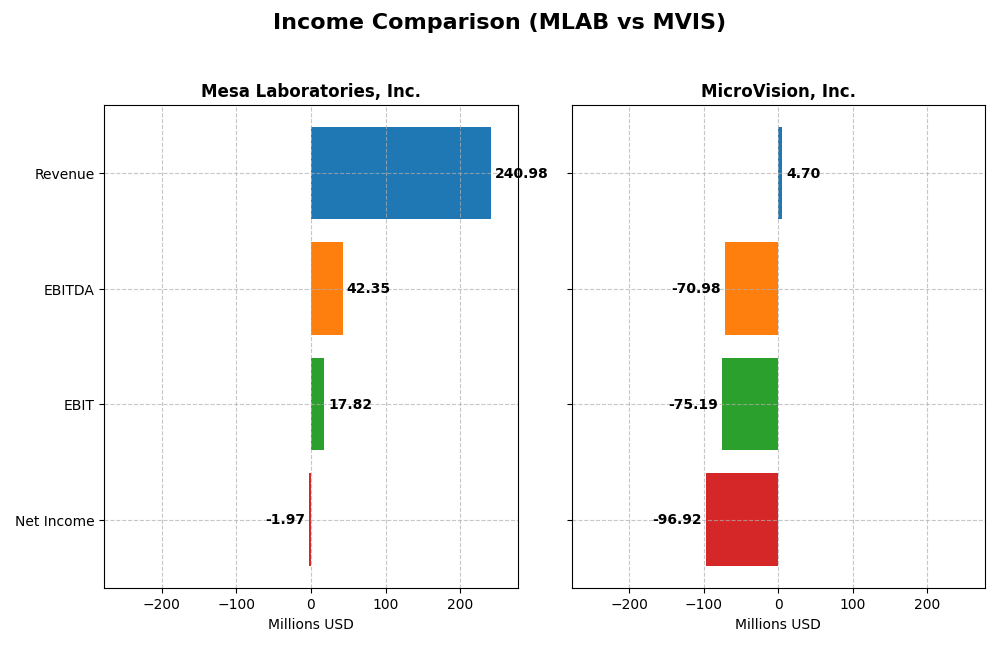
This table presents a side-by-side comparison of key income statement metrics for Mesa Laboratories, Inc. and MicroVision, Inc. for their most recent fiscal years.
| Metric | Mesa Laboratories, Inc. (MLAB) | MicroVision, Inc. (MVIS) |
|---|---|---|
| Market Cap | 472M | 293M |
| Revenue | 241M | 4.7M |
| EBITDA | 42M | -71M |
| EBIT | 18M | -75M |
| Net Income | -2M | -97M |
| EPS | -0.36 | -0.46 |
| Fiscal Year | 2025 | 2024 |
Income Statement Interpretations
Mesa Laboratories, Inc.
Mesa Laboratories showed strong revenue growth from $134M in 2021 to $241M in 2025, a 79.9% increase. Despite this, net income declined considerably, turning negative in recent years with a slight recovery to -$2M in 2025. Gross margins remained favorable at 62.6%, while EBIT margin was neutral at 7.4%. The latest year saw revenue up 11.5% and EBIT more than double, indicating operational improvements.
MicroVision, Inc.
MicroVision’s revenue grew overall from $3.1M in 2020 to $4.7M in 2024 but declined 35.3% in the last year. Net income deteriorated sharply, with losses reaching -$97M in 2024. Margins were deeply negative, including a gross margin of -60.4% and EBIT margin of -1601%. Despite a slight EBIT growth in 2024, the company faces worsening net margin and EPS trends, reflecting ongoing operational challenges.
Which one has the stronger fundamentals?
Mesa Laboratories exhibits stronger fundamentals with positive revenue growth, stable gross margins, and improving EBIT in 2025, despite recent net losses. MicroVision struggles with persistent large net losses, negative margins, and declining recent revenue. Overall, Mesa’s income statement shows more favorable trends and operational resilience compared to MicroVision’s unfavorable financial performance.
Financial Ratios Comparison
This table compares key financial ratios for Mesa Laboratories, Inc. (MLAB) and MicroVision, Inc. (MVIS) based on their most recent fiscal year data to provide a clear snapshot of their financial performance and stability.
| Ratios | Mesa Laboratories, Inc. (2025) | MicroVision, Inc. (2024) |
|---|---|---|
| ROE | -1.24% | -198.72% |
| ROIC | -1.45% | -83.73% |
| P/E | -326.3 | -2.83 |
| P/B | 4.03 | 5.63 |
| Current Ratio | 0.63 | 1.79 |
| Quick Ratio | 0.47 | 1.74 |
| D/E (Debt-to-Equity) | 1.14 | 1.06 |
| Debt-to-Assets | 41.9% | 42.6% |
| Interest Coverage | 1.38 | -19.19 |
| Asset Turnover | 0.56 | 0.04 |
| Fixed Asset Turnover | 7.45 | 0.20 |
| Payout Ratio | -176.7% | 0 |
| Dividend Yield | 0.54% | 0 |
Interpretation of the Ratios
Mesa Laboratories, Inc.
Mesa Laboratories shows predominantly unfavorable financial ratios, including negative net margin (-0.82%) and return on equity (-1.24%), alongside a low current ratio (0.63), indicating liquidity concerns. Favorable aspects include a reasonable weighted average cost of capital (6.61%) and strong fixed asset turnover (7.45). The company pays dividends with a modest yield of 0.54%, but the payout may pose risks given the overall weak coverage by cash flows.
MicroVision, Inc.
MicroVision presents significant weaknesses in its ratios, with a deeply negative net margin (-2063.78%) and return on equity (-198.72%), reflecting substantial losses. Liquidity appears healthier, with current and quick ratios above 1.7, yet interest coverage is negative, signaling financial strain. The company does not pay dividends, likely due to ongoing high losses and a focus on reinvestment and development in a growth phase.
Which one has the best ratios?
Both Mesa Laboratories and MicroVision exhibit unfavorable global ratio profiles with 64.29% of ratios marked as negative. Mesa’s stronger asset turnover and some liquidity issues contrast with MicroVision’s severe profitability deficits but better short-term liquidity. Neither company demonstrates a clearly superior set of financial ratios based on the provided data.
Strategic Positioning
This section compares the strategic positioning of Mesa Laboratories, Inc. and MicroVision, Inc. focusing on Market position, Key segments, and disruption:
Mesa Laboratories, Inc. (MLAB)
- Mid-sized market cap at 472M USD with moderate competitive pressure in life sciences tools.
- Diversified segments: Sterilization, Biopharmaceutical, Calibration, and Genomics products and services.
- Moderate exposure to technological disruption via evolving biopharma and clinical genomics tools.
MicroVision, Inc. (MVIS)
- Smaller market cap of 293M USD, active in innovative lidar and display technologies.
- Concentrated on lidar sensors, laser scanning tech, AR displays, and licensing revenue.
- High exposure to disruption with focus on advanced lidar and AR micro-display innovations.
Mesa Laboratories, Inc. vs MicroVision, Inc. Positioning
MLAB offers a diversified portfolio across life sciences and calibration sectors providing stability but faces value destruction. MVIS focuses on advanced lidar and AR technologies with a growing profitability trend but remains smaller and more specialized.
Which has the best competitive advantage?
Both companies are currently shedding value, but MVIS shows a slightly favorable moat trend with growing ROIC, whereas MLAB’s declining ROIC indicates a very unfavorable moat position.
Stock Comparison
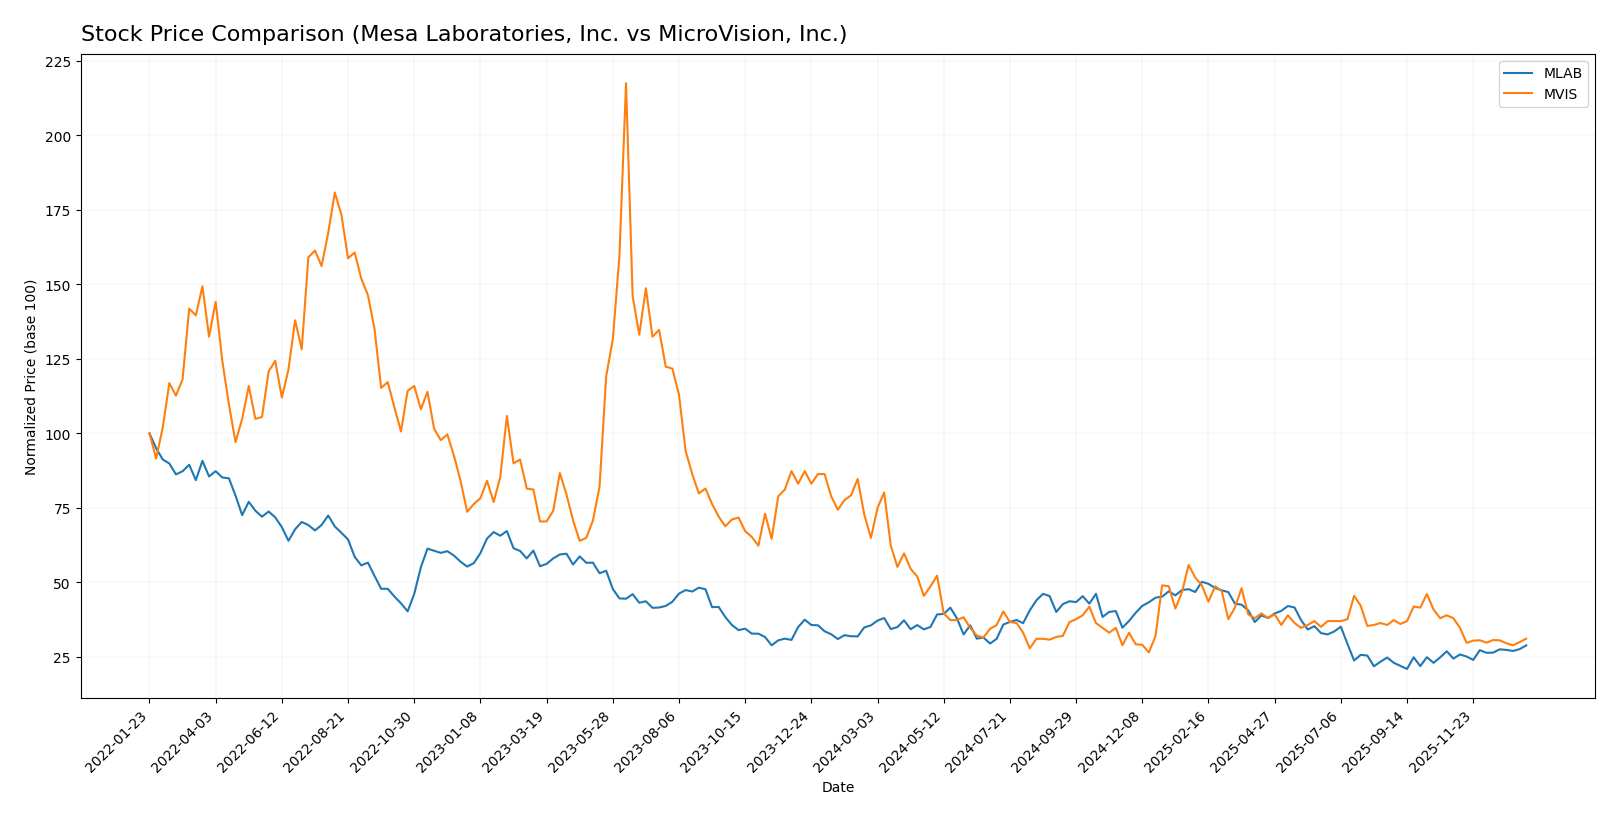
The past year showed contrasting stock price movements for Mesa Laboratories, Inc. (MLAB) and MicroVision, Inc. (MVIS), with MLAB experiencing a sharp overall decline but recent gains, while MVIS faced steep losses and continuing weakness.
Trend Analysis
Mesa Laboratories, Inc. (MLAB) exhibited a bearish trend over the past 12 months with an 18.93% price decline and accelerating downward momentum, hitting a high of 147.79 and a low of 61.66.
MicroVision, Inc. (MVIS) also showed a bearish trend over the past year, with a 52.08% price drop and decelerating losses; recent months reveal further decline of 18.08% and very low volatility.
Comparing trends, MLAB outperformed MVIS over 12 months despite both being bearish; MLAB’s recent recovery contrasts with MVIS’s persistent downward pressure, making MLAB the higher performer.
Target Prices
The current analyst consensus on target prices provides a clear outlook for these technology hardware companies.
| Company | Target High | Target Low | Consensus |
|---|---|---|---|
| Mesa Laboratories, Inc. | 83 | 83 | 83 |
| MicroVision, Inc. | 5 | 5 | 5 |
Mesa Laboratories, Inc. shows a target consensus of $83, slightly below its current price of $85.43, suggesting a modest downside risk. MicroVision, Inc.’s target consensus at $5 is significantly above its current price of $0.96, indicating strong upside potential according to analysts.
Analyst Opinions Comparison
This section compares analysts’ ratings and grades for Mesa Laboratories, Inc. and MicroVision, Inc.:
Rating Comparison
MLAB Rating
- Rating: C+ with a very favorable status.
- Discounted Cash Flow Score: 5, indicating very favorable valuation based on future cash flow.
- ROE Score: 1, very unfavorable, showing low efficiency in generating profit from equity.
- ROA Score: 1, very unfavorable, reflecting poor asset utilization.
- Debt To Equity Score: 1, very unfavorable, implying higher financial risk.
- Overall Score: 2, moderate status, suggesting average overall financial standing.
MVIS Rating
- Rating: C- with a very favorable status.
- Discounted Cash Flow Score: 1, marked as very unfavorable, suggesting less attractive valuation.
- ROE Score: 1, very unfavorable, similarly showing low profitability from equity.
- ROA Score: 1, very unfavorable, also indicating weak asset efficiency.
- Debt To Equity Score: 2, moderate status, showing relatively better financial stability.
- Overall Score: 1, very unfavorable, indicating weaker overall financial health.
Which one is the best rated?
Based strictly on the provided data, Mesa Laboratories (MLAB) holds a higher rating (C+) and a better overall score than MicroVision (MVIS), despite MLAB’s weaknesses in profitability and debt metrics. MVIS scores lower overall, particularly in discounted cash flow and overall financial health.
Scores Comparison
The comparison of Mesa Laboratories, Inc. (MLAB) and MicroVision, Inc. (MVIS) scores is as follows:
MLAB Scores
- Altman Z-Score: 1.36, in the distress zone
- Piotroski Score: 5, indicating average financial strength
MVIS Scores
- Altman Z-Score: -6.42, in the distress zone
- Piotroski Score: 1, indicating very weak financial strength
Which company has the best scores?
Based on the provided data, MLAB has better scores than MVIS, with a higher Altman Z-Score and a significantly stronger Piotroski Score. Both remain in the distress zone for bankruptcy risk, but MLAB shows comparatively better financial health.
Grades Comparison
Here is a comparison of the recent grades assigned to Mesa Laboratories, Inc. and MicroVision, Inc.:
Mesa Laboratories, Inc. Grades
The following table shows recent grades from recognized grading companies for Mesa Laboratories, Inc.:
| Grading Company | Action | New Grade | Date |
|---|---|---|---|
| Wells Fargo | Maintain | Equal Weight | 2025-12-15 |
| Wells Fargo | Upgrade | Equal Weight | 2025-08-08 |
| Wells Fargo | Maintain | Underweight | 2025-05-30 |
| Evercore ISI Group | Maintain | Outperform | 2024-10-01 |
| Evercore ISI Group | Maintain | Outperform | 2024-08-06 |
| Evercore ISI Group | Maintain | Outperform | 2024-07-02 |
| Evercore ISI Group | Maintain | Outperform | 2024-04-04 |
| Evercore ISI Group | Upgrade | Outperform | 2024-01-04 |
| Evercore ISI Group | Downgrade | In Line | 2021-01-04 |
| Evercore ISI Group | Downgrade | In Line | 2021-01-03 |
Mesa Laboratories, Inc. has experienced a generally stable to positive trend, with multiple recent Outperform ratings from Evercore ISI Group and an upgrade from Underweight to Equal Weight by Wells Fargo.
MicroVision, Inc. Grades
The following table shows recent grades from recognized grading companies for MicroVision, Inc.:
| Grading Company | Action | New Grade | Date |
|---|---|---|---|
| D. Boral Capital | Maintain | Buy | 2025-12-16 |
| D. Boral Capital | Maintain | Buy | 2025-11-12 |
| WestPark Capital | Maintain | Buy | 2025-10-21 |
| WestPark Capital | Maintain | Buy | 2025-09-05 |
| D. Boral Capital | Maintain | Buy | 2025-09-02 |
| WestPark Capital | Maintain | Buy | 2025-08-27 |
| D. Boral Capital | Maintain | Buy | 2025-08-11 |
| D. Boral Capital | Maintain | Buy | 2025-05-21 |
| D. Boral Capital | Maintain | Buy | 2025-05-13 |
| WestPark Capital | Maintain | Buy | 2025-03-27 |
MicroVision, Inc. has consistently received Buy ratings from D. Boral Capital and WestPark Capital without any downgrades or changes.
Which company has the best grades?
MicroVision, Inc. holds a stronger consensus with persistent Buy ratings, while Mesa Laboratories, Inc. shows mixed ratings with a Hold consensus. Investors might perceive MicroVision’s consistent Buy ratings as a sign of higher analyst confidence compared to Mesa Laboratories’ more cautious outlook.
Strengths and Weaknesses
Below is a comparison of the key strengths and weaknesses of Mesa Laboratories, Inc. (MLAB) and MicroVision, Inc. (MVIS) based on the most recent data including financial performance, innovation, and market presence.
| Criterion | Mesa Laboratories, Inc. (MLAB) | MicroVision, Inc. (MVIS) |
|---|---|---|
| Diversification | Moderate: Diverse product and service lines including biopharmaceutical development and sterilization control | Limited: Revenue mainly from licenses, royalties, and some product sales |
| Profitability | Weak: Negative net margin (-0.82%) and declining ROIC, value destroying | Weak: Large negative net margin (-2063.78%) but improving ROIC trend |
| Innovation | Moderate: Steady product development but no strong growth in ROIC | Promising: Growing ROIC trend indicates increasing profitability potential |
| Global presence | Established: Consistent revenues from multiple product segments globally | Emerging: Smaller scale, focus on niche technology licensing |
| Market Share | Stable in niche medical and calibration markets | Small and volatile in technology licensing and product sales |
Key takeaways: Both companies currently face profitability challenges with negative net margins and ROIC below WACC, signaling value destruction. However, MVIS shows a positive ROIC trend, hinting at improving operational efficiency. MLAB benefits from better diversification and stable global presence, while MVIS relies heavily on licensing revenues. Investors should be cautious and monitor future profitability trends closely.
Risk Analysis
Below is a risk comparison table for Mesa Laboratories, Inc. (MLAB) and MicroVision, Inc. (MVIS) based on the most recent available data.
| Metric | Mesa Laboratories, Inc. (MLAB) | MicroVision, Inc. (MVIS) |
|---|---|---|
| Market Risk | Beta 0.89, moderate volatility | Beta 1.27, higher volatility |
| Debt level | Debt-to-Equity 1.14 (unfavorable) | Debt-to-Equity 1.06 (unfavorable) |
| Regulatory Risk | Moderate, healthcare & biotech regulations | Moderate, automotive & AR tech regulations |
| Operational Risk | Moderate, diverse product segments | High, reliance on emerging lidar technology |
| Environmental Risk | Low to moderate | Low to moderate |
| Geopolitical Risk | Low, US-based with international sales | Low, US-based with global OEM clients |
Mesa Laboratories carries moderate market risk with a beta below 1, but exhibits unfavorable debt levels and liquidity ratios, increasing financial risk. MicroVision faces higher market risk due to greater stock volatility and very weak profitability metrics, with a distressed financial position and weak operational efficiency. Both companies are in the technology sector but differ in operational risk exposure, with MicroVision’s dependence on nascent lidar technology posing a greater risk of failure or slower adoption. Investors should weigh MicroVision’s higher volatility and financial distress against Mesa’s moderate but persistent profitability challenges.
Which Stock to Choose?
Mesa Laboratories, Inc. (MLAB) shows favorable income growth with an 11.47% revenue increase in 2025 and a solid gross margin of 62.61%. However, profitability ratios such as net margin (-0.82%) and ROE (-1.24%) are unfavorable. The company carries moderate debt with a debt-to-equity ratio of 1.14 and a low current ratio of 0.63. Its overall rating stands at C+ with a very favorable discounted cash flow score but unfavorable profitability scores.
MicroVision, Inc. (MVIS) presents a challenging income profile, with negative gross margin (-60.35%) and extremely unfavorable net margin (-2063.78%) in 2024. Financial ratios are mostly unfavorable, including ROE (-198.72%) and asset turnover (0.04). The company has a moderate debt level (debt-to-equity 1.06) and better liquidity ratios (current ratio 1.79). Its overall rating is C- with very unfavorable scores across key profitability and valuation metrics.
From an investment perspective, Mesa Laboratories might appear more attractive for investors prioritizing income growth and operational stability despite some financial weaknesses. Conversely, MicroVision could be interpreted as a higher-risk option with declining profitability but some signs of improving ROIC. Risk-averse investors might lean toward MLAB, while risk-tolerant investors focused on potential turnaround scenarios might consider MVIS.
Disclaimer: Investment carries a risk of loss of initial capital. The past performance is not a reliable indicator of future results. Be sure to understand risks before making an investment decision.
Go Further
I encourage you to read the complete analyses of Mesa Laboratories, Inc. and MicroVision, Inc. to enhance your investment decisions: