Merck & Co., Inc. (MRK) and Pfizer Inc. (PFE) are two giants in the pharmaceutical industry, both shaping global healthcare through innovative drug development and vaccine production. Their overlapping markets, broad therapeutic portfolios, and ongoing collaborations highlight fierce competition and strategic innovation. For investors seeking stable growth and potential breakthroughs, understanding which company offers the best opportunities is crucial. This article will help you decide which stock deserves a place in your portfolio.

Table of contents
Companies Overview
I will begin the comparison between Merck & Co., Inc. and Pfizer Inc. by providing an overview of these two companies and their main differences.
Merck & Co., Inc. Overview
Merck & Co., Inc. is a global healthcare company operating through Pharmaceutical and Animal Health segments. Its pharmaceutical products cover oncology, immunology, neuroscience, virology, cardiovascular, diabetes, and vaccines. The animal health segment offers veterinary pharmaceuticals, vaccines, and digital health management solutions. Founded in 1891, Merck serves diverse customers including hospitals, healthcare providers, veterinarians, and government agencies.
Pfizer Inc. Overview
Pfizer Inc. discovers, develops, manufactures, and markets biopharmaceutical products worldwide. Its portfolio includes medicines and vaccines for cardiovascular, metabolic, women’s health, immunotherapies, anti-infectives, and COVID-19 treatments. Pfizer also engages in contract manufacturing and serves wholesalers, hospitals, pharmacies, and government agencies. Founded in 1849, Pfizer is headquartered in New York City and emphasizes broad therapeutic areas with multiple branded products.
Key similarities and differences
Both Merck and Pfizer operate in the healthcare sector focusing on pharmaceuticals and vaccines, serving global markets with extensive therapeutic portfolios. Merck uniquely integrates animal health solutions, while Pfizer emphasizes contract manufacturing alongside biopharmaceuticals. Both companies collaborate with other industry players but differ in scale, with Merck having a larger market cap and Pfizer employing more staff. Their business models share a global reach and diversified product lines but vary in segment focus and partnerships.
Income Statement Comparison
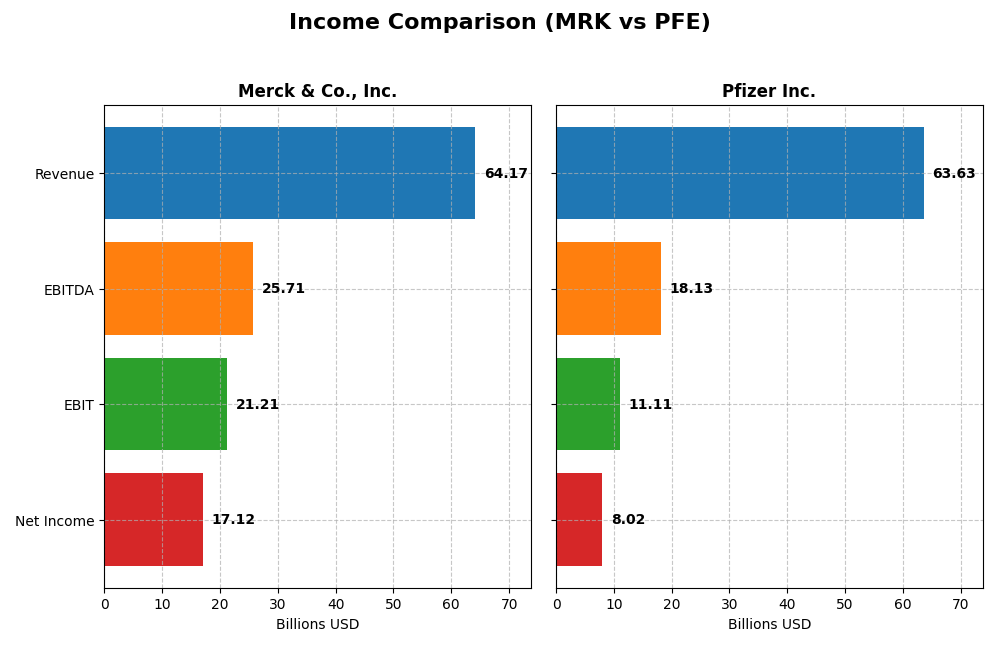
The table below presents a side-by-side comparison of key income statement metrics for Merck & Co., Inc. and Pfizer Inc. based on their most recent fiscal year data for 2024.
| Metric | Merck & Co., Inc. | Pfizer Inc. |
|---|---|---|
| Market Cap | 278B | 145B |
| Revenue | 64.2B | 63.6B |
| EBITDA | 25.7B | 18.1B |
| EBIT | 21.2B | 11.1B |
| Net Income | 17.1B | 8.0B |
| EPS | 6.76 | 1.42 |
| Fiscal Year | 2024 | 2024 |
Income Statement Interpretations
Merck & Co., Inc.
Merck demonstrated steady revenue growth from 2020 to 2024, increasing by 54.55%, with net income surging 142.21% over the same period. Margins improved notably, with a gross margin of 76.32% and a net margin of 26.68% in 2024. The most recent year showed a 6.74% revenue growth and a remarkable 4293% net margin expansion, indicating significant profitability gains.
Pfizer Inc.
Pfizer’s revenue grew by 52.76% from 2020 to 2024, but net income declined by 12.44%. Margins remain favorable, though lower than Merck’s, with a 65.77% gross margin and 12.6% net margin in 2024. The latest year saw moderate revenue growth of 6.84% and strong net margin growth of 251.92%, reflecting operational improvement despite long-term net income challenges.
Which one has the stronger fundamentals?
Merck holds stronger fundamentals, supported by higher and expanding margins, consistent revenue, and substantial net income growth over five years. Pfizer shows solid revenue growth and recent margin improvement but faces unfavorable long-term net income and EPS declines. Overall, Merck’s financial metrics reflect greater stability and profitability compared to Pfizer’s mixed results.
Financial Ratios Comparison
The table below presents a side-by-side comparison of key financial ratios for Merck & Co., Inc. (MRK) and Pfizer Inc. (PFE) for the fiscal year 2024, providing insights into their profitability, liquidity, leverage, and market valuation.
| Ratios | Merck & Co., Inc. (MRK) | Pfizer Inc. (PFE) |
|---|---|---|
| ROE | 36.96% | 9.09% |
| ROIC | 18.97% | 9.31% |
| P/E | 14.72 | 18.74 |
| P/B | 5.44 | 1.70 |
| Current Ratio | 1.36 | 1.17 |
| Quick Ratio | 1.15 | 0.92 |
| D/E (Debt-to-Equity) | 0.83 | 0.76 |
| Debt-to-Assets | 32.68% | 31.39% |
| Interest Coverage | 15.91 | 5.33 |
| Asset Turnover | 0.55 | 0.30 |
| Fixed Asset Turnover | 2.70 | 3.46 |
| Payout Ratio | 45.80% | 118.60% |
| Dividend Yield | 3.11% | 6.33% |
Interpretation of the Ratios
Merck & Co., Inc.
Merck exhibits strong financial ratios with a favorable net margin of 26.68%, ROE at 36.96%, and ROIC at 18.97%, indicating efficient profitability and capital use. However, the price-to-book ratio of 5.44 is unfavorable, suggesting the stock may be overvalued relative to book value. The dividend yield stands at 3.11%, supported by a sustainable payout ratio and robust free cash flow coverage, with manageable risks related to distributions and buybacks.
Pfizer Inc.
Pfizer shows mixed ratio results, with a favorable net margin of 12.6% but an unfavorable ROE of 9.09%, reflecting less efficient equity returns. Its ROIC is neutral at 9.31%, and asset turnover is weak at 0.3. The dividend yield is 6.33%, though classified as neutral, with no clear evidence of excessive repurchases or unsustainable payouts. Overall, the balance between profitability and liquidity ratios remains moderate.
Which one has the best ratios?
Merck holds the advantage with a higher proportion of favorable ratios (57.14%) and stronger profitability metrics, including ROE and ROIC, compared to Pfizer’s more mixed profile and higher neutral ratio count. Pfizer’s weaker asset turnover and equity returns weigh on its evaluation, making Merck’s ratios comparatively more robust and consistent.
Strategic Positioning
This section compares the strategic positioning of Merck & Co., Inc. and Pfizer Inc. in terms of Market position, Key segments, and Exposure to disruption:
Merck & Co., Inc.
- Larger market cap of $278B with lower beta, facing general drug manufacturer competition.
- Diversified revenue from Pharmaceuticals ($57.4B) and Animal Health ($5.9B) segments.
- Collaborates on long-acting HIV treatments, limited explicit mention of technological disruption.
Pfizer Inc.
- Market cap of $145B, moderate beta, competing broadly in biopharma.
- Primarily biopharma-driven ($62.4B in 2024), with a focus on medicines and vaccines.
- Engages in innovative vaccines and treatments, with multiple collaboration agreements.
Merck & Co., Inc. vs Pfizer Inc. Positioning
Merck exhibits a more diversified segment approach through pharmaceuticals and animal health, offering multiple revenue drivers. Pfizer concentrates heavily on biopharmaceutical products, emphasizing vaccines and specialty medicines, which may imply different risk profiles and growth dynamics.
Which has the best competitive advantage?
Both companies demonstrate a very favorable economic moat with growing ROICs above WACC, indicating durable competitive advantages. Merck shows a stronger ROIC premium and growth trend, suggesting a potentially wider moat in capital efficiency and profitability.
Stock Comparison
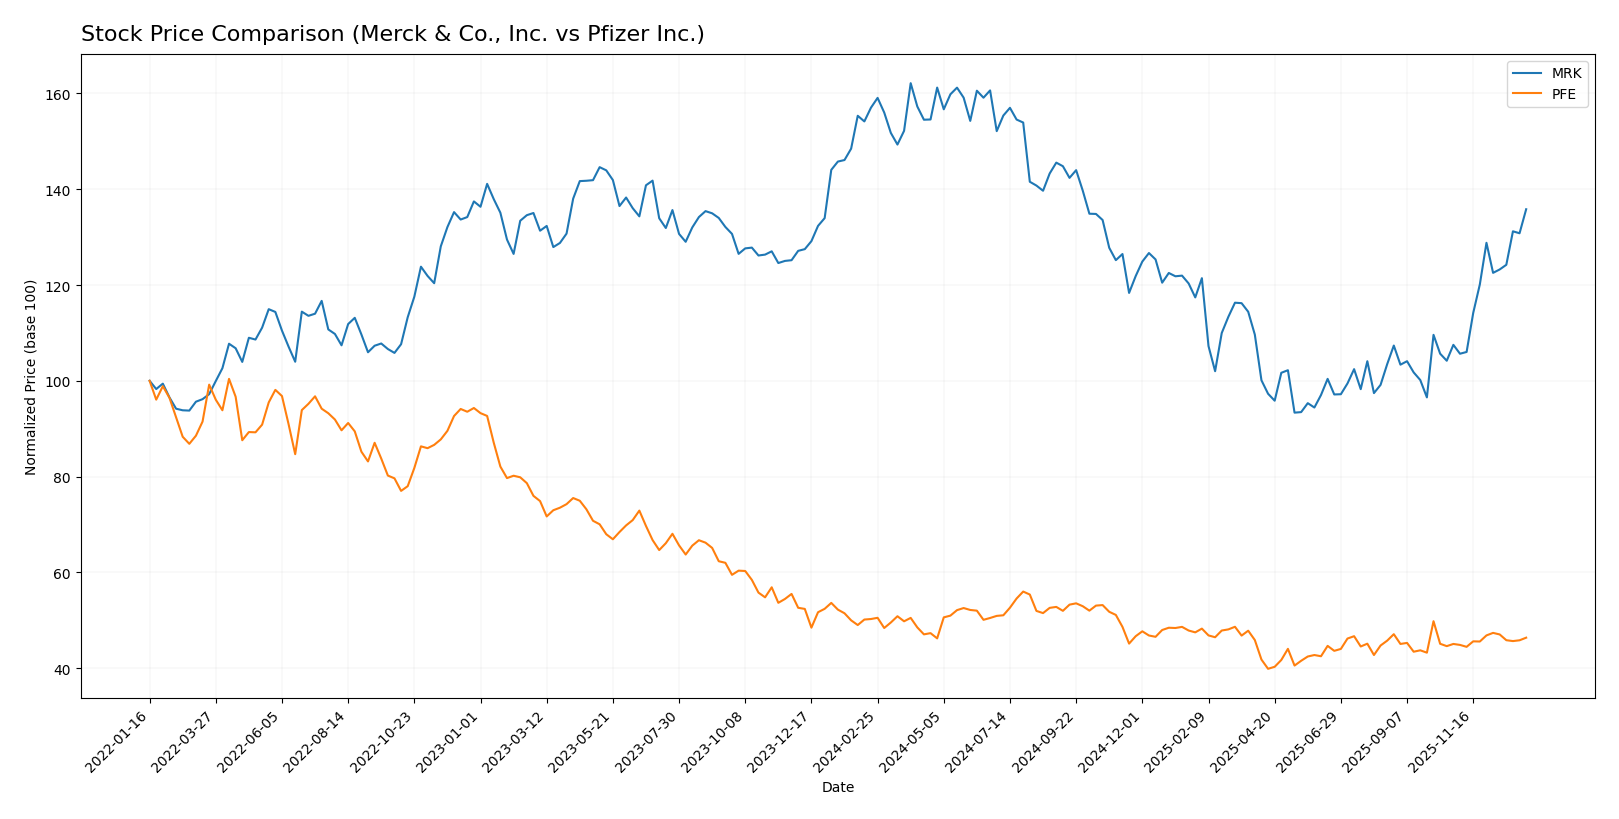
The stock price movements of Merck & Co., Inc. (MRK) and Pfizer Inc. (PFE) over the past year reveal contrasting bearish trends with notable acceleration and distinct trading volume dynamics.
Trend Analysis
Merck & Co., Inc. (MRK) experienced a bearish trend with a -13.51% price decline over the past 12 months, marked by accelerating downward momentum and high volatility (std deviation 18.04). The recent quarter shows a strong rebound with a 26.33% gain.
Pfizer Inc. (PFE) also displayed a bearish trend with a -7.75% price drop over the past 12 months, accelerating downward but with lower volatility (std deviation 1.98). Its recent trend reflects a mild 2.91% recovery.
Comparing both, MRK’s stock has shown the highest market performance recently with a significant rebound, despite a larger overall decline, while PFE’s decline and recovery remain more moderate.
Target Prices
The current consensus target prices reflect moderate upside potential for both Merck & Co., Inc. and Pfizer Inc.
| Company | Target High | Target Low | Consensus |
|---|---|---|---|
| Merck & Co., Inc. | 135 | 90 | 118.78 |
| Pfizer Inc. | 35 | 24 | 28.14 |
Analysts expect Merck’s stock to trade above the current price of $110.53, signaling potential appreciation. Pfizer’s consensus target of $28.14 also suggests a modest gain compared to its current price of $25.48.
Analyst Opinions Comparison
This section compares analysts’ ratings and grades for Merck & Co., Inc. and Pfizer Inc.:
Rating Comparison
Merck & Co., Inc. Rating
- Rating: A- with a very favorable status
- Discounted Cash Flow Score: 5, very favorable
- ROE Score: 5, very favorable
- ROA Score: 5, very favorable
- Debt To Equity Score: 1, very unfavorable
- Overall Score: 4, favorable
Pfizer Inc. Rating
- Rating: A- with a very favorable status
- Discounted Cash Flow Score: 5, very favorable
- ROE Score: 4, favorable
- ROA Score: 4, favorable
- Debt To Equity Score: 1, very unfavorable
- Overall Score: 4, favorable
Which one is the best rated?
Both Merck and Pfizer share the same overall rating of A- and an overall score of 4, indicating favorable assessments. Merck scores higher in ROE and ROA, while both share identical DCF and debt-to-equity scores.
Scores Comparison
Here is a comparison of the Altman Z-Score and Piotroski Score for both companies:
MRK Scores
- Altman Z-Score: 4.52, indicating a safe zone status.
- Piotroski Score: 6, reflecting average financial strength.
PFE Scores
- Altman Z-Score: 2.12, indicating a grey zone status.
- Piotroski Score: 7, reflecting strong financial strength.
Which company has the best scores?
Merck (MRK) has a higher Altman Z-Score, placing it in the safe zone, while Pfizer (PFE) has a stronger Piotroski Score. Each company shows strengths in different financial metrics.
Grades Comparison
Here is a comparison of the recent grades assigned to Merck & Co., Inc. and Pfizer Inc.:
Merck & Co., Inc. Grades
The following table summarizes recent grades and rating actions for Merck & Co., Inc.:
| Grading Company | Action | New Grade | Date |
|---|---|---|---|
| Wolfe Research | Upgrade | Outperform | 2026-01-08 |
| Citigroup | Maintain | Neutral | 2026-01-07 |
| UBS | Maintain | Buy | 2026-01-07 |
| BMO Capital | Upgrade | Outperform | 2025-12-18 |
| B of A Securities | Maintain | Buy | 2025-12-15 |
| Morgan Stanley | Maintain | Equal Weight | 2025-12-12 |
| Scotiabank | Maintain | Sector Outperform | 2025-12-04 |
| Goldman Sachs | Maintain | Buy | 2025-12-02 |
| Wells Fargo | Upgrade | Overweight | 2025-11-24 |
| Deutsche Bank | Maintain | Hold | 2025-11-18 |
Merck’s grades show a generally positive trend with several upgrades to “Outperform” and consistent “Buy” or equivalent ratings from major firms.
Pfizer Inc. Grades
Below is a summary of recent grades and rating actions for Pfizer Inc.:
| Grading Company | Action | New Grade | Date |
|---|---|---|---|
| Morgan Stanley | Maintain | Equal Weight | 2025-12-17 |
| B of A Securities | Maintain | Neutral | 2025-12-15 |
| Morgan Stanley | Maintain | Equal Weight | 2025-12-12 |
| Guggenheim | Maintain | Buy | 2025-11-24 |
| Morgan Stanley | Maintain | Equal Weight | 2025-10-10 |
| B of A Securities | Maintain | Neutral | 2025-10-03 |
| Morgan Stanley | Maintain | Equal Weight | 2025-08-06 |
| B of A Securities | Maintain | Neutral | 2025-08-06 |
| Citigroup | Maintain | Neutral | 2025-08-06 |
| UBS | Maintain | Neutral | 2025-04-30 |
Pfizer’s ratings are more conservative, predominantly reflecting “Neutral” or “Equal Weight” assessments with one “Buy” rating from Guggenheim.
Which company has the best grades?
Merck & Co., Inc. has received stronger and more positive grades compared to Pfizer Inc., with multiple upgrades and a consensus “Buy” rating. Pfizer shows a more cautious consensus with mostly “Hold” and neutral grades. This contrast may indicate differing market expectations and risk perceptions for investors considering these stocks.
Strengths and Weaknesses
Below is a comparison of key strengths and weaknesses of Merck & Co., Inc. (MRK) and Pfizer Inc. (PFE) based on the most recent financial and operational data.
| Criterion | Merck & Co., Inc. (MRK) | Pfizer Inc. (PFE) |
|---|---|---|
| Diversification | Strong diversification with Pharmaceutical ($57.4B) and Animal Health ($5.9B) segments | Primarily focused on Biopharma ($62.4B) with limited segment diversification |
| Profitability | High net margin (26.7%), ROIC 19.0%, and ROE 37.0% indicate robust profitability | Moderate net margin (12.6%), ROIC 9.3%, and lower ROE 9.1%, reflecting more modest profitability |
| Innovation | Significant R&D investments sustaining a growing ROIC trend (214.6%) and durable competitive advantage | Growing ROIC (41.7%) but at a lower level; innovation focused in Biopharma but less diversified |
| Global presence | Extensive global pharmaceutical and animal health footprint | Strong global presence predominantly in Biopharma with recent segment focus |
| Market Share | Large market share supported by balanced segments and strong value creation (ROIC > WACC by 14%) | Solid market share in Biopharma but narrower segment scope; ROIC > WACC by 4% |
Key takeaways: Merck demonstrates a more diversified business model and stronger profitability metrics with a very favorable economic moat. Pfizer, while profitable and competitively advantaged, shows slightly less diversification and moderate profitability, suggesting a more focused but potentially riskier investment profile.
Risk Analysis
Below is a comparison table of key risks for Merck & Co., Inc. (MRK) and Pfizer Inc. (PFE) based on the most recent data from 2024.
| Metric | Merck & Co., Inc. (MRK) | Pfizer Inc. (PFE) |
|---|---|---|
| Market Risk | Low beta (0.30) suggests lower volatility compared to market | Moderate beta (0.43), slightly higher market sensitivity |
| Debt level | Debt-to-equity 0.83, neutral level with strong interest coverage (16.69x) | Debt-to-equity 0.76, moderate interest coverage (3.6x), watch leverage |
| Regulatory Risk | High due to pharma industry standards, but stable approvals and collaborations | Similar high regulatory scrutiny with ongoing vaccine and drug approvals |
| Operational Risk | Diversified portfolio across human and animal health; stable operations | Broad product range but lower asset turnover (0.3) may indicate operational inefficiencies |
| Environmental Risk | Moderate, standard pharma environmental challenges | Moderate, similar industry exposure |
| Geopolitical Risk | US-based with global operations; some exposure due to international markets | US-based with significant global footprint; geopolitical tensions could affect supply chains |
In synthesis, Merck shows lower market risk and stronger debt service capacity, making financial distress less likely (Altman Z-score in safe zone). Pfizer’s moderate market risk and lower interest coverage pose higher financial caution, with an Altman Z-score in the grey zone. Regulatory and geopolitical risks remain significant for both, given the pharma sector’s global exposure and compliance demands.
Which Stock to Choose?
Merck & Co., Inc. (MRK) shows a favorable income evolution with 54.55% revenue growth over five years and strong profitability, including a 26.68% net margin and 36.96% ROE. Its debt level is moderate (net debt to EBITDA 0.97), and the rating is very favorable (A-), supported by a very favorable economic moat and solid financial ratios.
Pfizer Inc. (PFE) also reports favorable income metrics, such as 52.76% revenue growth but with declining net income over the same period. Profitability ratios are less robust, with a 12.6% net margin and 9.09% ROE, while debt is higher (net debt to EBITDA 3.64). The company holds a very favorable rating (A-) and a durable competitive advantage but with slightly fewer favorable financial ratios.
For investors prioritizing strong profitability and value creation, MRK’s very favorable rating, higher returns, and solid income growth might appear more attractive. Conversely, those seeking exposure to a company with a durable moat and moderate but stable financials might view PFE’s profile as suitable, especially given its strong Piotroski score. The choice could depend on the investor’s tolerance for risk and preference for growth versus stability.
Disclaimer: Investment carries a risk of loss of initial capital. The past performance is not a reliable indicator of future results. Be sure to understand risks before making an investment decision.
Go Further
I encourage you to read the complete analyses of Merck & Co., Inc. and Pfizer Inc. to enhance your investment decisions: