Home > Comparison > Healthcare > SYK vs MDT
The strategic rivalry between Stryker Corporation and Medtronic plc shapes the competitive landscape of the medical devices sector. Stryker operates as a diversified medical technology firm focused on orthopedics and neurotechnology, while Medtronic emphasizes device-based therapies across cardiovascular, surgical, and diabetes care. This analysis pits Stryker’s specialized innovation against Medtronic’s broad portfolio to identify the superior risk-adjusted opportunity for long-term investors seeking sector leadership.

Table of contents
Companies Overview
Stryker Corporation and Medtronic plc are pivotal players shaping the global medical devices market.
Stryker Corporation: Innovator in Orthopaedics and Neurotechnology
Stryker Corporation commands a strong market position in medical technology, focusing on orthopaedics and neurotechnology. Its core revenue derives from implants used in joint replacements and spinal surgeries, alongside surgical equipment and neurotechnology products. In 2026, Stryker sharpens its strategic focus on expanding minimally invasive surgical solutions and advanced implant technologies to capture growth globally.
Medtronic plc: Global Leader in Device-Based Therapies
Medtronic plc leads with a diversified portfolio spanning cardiovascular devices, surgical instruments, neuroscience, and diabetes management. The company generates revenue through implantable cardiac technologies, robotic surgery systems, and insulin delivery solutions. In 2026, Medtronic prioritizes innovation in remote monitoring and AI-assisted surgical platforms to enhance patient outcomes and operational efficiency across healthcare systems.
Strategic Collision: Similarities & Divergences
Both companies emphasize medical device innovation but diverge in approach: Stryker focuses on a specialized implant and neurotechnology ecosystem, while Medtronic pursues broad device-based therapies with integrated digital health solutions. Their primary battleground lies in advanced surgical technologies and minimally invasive procedures. Investors should note Stryker’s niche specialization contrasts with Medtronic’s diversified, technology-driven growth profile.
Income Statement Comparison
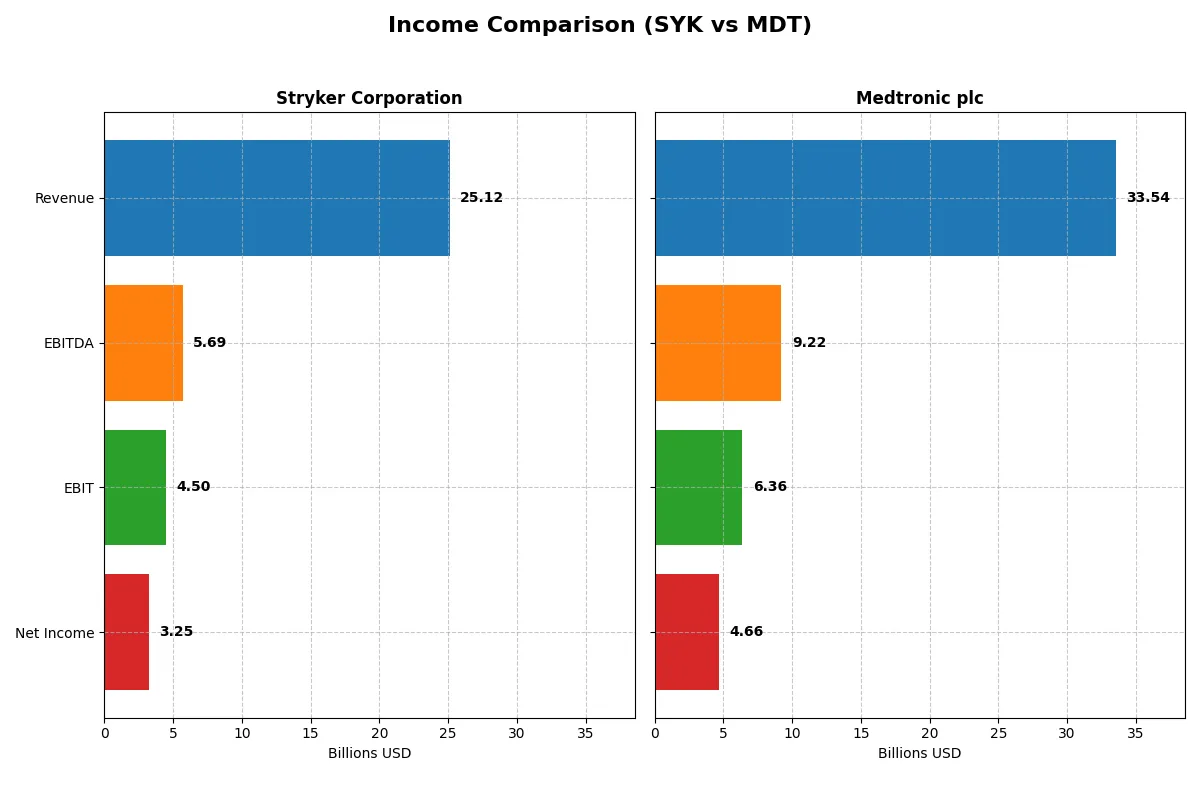
This data dissects the core profitability and scalability of both corporate engines to reveal who dominates the bottom line:
| Metric | Stryker Corporation (SYK) | Medtronic plc (MDT) |
|---|---|---|
| Revenue | 25.1B | 33.5B |
| Cost of Revenue | 9.7B | 11.6B |
| Operating Expenses | 9.8B | 15.9B |
| Gross Profit | 15.4B | 21.9B |
| EBITDA | 5.7B | 9.2B |
| EBIT | 4.5B | 6.4B |
| Interest Expense | 0 | 729M |
| Net Income | 3.2B | 4.7B |
| EPS | 8.49 | 3.63 |
| Fiscal Year | 2025 | 2025 |
Income Statement Analysis: The Bottom-Line Duel
This income statement comparison reveals which company runs a more efficient and profitable business engine from top to bottom.
Stryker Corporation Analysis
Stryker’s revenue grew robustly from $17.1B in 2021 to $25.1B in 2025, a 47% rise signaling strong market demand. Net income surged 63% over five years, reaching $3.25B in 2025. Gross margin remains healthy at 61.4%, while net margin stands at 12.9%. Despite a slight net margin dip last year, Stryker’s operating efficiency and EPS growth illustrate solid momentum.
Medtronic plc Analysis
Medtronic’s revenue expanded modestly by 11% from $30.1B in 2021 to $33.5B in 2025, reflecting steady, less aggressive growth. Net income climbed 29% to $4.66B, with a superior net margin of 13.9% in 2025, supported by a strong gross margin of 65.3%. Medtronic shows disciplined expense control and notable EPS acceleration, signaling improving profitability.
Growth Momentum vs. Margin Leadership
Stryker outpaces Medtronic in revenue and net income growth, showcasing dynamic expansion and operational leverage. Medtronic, however, delivers higher margins and greater net income scale, reflecting its cost discipline and market positioning. For investors, Stryker offers a growth-driven profile, while Medtronic appeals as a margin-focused, steady earner.
Financial Ratios Comparison
These vital ratios act as a diagnostic tool to expose the underlying fiscal health, valuation premiums, and capital efficiency of the companies analyzed:
| Ratios | Stryker Corporation (SYK) | Medtronic plc (MDT) |
|---|---|---|
| ROE | 14.48% | 9.71% |
| ROIC | 7.37% | 6.08% |
| P/E | 41.38 | 23.37 |
| P/B | 5.99 | 2.27 |
| Current Ratio | 1.89 | 1.85 |
| Quick Ratio | 1.21 | 1.42 |
| D/E | 0.66 | 0.59 |
| Debt-to-Assets | 31.06% | 31.10% |
| Interest Coverage | N/A | 8.17 |
| Asset Turnover | 0.52 | 0.37 |
| Fixed Asset Turnover | 6.48 | 4.91 |
| Payout Ratio | 39.56% | 76.98% |
| Dividend Yield | 0.96% | 3.29% |
| Fiscal Year | 2025 | 2025 |
Efficiency & Valuation Duel: The Vital Signs
Financial ratios serve as a company’s DNA, exposing hidden risks and showcasing operational effectiveness critical to investment decisions.
Stryker Corporation
Stryker posts a solid 14.5% ROE and a strong 12.9% net margin, reflecting operational efficiency. However, its P/E of 41.4 signals an expensive valuation, far above industry norms. Dividend yield is low at 0.96%, indicating modest shareholder returns with likely reinvestment in R&D, which accounts for 6.3% of revenue.
Medtronic plc
Medtronic shows a lower 9.7% ROE but a slightly higher 13.9% net margin, suggesting efficient profit generation. Its P/E at 23.4 appears more reasonable, offering a better valuation balance. The company rewards shareholders with a 3.29% dividend yield, signaling a steady income approach alongside moderate reinvestment in innovation (8.1% of revenue).
Premium Valuation vs. Income Stability
Stryker’s high valuation contrasts with Medtronic’s balanced price and income profile. Stryker appeals to growth-focused investors tolerating valuation stretch. Medtronic suits those prioritizing stable dividends and reasonable valuation, offering a safer risk-reward balance. Each profile aligns differently with investor risk appetite and return expectations.
Which one offers the Superior Shareholder Reward?
I compare Stryker (SYK) and Medtronic (MDT) on dividends, payout ratios, and buybacks. SYK yields ~0.96% with a payout near 40%, backed by strong free cash flow (11.2/share). MDT offers a richer yield around 3.3% but pays out nearly 77% of earnings, squeezing reinvestment. Both execute buybacks, yet SYK’s lower payout ratio suggests more balanced capital allocation. SYK’s model supports sustainable growth with steady dividends plus buybacks, while MDT’s high payout risks capex and R&D funding. For 2026, I favor SYK for superior total return potential through prudent distributions and buybacks.
Comparative Score Analysis: The Strategic Profile
The radar chart reveals the fundamental DNA and trade-offs of Stryker Corporation and Medtronic plc, highlighting their financial strengths and valuation differences:
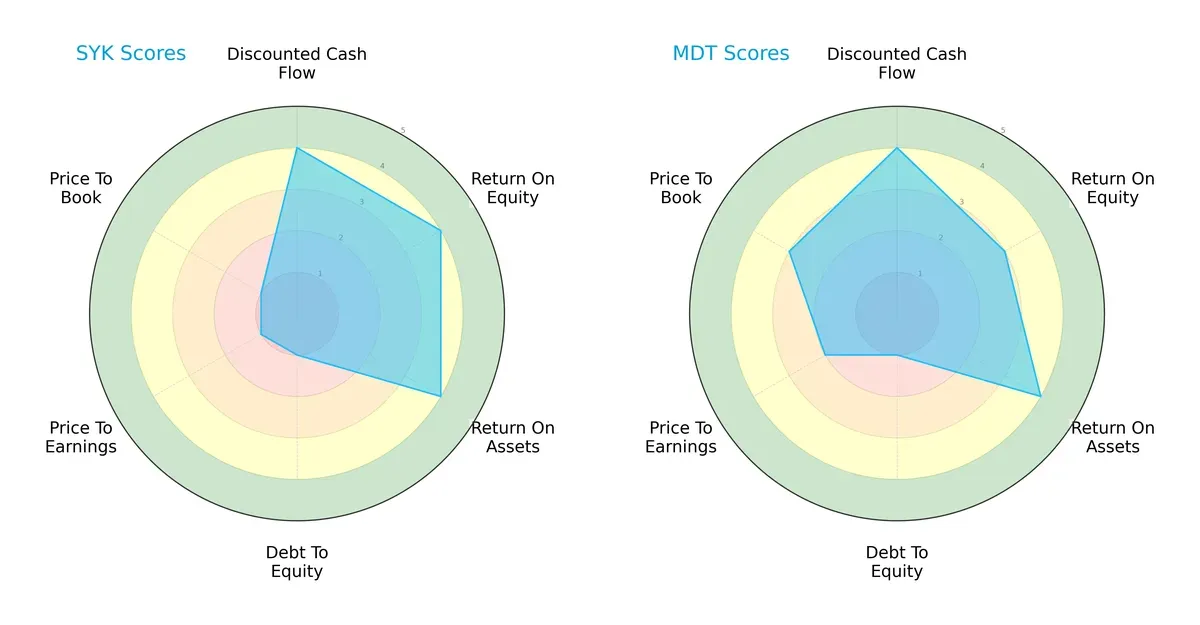
Stryker leads in profitability metrics with higher ROE and ROA scores (4 vs. 3 and 4), showcasing efficient asset and equity utilization. Both firms share top marks in discounted cash flow (4 each) and face heavy leverage risks (debt/equity score of 1). Medtronic holds an edge in valuation, scoring moderately better on P/E (2 vs. 1) and P/B (3 vs. 1), suggesting relatively fairer market pricing. Overall, Stryker’s profile relies on operational excellence, while Medtronic offers a more balanced valuation approach.
Bankruptcy Risk: Solvency Showdown
Stryker’s Altman Z-Score of 4.35 surpasses Medtronic’s 3.11, signaling stronger financial resilience in today’s cycle:
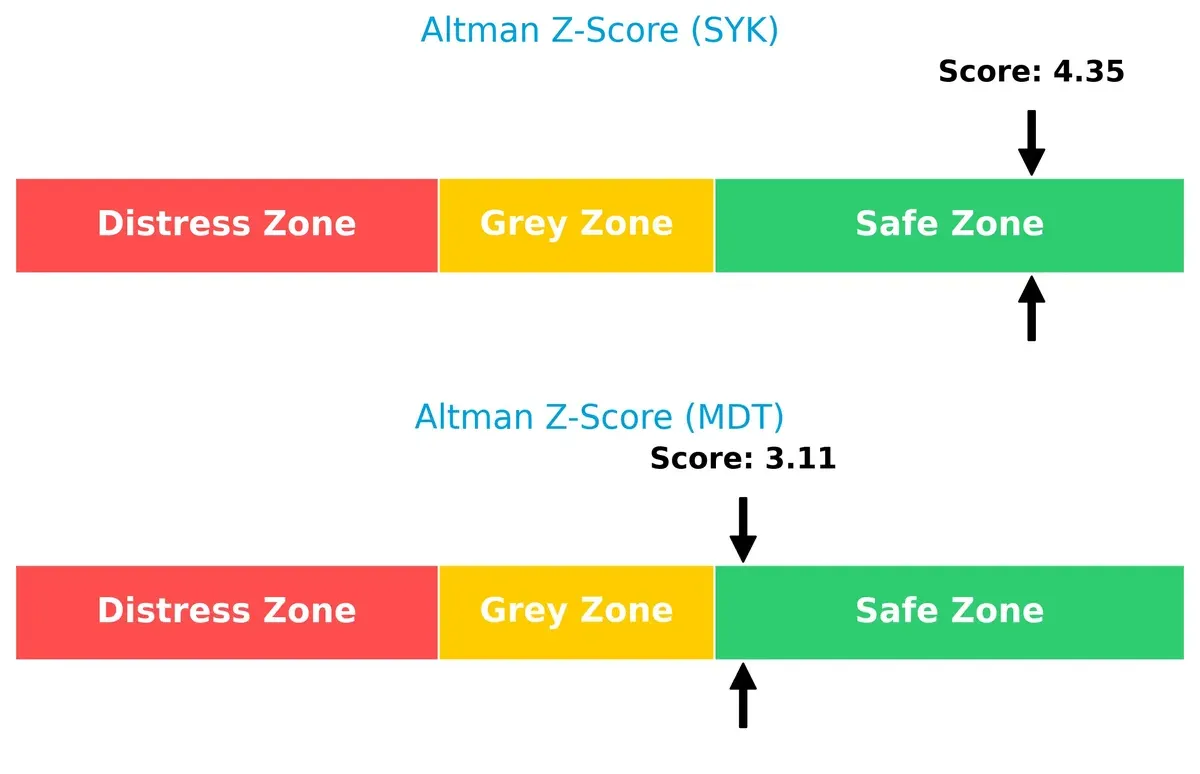
Both companies remain safely above distress thresholds, but Stryker’s higher score indicates a more robust buffer against economic downturns, reducing bankruptcy risk.
Financial Health: Quality of Operations
Medtronic’s Piotroski F-Score of 7 outperforms Stryker’s 5, indicating stronger internal financial metrics and operational quality:
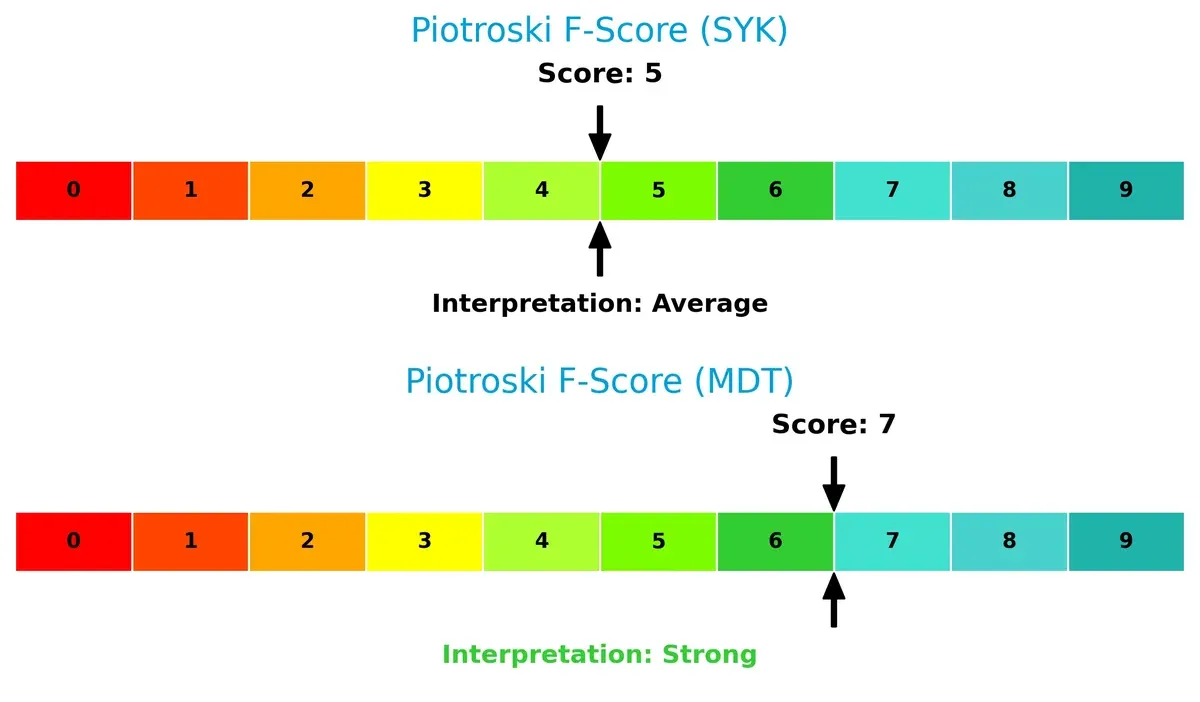
Medtronic demonstrates healthier profitability, leverage, and liquidity controls. Stryker’s moderate score flags potential red flags in operational efficiency or balance sheet robustness, warranting cautious scrutiny.
How are the two companies positioned?
This section dissects Stryker and Medtronic’s operational DNA by comparing revenue distribution and internal dynamics. The goal is to confront their economic moats and identify which model offers the most resilient competitive advantage today.
Revenue Segmentation: The Strategic Mix
This visual comparison dissects how Stryker Corporation and Medtronic plc diversify their income streams and where their primary sector bets lie:
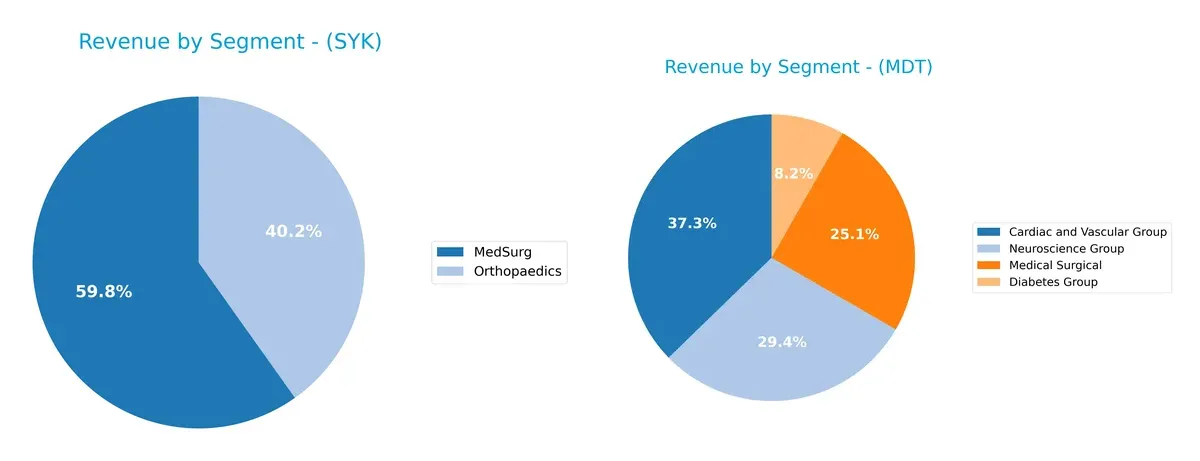
Stryker anchors its revenue in two main segments: MedSurg at $13.5B and Orthopaedics at $9.1B, showing a concentrated but balanced focus. Medtronic dwarfs Stryker’s breadth with four sizable segments, led by Cardiac and Vascular at $12.5B and Neuroscience at $9.8B. Medtronic’s more diversified mix reduces concentration risk and signals an ecosystem lock-in strategy across multiple therapeutic areas. Stryker’s reliance on fewer segments implies higher exposure but a stronger niche dominance.
Strengths and Weaknesses Comparison
This table compares the Strengths and Weaknesses of Stryker Corporation and Medtronic plc:
Stryker Corporation Strengths
- Strong MedSurg and Orthopaedics revenue streams
- Favorable net margin (12.92%)
- Robust current and quick ratios
- Superior fixed asset turnover (6.48)
- Favorable interest coverage
Medtronic plc Strengths
- Diverse product groups including Cardiac, Diabetes, Medical Surgical, Neuroscience
- Higher net margin (13.9%)
- Favorable dividend yield (3.29%)
- Favorable interest coverage
- Slightly lower P/E ratio (23.37)
Stryker Corporation Weaknesses
- Unfavorable high P/E (41.38) and P/B (5.99) ratios
- Neutral ROE and ROIC close to WACC
- Low dividend yield (0.96%)
- Neutral debt ratios
- Moderate asset turnover (0.52)
Medtronic plc Weaknesses
- Unfavorable low ROE (9.71%)
- Unfavorable asset turnover (0.37)
- Neutral P/B ratio (2.27)
- Neutral debt ratios
- Lower ROIC relative to Stryker
Both companies show slightly favorable financial ratios but differ in profitability metrics and valuation. Stryker excels in asset efficiency and liquidity, while Medtronic offers stronger dividend income and broader product diversification. Each faces challenges in valuation or return on equity, impacting capital allocation choices.
The Moat Duel: Analyzing Competitive Defensibility
A structural moat stands as the sole defense protecting a company’s long-term profits from relentless competitive erosion:
Stryker Corporation: Innovation-Driven Product Differentiation
Stryker’s moat stems from its intangible assets, notably innovative surgical and orthopaedic devices. This yields strong margin stability but a declining ROIC signals emerging competitive pressure in 2026.
Medtronic plc: Diversified Portfolio and Market Reach
Medtronic relies on a broad product ecosystem and global scale, contrasting Stryker’s niche focus. Its growing ROIC reflects improving capital efficiency and potential expansion in emerging markets.
Verdict: Innovation Narrow Moat vs. Scale and Efficiency Moat
Both firms are shedding value against WACC, but Medtronic’s rising ROIC indicates a deeper, more durable moat. Medtronic appears better equipped to defend and grow its market share in 2026.
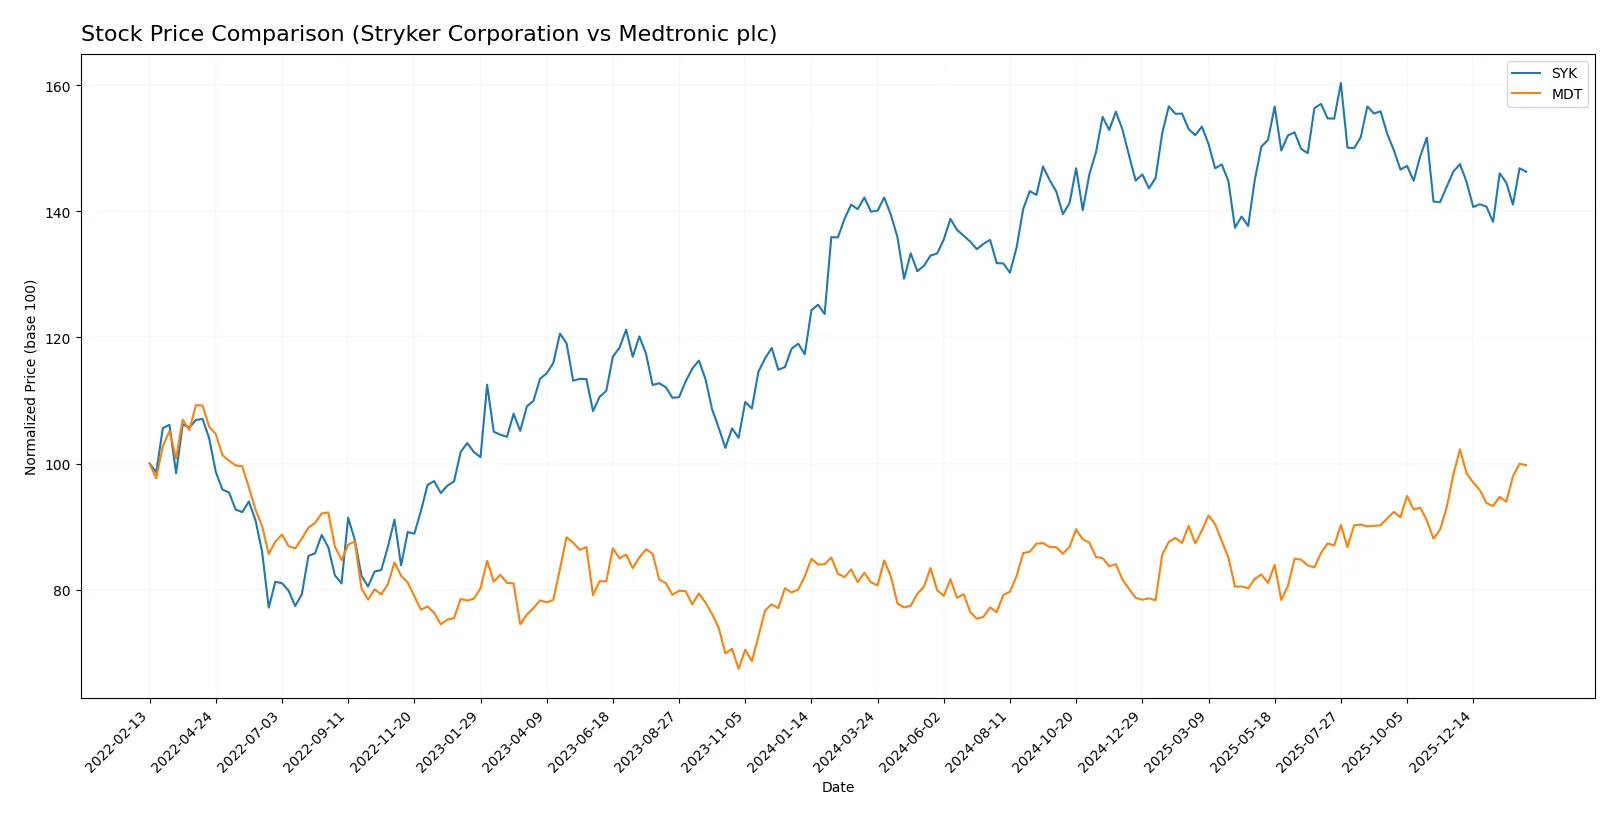
Which stock offers better returns?
Over the past year, Stryker Corporation and Medtronic plc both demonstrated bullish price trends, with notable price gains and decelerating momentum in their upward trajectories.
Trend Comparison
Stryker Corporation’s stock rose 4.52% over the last 12 months, signaling a bullish but decelerating trend with a high volatility level of 18.99%. The price peaked at 403.53 and troughed at 325.43.
Medtronic plc’s stock gained 22.9% in the same period, confirming a stronger bullish trend despite deceleration. Volatility is lower at 6.4%, with prices ranging from 77.61 to 105.33.
Medtronic outperformed Stryker with a significantly higher price increase over the past year, reflecting superior market performance.
Target Prices
Analysts provide a constructive target price consensus for both Stryker Corporation and Medtronic plc.
| Company | Target Low | Target High | Consensus |
|---|---|---|---|
| Stryker Corporation | 390 | 469 | 425.58 |
| Medtronic plc | 103 | 120 | 111.9 |
The target consensus for Stryker at 425.58 implies a 15.5% upside from its current 368.14 price, signaling strong growth potential. Medtronic’s consensus at 111.9 suggests a 9% upside, reflecting steady but more modest market optimism.

Don’t Let Luck Decide Your Entry Point
Optimize your entry points with our advanced ProRealTime indicators. You’ll get efficient buy signals with precise price targets for maximum performance. Start outperforming now!
How do institutions grade them?
The following tables summarize recent institutional grade changes for Stryker Corporation and Medtronic plc:
Stryker Corporation Grades
This table details the latest rating updates from reputable grading firms for Stryker Corporation.
| Grading Company | Action | New Grade | Date |
|---|---|---|---|
| Needham | Maintain | Buy | 2026-01-30 |
| BTIG | Maintain | Buy | 2026-01-30 |
| Bernstein | Maintain | Outperform | 2026-01-09 |
| Citizens | Upgrade | Market Outperform | 2025-12-19 |
| Truist Securities | Maintain | Hold | 2025-12-18 |
| Citigroup | Maintain | Buy | 2025-12-11 |
| Needham | Maintain | Buy | 2025-11-14 |
| BTIG | Maintain | Buy | 2025-11-14 |
| Truist Securities | Maintain | Hold | 2025-11-14 |
| Wells Fargo | Maintain | Overweight | 2025-11-14 |
Medtronic plc Grades
This table provides recent institutional ratings and any changes for Medtronic plc.
| Grading Company | Action | New Grade | Date |
|---|---|---|---|
| Bernstein | Maintain | Outperform | 2026-01-09 |
| Barclays | Maintain | Overweight | 2026-01-08 |
| William Blair | Upgrade | Outperform | 2026-01-06 |
| Truist Securities | Maintain | Hold | 2025-12-18 |
| Truist Securities | Maintain | Hold | 2025-11-20 |
| Barclays | Maintain | Overweight | 2025-11-20 |
| UBS | Maintain | Neutral | 2025-11-19 |
| Wells Fargo | Maintain | Overweight | 2025-11-19 |
| Morgan Stanley | Maintain | Overweight | 2025-11-19 |
| RBC Capital | Maintain | Outperform | 2025-11-19 |
Which company has the best grades?
Stryker consistently earns Buy and Outperform ratings from multiple firms, with one upgrade to Market Outperform. Medtronic shows a mix of Outperform and Overweight grades with fewer Buy ratings. Investors might view Stryker’s grades as stronger signals of confidence from analysts.
Risks specific to each company
The following categories identify the critical pressure points and systemic threats facing both firms in the 2026 market environment:
1. Market & Competition
Stryker Corporation
- Faces intense competition in orthopaedics and surgical equipment with high innovation demands.
Medtronic plc
- Operates in diverse medical device segments, facing broad competitive pressures and rapid technology shifts.
2. Capital Structure & Debt
Stryker Corporation
- Debt-to-equity ratio of 0.66 indicates moderate leverage; interest coverage is excellent (infinite).
Medtronic plc
- Slightly lower debt-to-equity at 0.59 but interest coverage of 8.72 shows strong ability to service debt.
3. Stock Volatility
Stryker Corporation
- Beta of 0.87 suggests lower volatility than the market, reflecting relative stability.
Medtronic plc
- Lower beta of 0.72 indicates even less volatility, appealing to risk-averse investors.
4. Regulatory & Legal
Stryker Corporation
- Exposure to FDA regulations on implants and surgical devices; recalls could impact reputation.
Medtronic plc
- Subject to strict global regulations across multiple device categories, increasing compliance complexity.
5. Supply Chain & Operations
Stryker Corporation
- Operations dependent on global suppliers; potential disruptions in raw materials could affect production.
Medtronic plc
- Larger scale and geographic footprint expose it to more complex supply chain risks but also diversification benefits.
6. ESG & Climate Transition
Stryker Corporation
- Moderate ESG focus; pressure to improve sustainability in manufacturing and product lifecycle.
Medtronic plc
- Increasing ESG initiatives, especially in energy-efficient devices and carbon footprint reduction programs.
7. Geopolitical Exposure
Stryker Corporation
- Primarily US-based operations with international sales; geopolitical tensions may impact global markets.
Medtronic plc
- Headquartered in Ireland with broad international exposure, more vulnerable to geopolitical shifts and trade policies.
Which company shows a better risk-adjusted profile?
Stryker’s biggest risk lies in high valuation metrics and competitive innovation demands. Medtronic faces significant geopolitical and regulatory complexity but benefits from broader diversification and stronger financial stability scores. Medtronic’s lower beta, better Piotroski score, and moderate valuation signal a more balanced risk-adjusted profile amid 2026 uncertainties.
Final Verdict: Which stock to choose?
Stryker Corporation’s superpower lies in its operational efficiency and strong income growth momentum. It delivers robust cash flow despite a warning sign in its declining return on invested capital, signaling a point of vigilance. This stock suits aggressive growth portfolios willing to embrace some profitability headwinds.
Medtronic’s strategic moat is its dependable recurring revenue and consistent margin expansion. It provides a safer profile than Stryker, supported by a stronger balance sheet and higher dividend yield. It fits well within GARP portfolios seeking stable growth with reasonable valuation.
If you prioritize operational efficiency and high growth potential, Stryker stands out despite its value erosion risk. However, if you seek stability and income with improving profitability, Medtronic offers better risk-adjusted stability and a durable competitive position. Both present valid analytical scenarios depending on your portfolio objectives.
Disclaimer: Investment carries a risk of loss of initial capital. The past performance is not a reliable indicator of future results. Be sure to understand risks before making an investment decision.
Go Further
I encourage you to read the complete analyses of Stryker Corporation and Medtronic plc to enhance your investment decisions: