Home > Comparison > Consumer Cyclical > MCD vs YUM
The strategic rivalry between McDonald’s Corporation and Yum! Brands defines the current trajectory of the global consumer cyclical restaurant sector. McDonald’s, a capital-intensive global giant, operates over 40,000 restaurants with a broad menu and strong brand recognition. Yum! Brands, a diversified quick-service franchisor, focuses on multiple specialized brands across 157 countries. This analysis evaluates which operational model offers superior risk-adjusted returns for a diversified portfolio in a competitive market environment.

Table of contents
Companies Overview
McDonald’s and Yum! Brands dominate the global quick-service restaurant market with expansive footprints and diversified menus.
McDonald’s Corporation: Global Quick-Service Giant
McDonald’s leads as a global restaurant powerhouse with 40K locations worldwide. It generates revenue primarily through franchising and company-operated stores selling burgers, chicken, breakfast items, and beverages. In 2026, McDonald’s sharpens its focus on menu innovation and digital ordering to enhance customer engagement and operational efficiency.
Yum! Brands, Inc.: Multi-Brand Quick-Service Operator
Yum! Brands commands a broad portfolio including KFC, Pizza Hut, Taco Bell, and Habit Burger Grill. It earns revenue via franchising and direct operations across 157 countries. The company prioritizes international expansion and brand diversification in 2026 to capture emerging market growth and cater to varied consumer tastes.
Strategic Collision: Similarities & Divergences
Both firms rely heavily on franchising but differ in brand strategy: McDonald’s focuses on a single iconic brand with menu innovation, while Yum! leverages a multi-brand approach targeting diverse food segments. Their primary battleground is global market share in fast casual dining. McDonald’s appeals as a stable cash generator; Yum! offers higher growth potential through geographic and brand expansion.
Income Statement Comparison
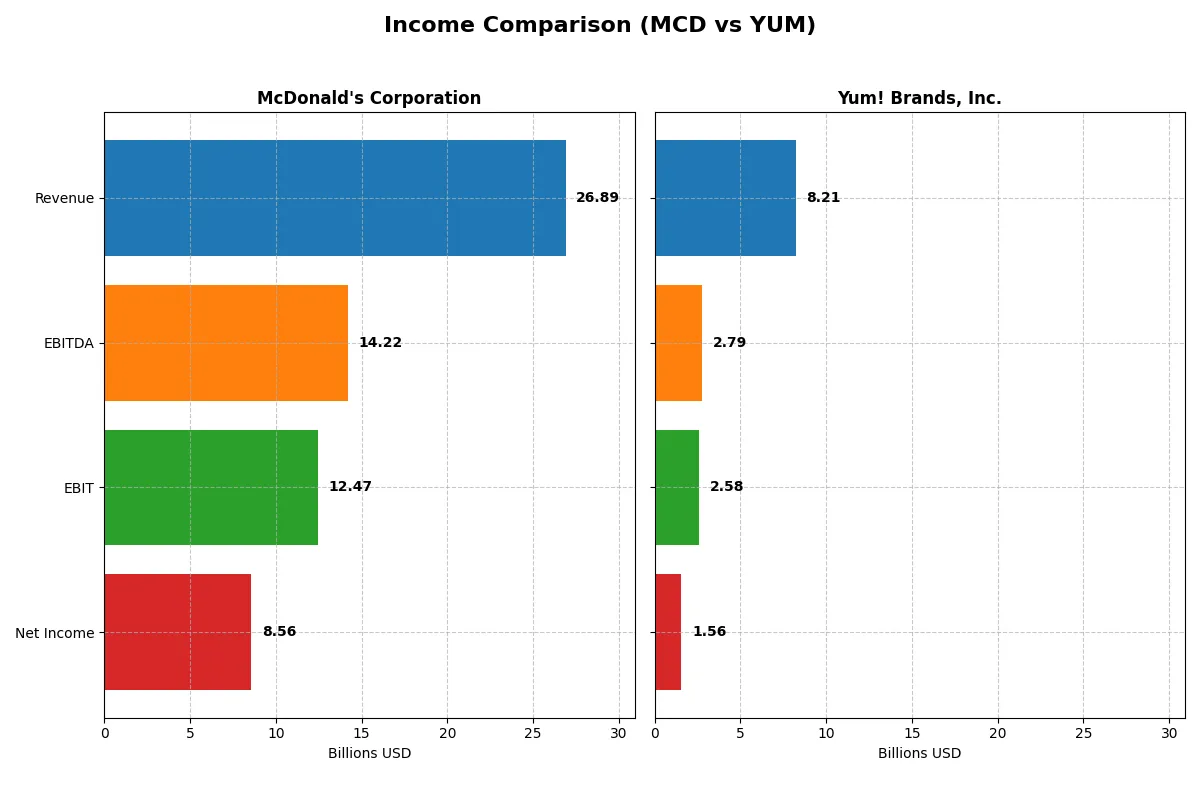
This data dissects the core profitability and scalability of both corporate engines to reveal who dominates the bottom line:
| Metric | McDonald’s (MCD) | Yum! Brands (YUM) |
|---|---|---|
| Revenue | 26.9B | 8.2B |
| Cost of Revenue | 11.6B | 4.4B |
| Operating Expenses | 2.9B | 1.3B |
| Gross Profit | 15.3B | 3.8B |
| EBITDA | 14.2B | 2.8B |
| EBIT | 12.5B | 2.6B |
| Interest Expense | 1.6B | 0.5B |
| Net Income | 8.6B | 1.6B |
| EPS | 11.99 | 5.59 |
| Fiscal Year | 2025 | 2025 |
Income Statement Analysis: The Bottom-Line Duel
The following income statement comparison uncovers which company operates with superior efficiency and delivers stronger profitability.
McDonald’s Corporation Analysis
McDonald’s revenue expanded steadily from $23.2B in 2021 to $26.9B in 2025, with net income climbing from $7.5B to $8.6B. The company sustains a robust gross margin near 57% and a net margin of 31.85%, signaling excellent cost control and pricing power. In 2025, McDonald’s posted a 5.24% EBIT growth, reflecting solid operational momentum.
Yum! Brands, Inc. Analysis
Yum! Brands grew revenue from $6.6B in 2021 to $8.2B in 2025, showing stronger top-line growth at 8.81% year-over-year. Net income, however, declined slightly to $1.56B by 2025, dragging net margin down to 18.98%. Despite favorable gross margin (46.17%) and EBIT margin (31.4%), the company faces margin pressure, with net margin contracting over the period.
Margin Strength vs. Revenue Growth Momentum
McDonald’s leads with higher profitability and margin stability, delivering consistent net income growth and operating efficiency. Yum! Brands exhibits faster revenue expansion but struggles to convert sales into proportional net income gains. For investors, McDonald’s margin strength offers a more resilient earnings profile, while Yum! Brands presents a higher-growth but riskier margin outlook.
Financial Ratios Comparison
These vital ratios act as a diagnostic tool to expose the underlying fiscal health, valuation premiums, and capital efficiency of the companies compared below:
| Ratios | McDonald’s Corporation (MCD) | Yum! Brands, Inc. (YUM) |
|---|---|---|
| ROE | -2.17% (2024) | -0.21% (2025) |
| ROIC | 17.9% (2024) | 28.3% (2025) |
| P/E | 25.3 (2024) | 27.0 (2025) |
| P/B | -54.9 (2024) | -5.7 (2025) |
| Current Ratio | 1.19 (2024) | 1.35 (2025) |
| Quick Ratio | 1.18 (2024) | 1.35 (2025) |
| D/E | -13.7 (2024) | -1.63 (2025) |
| Debt-to-Assets | 94.1% (2024) | 145.3% (2025) |
| Interest Coverage | 7.78 (2024) | 5.06 (2025) |
| Asset Turnover | 0.47 (2024) | 1.00 (2025) |
| Fixed Asset Turnover | 0.67 (2024) | 5.12 (2025) |
| Payout Ratio | 59.2% (2024) | 50.6% (2025) |
| Dividend Yield | 2.34% (2024) | 1.88% (2025) |
| Fiscal Year | 2024 | 2025 |
Efficiency & Valuation Duel: The Vital Signs
Financial ratios act as a company’s DNA, revealing hidden risks and operational excellence essential for investment decisions.
McDonald’s Corporation
McDonald’s delivers strong net margins at 31.85%, indicating efficient core profitability. However, a zero ROE and ROIC highlight challenges in shareholder value creation. The stock trades at a stretched P/E of 25.49, signaling expensive valuation. A 2.35% dividend yield rewards shareholders, reflecting a balanced capital return strategy without aggressive share buybacks.
Yum! Brands, Inc.
Yum! Brands shows solid operational efficiency with a 28.26% ROIC and a 1.35 current ratio, indicating healthy liquidity. Its net margin at 18.98% is respectable but lower than McDonald’s. The P/E of 26.98 suggests a slightly expensive valuation. Yum! offers a modest 1.88% dividend yield, balancing shareholder returns with ongoing reinvestment.
Premium Valuation vs. Operational Safety
Yum! Brands exhibits a more favorable ratio profile with stronger returns on capital and liquidity metrics. McDonald’s boasts higher margins but struggles with equity returns and carries a stretched valuation. Investors seeking operational safety may prefer Yum!, while those prioritizing margin strength may lean toward McDonald’s.
Which one offers the Superior Shareholder Reward?
I compare McDonald’s and Yum! Brands on dividends and buybacks. McDonald’s yields 2.35% with a 60% payout ratio, backed by strong free cash flow, sustaining its generous dividends. Yum! yields 1.88% at a 51% payout, investing more in growth. McDonald’s executes more intense buybacks, boosting total returns. I see McDonald’s distribution model as more sustainable and rewarding for 2026 investors.
Comparative Score Analysis: The Strategic Profile
The radar chart reveals the fundamental DNA and trade-offs of McDonald’s Corporation and Yum! Brands, Inc., highlighting their distinct strengths and strategic priorities:
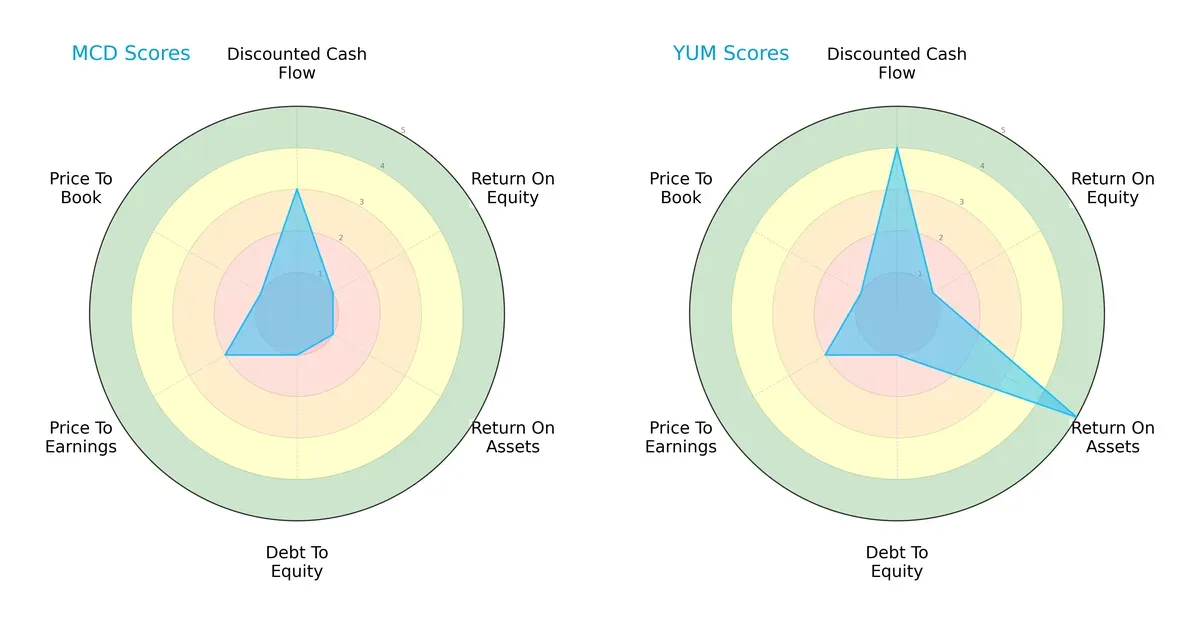
McDonald’s shows moderate potential in discounted cash flow but struggles across ROE, ROA, debt-to-equity, and valuation metrics. Yum! Brands excels in asset efficiency (ROA) and DCF with a more balanced profile. McDonald’s relies heavily on cash flow stability, while Yum! leverages operational effectiveness for an edge.
Bankruptcy Risk: Solvency Showdown
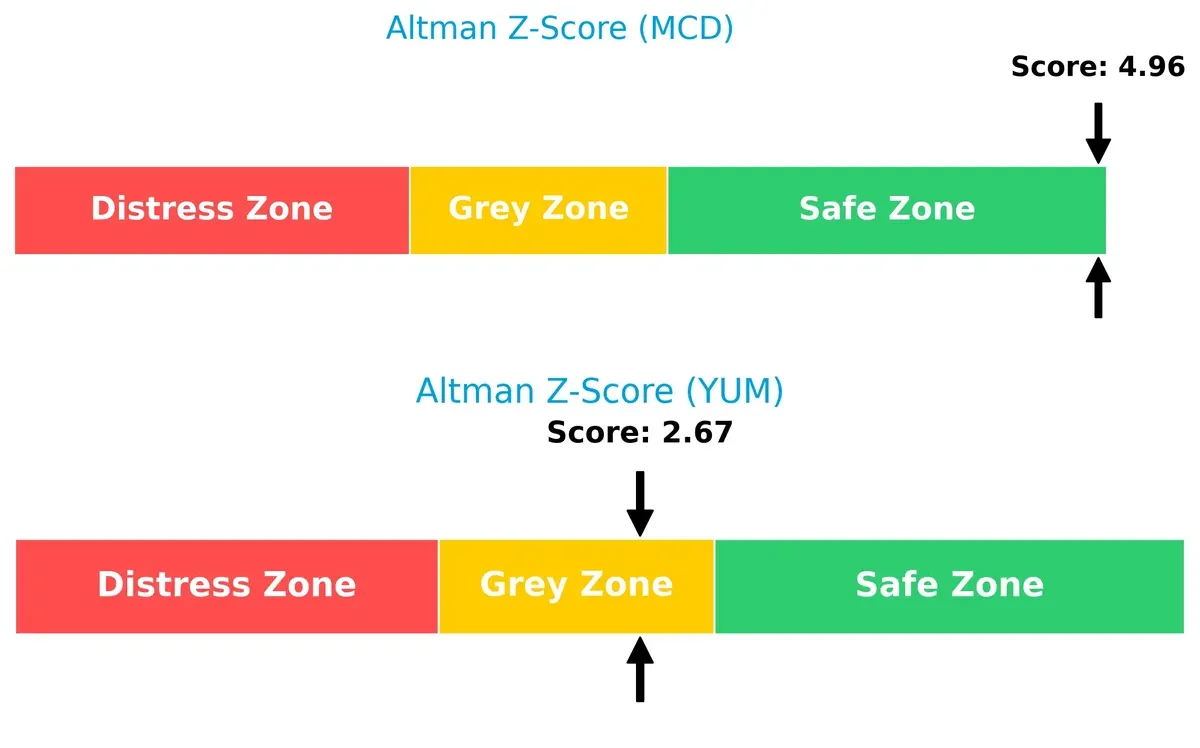
The Altman Z-Score difference suggests McDonald’s stands firmly in the safe zone, signaling strong long-term survival prospects. Yum! Brands sits in the grey zone, indicating moderate bankruptcy risk in this cycle:
Financial Health: Quality of Operations
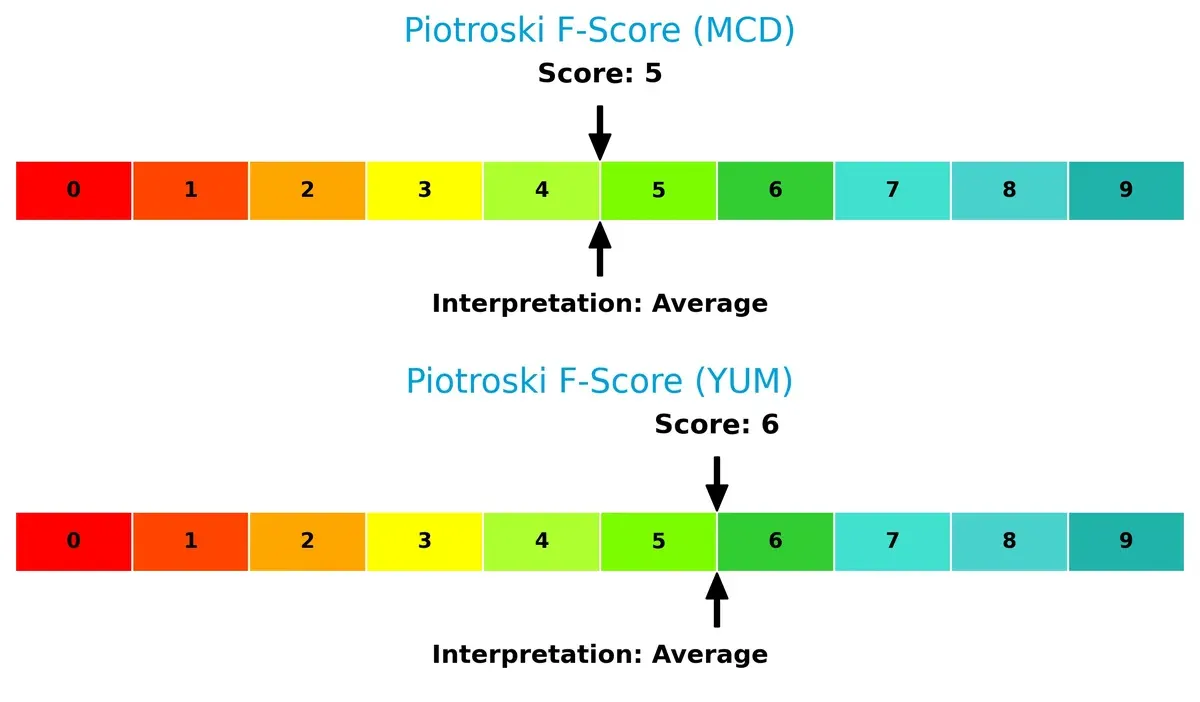
Both companies hold average Piotroski F-Scores, with Yum! slightly ahead at 6 versus McDonald’s 5. Neither shows critical red flags, but Yum!’s marginally better score points to healthier internal operations and financial quality:
How are the two companies positioned?
This section dissects the operational DNA of McDonald’s and Yum! Brands by comparing their revenue distribution and internal dynamics. The goal is to confront their economic moats and identify which model offers the most resilient competitive advantage today.
Revenue Segmentation: The Strategic Mix
This visual comparison dissects how McDonald’s Corporation and Yum! Brands, Inc. diversify their income streams and where their primary sector bets lie:
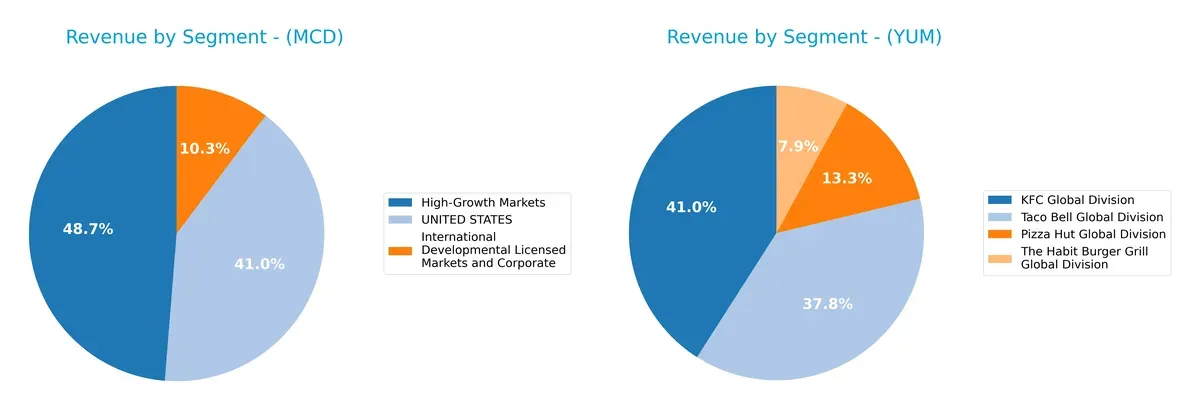
McDonald’s revenue pivots on three key segments: $12.6B from High-Growth Markets, $10.6B from the U.S., and $2.7B from International Licensed Markets. Yum! Brands shows a more balanced approach with $3.1B from KFC, $2.9B from Taco Bell, $1.0B from Pizza Hut, and $0.6B from Habit Burger Grill. McDonald’s concentration in growth markets signals infrastructure dominance, while Yum! mitigates risk through brand diversification.
Strengths and Weaknesses Comparison
This table compares the strengths and weaknesses of McDonald’s and Yum! Brands based on key financial and market factors:
McDonald’s Strengths
- Strong net margin at 31.85%
- Favorable debt-to-equity and interest coverage
- Large US and high-growth international revenues
Yum! Brands Strengths
- Favorable ROIC at 28.26% and WACC at 6.03%
- Positive asset and fixed asset turnover
- Diversified brand portfolio including KFC, Pizza Hut, Taco Bell
McDonald’s Weaknesses
- Unfavorable ROE and ROIC metrics
- Low liquidity ratios
- Unavailable WACC data
- PE ratio slightly unfavorable
Yum! Brands Weaknesses
- Negative ROE at -21.28%
- High debt-to-assets ratio at 145%
- PE ratio above 26
- Dividend yield neutral and lower than McDonald’s
McDonald’s demonstrates robust profitability and strong revenue diversification geographically, but it faces challenges in return metrics and liquidity. Yum! Brands excels in capital efficiency and operational turnover but carries higher financial leverage risks and weaker profitability returns. Each company’s strategy must address these contrasting financial profiles to sustain competitive positioning.
The Moat Duel: Analyzing Competitive Defensibility
A structural moat protects long-term profits from relentless competition erosion. Without it, market share and pricing power vanish quickly:
McDonald’s Corporation: Iconic Brand & Operational Scale
McDonald’s moat stems from its global brand recognition and unparalleled scale. This manifests in stable margins near 32% net and resilient revenue streams. New menu innovations and digital ordering could deepen its competitive edge in 2026.
Yum! Brands, Inc.: Multi-Brand Franchise Network
Yum! leverages a diversified franchise model across multiple cuisines, contrasting McDonald’s single-brand focus. It creates value with ROIC well above WACC, though profitability shows signs of decline. Expansion into emerging markets may offer growth upside.
Global Footprint vs. Brand Power: Who Holds the Deeper Moat?
McDonald’s scale and brand command wider moat territory, fueling superior margin stability. Yum! creates value but faces shrinking profitability, signaling a narrower moat. McDonald’s remains better positioned to defend market share long term.
Which stock offers better returns?
Over the past 12 months, McDonald’s and Yum! Brands exhibited steady price appreciation with sustained bullish trends and notable acceleration in their stock movements.
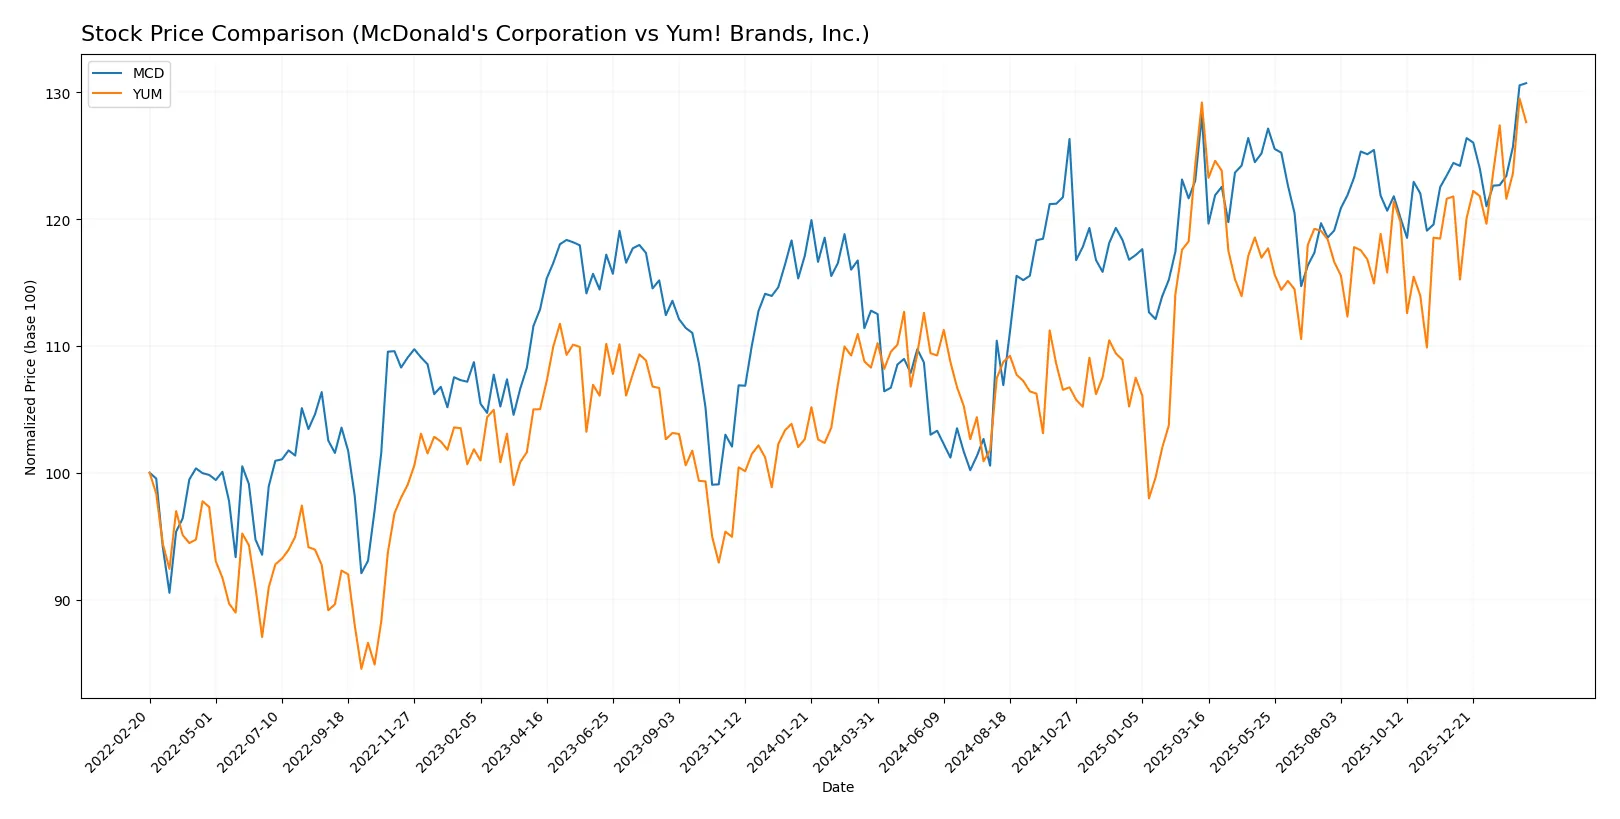
Trend Comparison
McDonald’s stock rose 15.9% over the past year, showing a bullish trend with accelerating momentum and a high volatility of 18.62%. It reached a peak at 327.58 and a low of 251.09.
Yum! Brands increased 17.87% in the same period, also displaying a bullish trend with acceleration but lower volatility at 8.81%. Its price ranged between 123.25 and 162.93.
Yum! Brands outperformed McDonald’s with a higher total return and less volatility, delivering the strongest market performance among the two.
Target Prices
Analysts present a cautiously optimistic consensus for McDonald’s Corporation and Yum! Brands, Inc.
| Company | Target Low | Target High | Consensus |
|---|---|---|---|
| McDonald’s Corporation | 315 | 380 | 347.65 |
| Yum! Brands, Inc. | 158 | 190 | 173.15 |
The target consensus for McDonald’s sits about 6% above its current price, signaling moderate upside. Yum! Brands’ consensus target exceeds its stock price by nearly 8%, reflecting analyst confidence despite recent volatility.

Don’t Let Luck Decide Your Entry Point
Optimize your entry points with our advanced ProRealTime indicators. You’ll get efficient buy signals with precise price targets for maximum performance. Start outperforming now!
How do institutions grade them?
Here is a summary of recent institutional grades for McDonald’s Corporation and Yum! Brands, Inc.:
McDonald’s Corporation Grades
The table below shows McDonald’s recent grades from various reputable institutions.
| Grading Company | Action | New Grade | Date |
|---|---|---|---|
| Argus Research | Upgrade | Buy | 2026-02-13 |
| Guggenheim | Maintain | Neutral | 2026-02-13 |
| RBC Capital | Maintain | Sector Perform | 2026-02-12 |
| UBS | Maintain | Buy | 2026-02-12 |
| TD Cowen | Maintain | Hold | 2026-02-12 |
| Barclays | Maintain | Overweight | 2026-02-12 |
| Piper Sandler | Maintain | Neutral | 2026-02-12 |
| BTIG | Maintain | Buy | 2026-02-12 |
| Citigroup | Maintain | Buy | 2026-02-12 |
| Wells Fargo | Maintain | Overweight | 2026-02-12 |
Yum! Brands, Inc. Grades
Below are Yum! Brands’ recent grades from established grading firms.
| Grading Company | Action | New Grade | Date |
|---|---|---|---|
| TD Cowen | Maintain | Buy | 2026-02-05 |
| Citigroup | Maintain | Neutral | 2026-02-05 |
| Wells Fargo | Maintain | Equal Weight | 2026-02-05 |
| Citigroup | Maintain | Neutral | 2026-01-22 |
| Morgan Stanley | Maintain | Equal Weight | 2026-01-20 |
| Gordon Haskett | Upgrade | Buy | 2026-01-08 |
| Oppenheimer | Downgrade | Perform | 2026-01-07 |
| Barclays | Maintain | Overweight | 2026-01-07 |
| TD Cowen | Upgrade | Buy | 2025-11-17 |
| Bernstein | Maintain | Market Perform | 2025-11-05 |
Which company has the best grades?
McDonald’s holds a stronger consensus with multiple “Buy” and “Overweight” ratings, while Yum! Brands has more mixed grades including “Neutral” and “Equal Weight.” This suggests McDonald’s currently enjoys more robust institutional confidence, potentially influencing investor sentiment and valuation.
Risks specific to each company
The following categories identify the critical pressure points and systemic threats facing both firms in the 2026 market environment:
1. Market & Competition
McDonald’s Corporation
- Dominates global QSR with 40K+ locations but faces saturation and intense rivalry.
Yum! Brands, Inc.
- Strong multi-brand presence worldwide, but competitive pressure from local and global chains is rising.
2. Capital Structure & Debt
McDonald’s Corporation
- Low debt ratios and strong interest coverage support financial stability.
Yum! Brands, Inc.
- High debt-to-assets ratio (145%) signals elevated financial risk despite decent interest coverage.
3. Stock Volatility
McDonald’s Corporation
- Beta of 0.53 indicates low volatility and defensive stock behavior.
Yum! Brands, Inc.
- Beta of 0.66 shows moderate volatility, exposing investors to higher market swings.
4. Regulatory & Legal
McDonald’s Corporation
- Global footprint exposes it to varied food safety and labor regulations, increasing compliance costs.
Yum! Brands, Inc.
- Similar regulatory environment with added risks in emerging markets with less stable legal frameworks.
5. Supply Chain & Operations
McDonald’s Corporation
- Extensive supply network is a strength but vulnerable to commodity price inflation.
Yum! Brands, Inc.
- Diverse brand portfolio complicates supply chain resilience amid global disruptions.
6. ESG & Climate Transition
McDonald’s Corporation
- Increasing pressure to reduce carbon footprint and improve packaging sustainability.
Yum! Brands, Inc.
- Faces similar ESG challenges but opportunities to leverage brand differentiation in climate policies.
7. Geopolitical Exposure
McDonald’s Corporation
- High exposure to US and European markets with geopolitical tensions impacting operations.
Yum! Brands, Inc.
- Greater exposure to emerging markets adds risk but also growth potential amid geopolitical shifts.
Which company shows a better risk-adjusted profile?
McDonald’s biggest risk is market saturation coupled with regulatory complexity. Yum’s primary risk is its stretched balance sheet and high debt load. Despite Yum’s higher financial leverage, it holds a favorable overall ratio profile. However, McDonald’s lower volatility and strong capital structure offer a safer risk-adjusted position. Recent financial data highlight Yum’s elevated debt-to-assets ratio (145%) as a critical red flag, while McDonald’s stable Altman Z-Score (4.96) confirms its resilience. I favor McDonald’s for prudent risk management in 2026.
Final Verdict: Which stock to choose?
McDonald’s superpower lies in its unmatched operational efficiency and robust cash flow generation, sustaining steady growth despite a challenging macro backdrop. Its main point of vigilance is the declining return on invested capital, signaling potential pressure on long-term value creation. This stock suits an Aggressive Growth portfolio willing to embrace cyclical risks for market leadership.
Yum! Brands boasts a strategic moat rooted in superior capital efficiency and a strong return on invested capital well above its cost of capital. It offers a more favorable financial stability profile than McDonald’s, with a solid income growth trajectory. Yum! fits a GARP portfolio, balancing growth prospects with reasonable risk controls.
If you prioritize operational resilience and cash generation underpinned by global scale, McDonald’s is the compelling choice due to its entrenched market position. However, if you seek superior capital efficiency with potentially better stability in earnings growth, Yum! Brands offers a slightly more attractive risk-return profile. Both present analytical scenarios tailored to distinct investor risk appetites.
Disclaimer: Investment carries a risk of loss of initial capital. The past performance is not a reliable indicator of future results. Be sure to understand risks before making an investment decision.
Go Further
I encourage you to read the complete analyses of McDonald’s Corporation and Yum! Brands, Inc. to enhance your investment decisions: