Home > Comparison > Consumer Cyclical > MCD vs SBUX
The strategic rivalry between McDonald’s Corporation and Starbucks Corporation shapes the global restaurant industry’s dynamics. McDonald’s operates as a capital-intensive, globally franchised fast-food giant, while Starbucks leads as a premium specialty coffee retailer with a strong emphasis on brand experience. This head-to-head reflects a clash between scale-driven efficiency and brand-driven growth. This analysis aims to identify which business model offers superior risk-adjusted returns for a diversified investor portfolio in the evolving consumer cyclical landscape.

Table of contents
Companies Overview
McDonald’s and Starbucks stand as titans in the global restaurant industry, each commanding vast consumer loyalty and expansive footprints.
McDonald’s Corporation: The Global Fast-Food Powerhouse
McDonald’s dominates the quick-service restaurant market with a focus on hamburgers, chicken, and breakfast items. Its core revenue engine is franchising and operating over 40K restaurants worldwide. In 2026, the company emphasizes digital ordering and drive-thru efficiency to boost customer convenience and operational scalability.
Starbucks Corporation: The Specialty Coffee Leader
Starbucks leads the specialty coffee segment with a portfolio spanning coffee beverages, food, and retail products. Its revenue model combines company-operated and licensed stores globally, totaling about 34K locations. The firm prioritizes premium brand expansion and innovation in ready-to-drink offerings to capture evolving consumer tastes.
Strategic Collision: Similarities & Divergences
Both companies thrive on strong brand loyalty but diverge in product focus: McDonald’s bets on a broad menu and speed, while Starbucks invests in premium coffee experiences. Their primary battleground is consumer convenience and global market penetration. Investors should note McDonald’s stable franchise model contrasts with Starbucks’ growth-driven, innovation-focused profile.
Income Statement Comparison
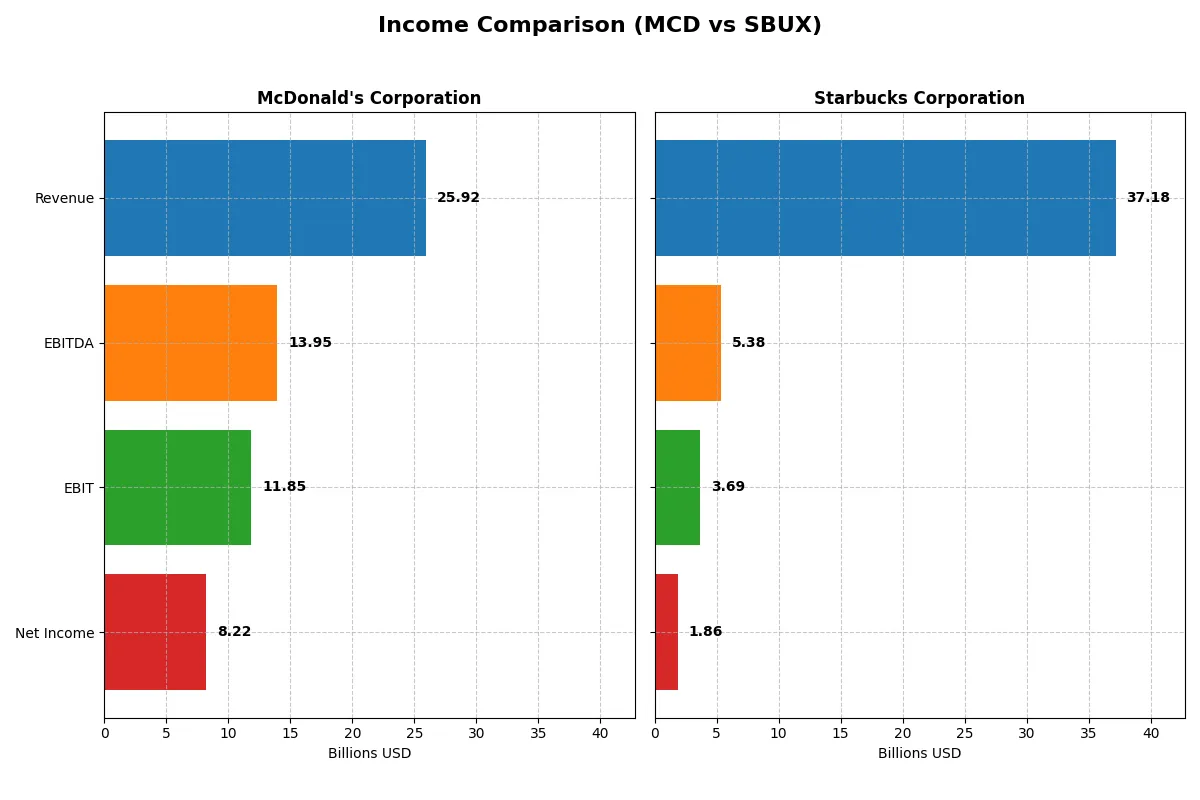
This data dissects the core profitability and scalability of both corporate engines to reveal who dominates the bottom line:
| Metric | McDonald’s (MCD) | Starbucks (SBUX) |
|---|---|---|
| Revenue | 25.9B | 36.2B |
| Cost of Revenue | 11.2B | 26.5B |
| Operating Expenses | 3.0B | 4.3B |
| Gross Profit | 14.7B | 9.7B |
| EBITDA | 13.9B | 7.1B |
| EBIT | 11.9B | 5.5B |
| Interest Expense | 1.5B | 562M |
| Net Income | 8.2B | 3.8B |
| EPS | 11.45 | 3.31 |
| Fiscal Year | 2024 | 2024 |
Income Statement Analysis: The Bottom-Line Duel
This income statement comparison reveals which company runs a more efficient and profitable business engine through detailed revenue and margin analysis.
McDonald’s Corporation Analysis
McDonald’s shows steady revenue growth from $19.2B in 2020 to $25.9B in 2024, with net income surging from $4.7B to $8.2B. Gross margins stay healthy around 56.7%, and net margins are robust at 31.7%. Despite slight recent margin softness, McDonald’s demonstrates strong operational efficiency and solid long-term momentum.
Starbucks Corporation Analysis
Starbucks’ revenue rose from $29.1B in 2021 to $37.2B in 2025, yet net income declined sharply from $4.2B to $1.9B. Its gross margin remains moderate at 24.1%, but net margin is thin at 5.0%. Recent years reveal margin compression and profitability erosion, highlighting operational challenges despite top-line growth.
Margin Strength vs. Profitability Decline
McDonald’s delivers superior margin control and consistent profit expansion, outpacing Starbucks significantly on net income growth. Starbucks’ higher revenue scale contrasts with weakening profitability and margin shrinkage. For investors prioritizing earnings quality and margin resilience, McDonald’s profile offers a clearer, more dependable fundamental advantage.
Financial Ratios Comparison
These vital ratios act as a diagnostic tool to expose the underlying fiscal health, valuation premiums, and capital efficiency of the companies compared below:
| Ratios | McDonald’s Corporation (MCD) | Starbucks Corporation (SBUX) |
|---|---|---|
| ROE | -2.17% | -0.23% |
| ROIC | 17.9% | 8.48% |
| P/E | 25.32 | 52.58 |
| P/B | -54.85 | -12.06 |
| Current Ratio | 1.19 | 0.72 |
| Quick Ratio | 1.18 | 0.51 |
| D/E (Debt/Equity) | -13.68 | -3.29 |
| Debt-to-Assets | 94.14% | 83.11% |
| Interest Coverage | 7.78 | 6.60 |
| Asset Turnover | 0.47 | 1.16 |
| Fixed Asset Turnover | 0.67 | 2.09 |
| Payout ratio | 59.2% | 149.3% |
| Dividend yield | 2.34% | 2.84% |
| Fiscal Year | 2024 | 2025 |
Efficiency & Valuation Duel: The Vital Signs
Financial ratios act as a company’s DNA, revealing hidden risks and operational excellence that shape investment decisions.
McDonald’s Corporation
McDonald’s posts a strong net margin of 31.7%, signaling operational efficiency despite a negative ROE at -216.6%. Its P/E ratio of 25.3 suggests a somewhat stretched valuation. The company returns value via a 2.34% dividend yield, favoring steady shareholder income over aggressive growth or R&D reinvestment.
Starbucks Corporation
Starbucks shows a weaker net margin of 5.0% and a negative ROE of -22.9%, indicating profitability challenges. Its high P/E of 52.6 marks the stock as expensive. Starbucks balances this with a 2.84% dividend yield, suggesting modest shareholder returns amid reinvestment focused on operational improvements rather than rapid expansion.
Operational Efficiency vs. Premium Valuation
McDonald’s offers a superior balance of profitability and moderate valuation risk compared to Starbucks’ stretched price and weaker margins. Investors seeking operational stability may prefer McDonald’s, while those tolerant of premium multiples for growth might consider Starbucks’ profile.
Which one offers the Superior Shareholder Reward?
I see McDonald’s and Starbucks pursue contrasting distribution strategies. McDonald’s yields ~2.3% with a ~59% payout ratio, well covered by strong free cash flow (~70%). It pairs dividends with robust buybacks, fueling shareholder value sustainably. Starbucks offers a slightly higher yield (~2.8%) but pays out nearly 150% of earnings, signaling dividend risk. Its buyback program is less intense, and free cash flow coverage is weaker (~51%). Starbucks’s reinvestment leans on growth and acquisitions, stressing capital allocation. I judge McDonald’s distribution model more sustainable and attractive for total returns in 2026.
Comparative Score Analysis: The Strategic Profile
The radar chart reveals the fundamental DNA and trade-offs of McDonald’s and Starbucks, highlighting their core strengths and strategic weaknesses side by side:
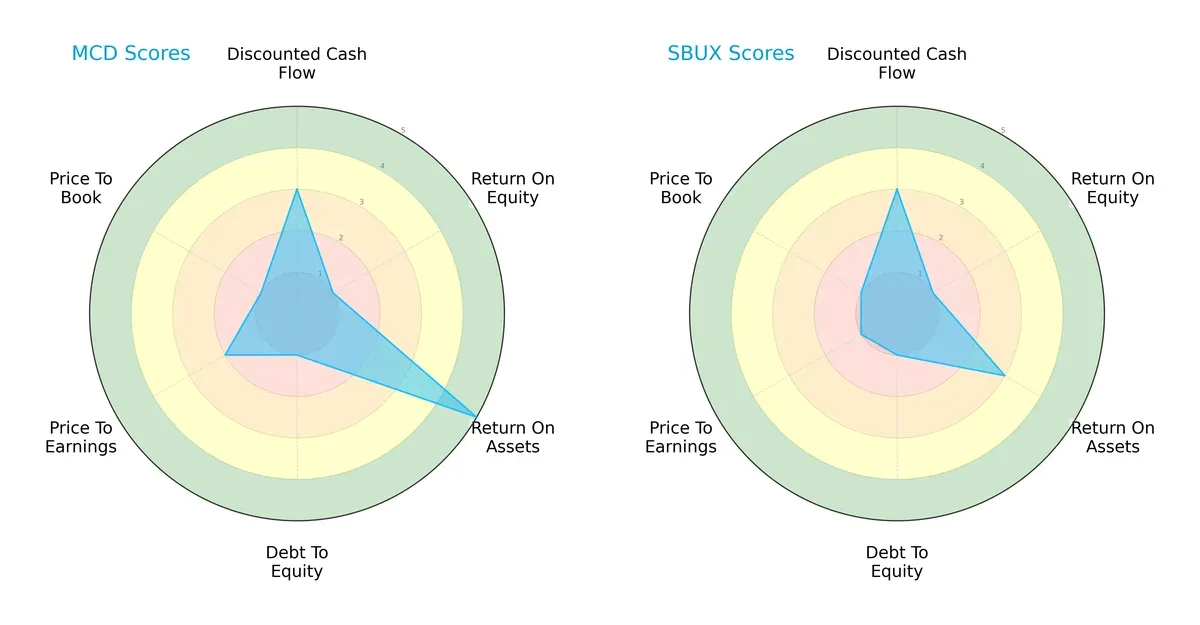
McDonald’s excels in asset efficiency with a top ROA score (5) versus Starbucks’ moderate 3. However, McDonald’s weak ROE (1) and high leverage (Debt/Equity score 1) mirror Starbucks’ similar struggles on these fronts. Starbucks suffers a more pronounced valuation discount (P/E score 1 vs. McDonald’s 2). McDonald’s profile is more balanced, leveraging asset use, while Starbucks relies on growth potential despite valuation pressures.
Bankruptcy Risk: Solvency Showdown
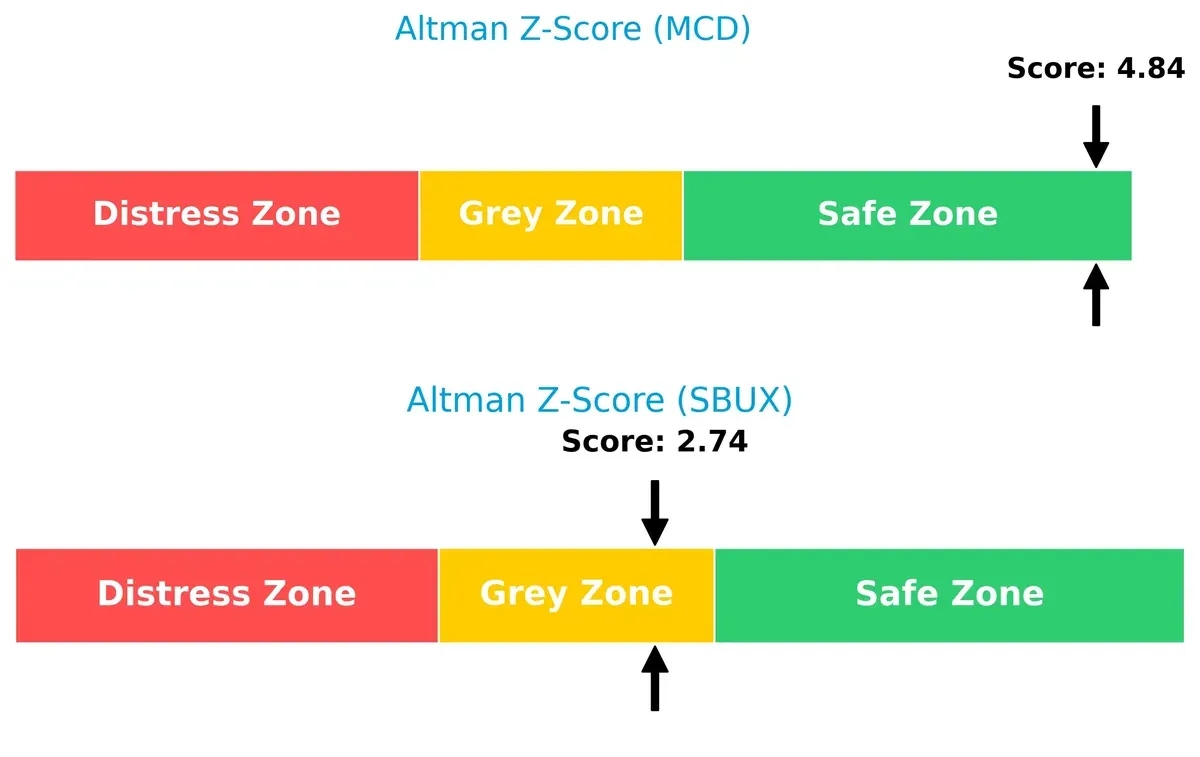
McDonald’s Altman Z-Score of 4.84 places it firmly in the safe zone, signaling strong financial resilience. Starbucks, scoring 2.74 in the grey zone, faces moderate bankruptcy risk amid current market cycles:
Financial Health: Quality of Operations
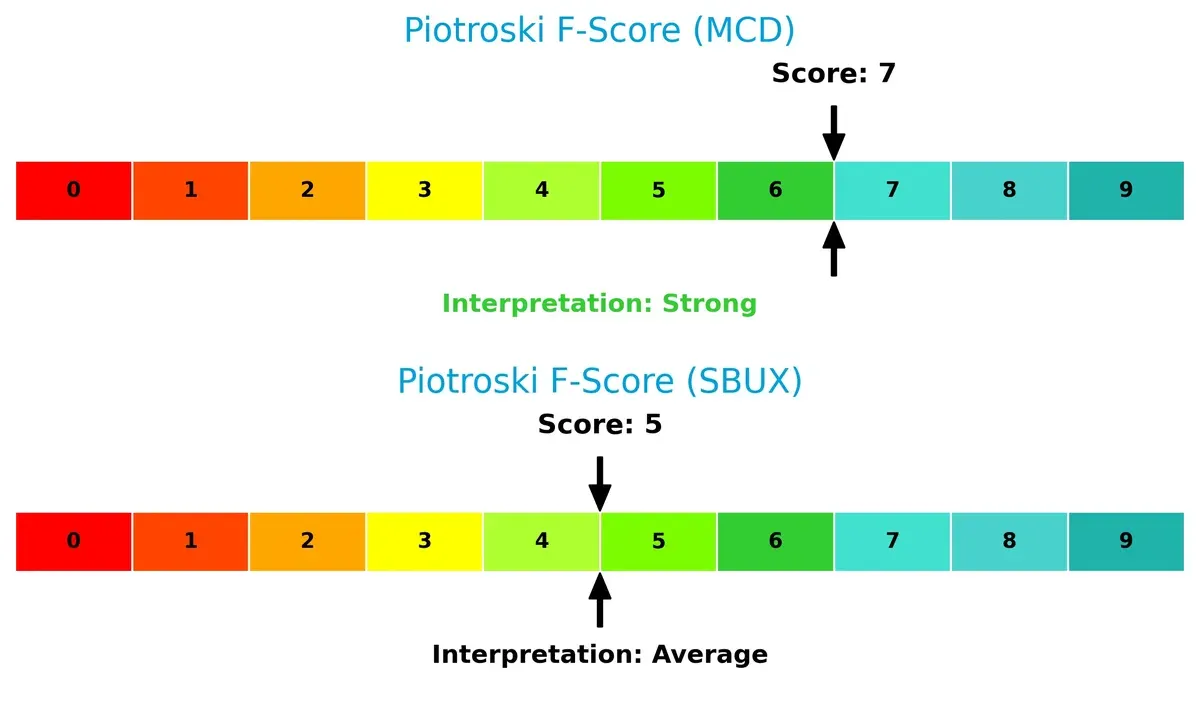
McDonald’s Piotroski F-Score of 7 indicates robust financial health with solid profitability and efficiency metrics. Starbucks’ score of 5 suggests average strength, revealing some internal red flags compared to McDonald’s higher operational quality:
How are the two companies positioned?
This section dissects McDonald’s and Starbucks’ operational DNA by comparing their revenue distribution and internal dynamics. The goal is to confront their economic moats to identify the most resilient competitive advantage today.
Revenue Segmentation: The Strategic Mix
This comparison dissects how McDonald’s and Starbucks diversify their income streams and reveals where their primary sector bets lie:
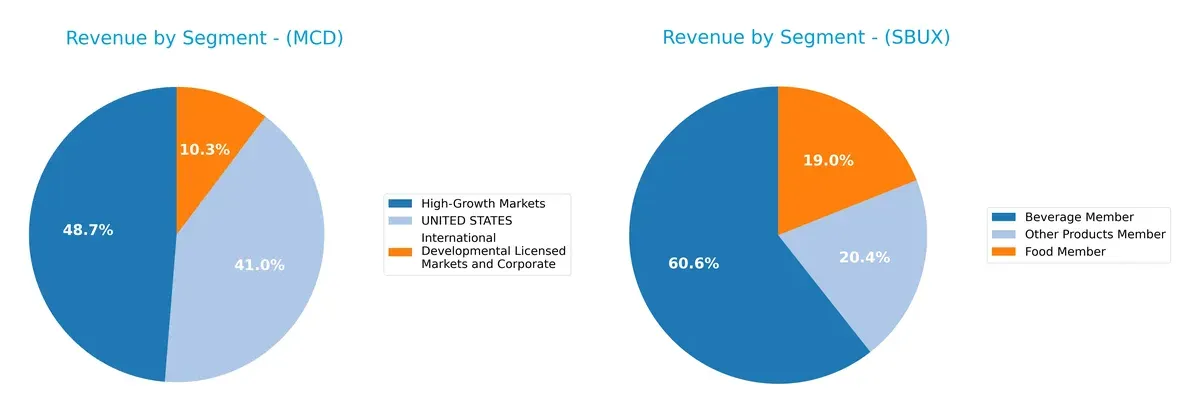
McDonald’s revenue pivots around three segments: High-Growth Markets ($12.6B), the U.S. ($10.6B), and International Licensed ($2.7B). Starbucks shows a broader portfolio with Beverage ($22.5B), Food ($7B), and Other Products ($7.6B). Starbucks leans on beverage dominance but balances risk with strong food and product lines. McDonald’s relies more heavily on geographic segmentation, anchoring growth in emerging markets and the U.S., which carries regional concentration risk.
Strengths and Weaknesses Comparison
This table compares the Strengths and Weaknesses of McDonald’s and Starbucks based on diversification, profitability, financials, innovation, global presence, and market share:
McDonald’s Strengths
- High net margin of 31.72%
- Favorable ROIC of 17.92% above WACC
- Strong global presence with diversified geographic revenues
- Favorable quick ratio and interest coverage
- Dividend yield at 2.34% supports shareholder returns
Starbucks Strengths
- Strong asset turnover at 1.16 indicates efficient use of assets
- Favorable interest coverage and dividend yield of 2.84%
- Diverse product segmentation with strong beverage sales
- Significant US market dominance with high revenue
- Favorable debt/equity ratio and manageable WACC
McDonald’s Weaknesses
- Negative ROE at -216.62% signals shareholder value erosion
- High debt to assets ratio at 94.14% raises financial risk
- Unfavorable P/E ratio of 25.32 may indicate valuation concerns
- Low asset and fixed asset turnover suggest operational inefficiency
- Neutral current ratio at 1.19 could limit liquidity buffer
Starbucks Weaknesses
- Low net margin of 4.99% reflects weak profitability
- Negative ROE of -22.93% is a red flag for investors
- Unfavorable current and quick ratios indicate liquidity stress
- High P/E ratio of 52.58 suggests overvaluation risk
- Debt to assets at 83.11% signals leverage concerns
Both companies exhibit strong global presence and yield attractive dividends, but McDonald’s profitability metrics and Starbucks’ liquidity ratios present key challenges. These factors reflect distinct strategic priorities and financial health aspects investors should monitor closely.
The Moat Duel: Analyzing Competitive Defensibility
A structural moat is the only reliable shield protecting long-term profits from relentless competitive erosion:
McDonald’s Corporation: Franchise Power with Operational Excellence
I see McDonald’s moat rooted in its extensive franchising model and brand scale, driving high ROIC (12.2% above WACC) and stable margins. Its growing ROIC trend signals durable advantage, with 40K+ restaurants and global reach deepening this moat in 2026.
Starbucks Corporation: Premium Brand and Experience Differentiation
Starbucks relies on its strong brand loyalty and premium experience, but its ROIC barely clears WACC and is declining (-43%), suggesting weaker capital efficiency. The company faces margin pressure but opportunities remain in international expansion and product innovation.
Franchise Scale vs. Brand Premium: The Moat Showdown
McDonald’s clearly holds a wider and deeper moat, evidenced by superior ROIC and margin stability. Starbucks’ premium positioning is vulnerable amid declining profitability. McDonald’s is better equipped to defend and grow its market share in 2026.
Which stock offers better returns?
The past year shows McDonald’s gaining 14.11%, with decelerating momentum after a strong run. Starbucks edged up 1.74%, accelerating recently on higher short-term gains.
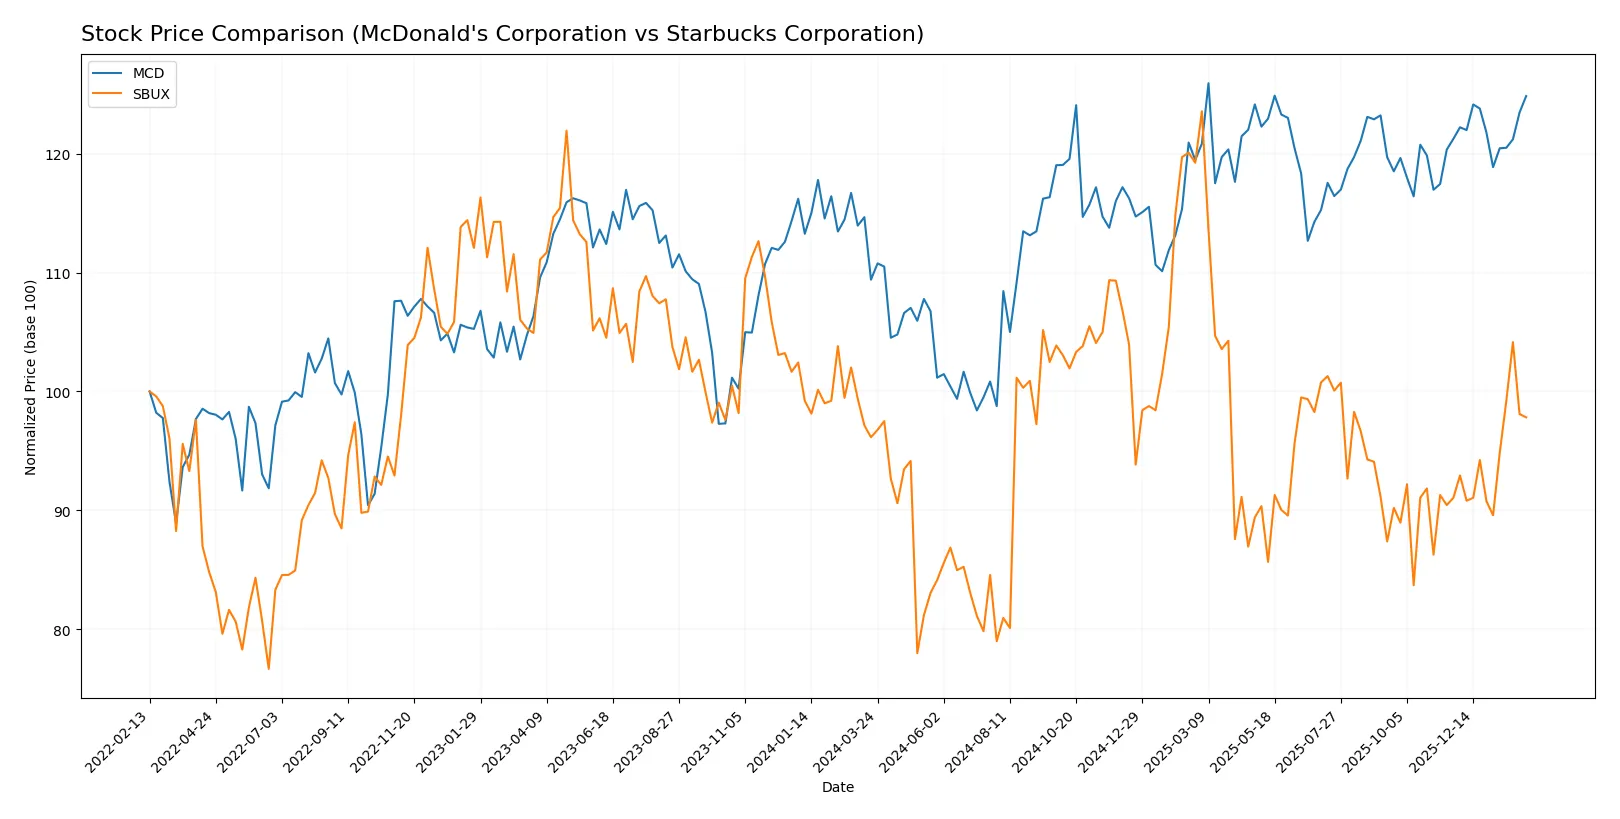
Trend Comparison
McDonald’s stock rose 14.11% over 12 months, marking a bullish trend with decelerating price gains and a high volatility of 18.26%. The range spanned from 251.09 to 321.29.
Starbucks gained 1.74% in the same period, reflecting a neutral trend overall but recent acceleration with a 7.43% rise in three months. Volatility is moderate at 8.86%.
McDonald’s delivered stronger annual returns than Starbucks. Despite deceleration, McDonald’s trend outperforms Starbucks’ modest yearly gain and recent acceleration.
Target Prices
Analysts present a cautiously optimistic outlook for McDonald’s and Starbucks with moderate upside potential.
| Company | Target Low | Target High | Consensus |
|---|---|---|---|
| McDonald’s Corporation | 295 | 372 | 337.14 |
| Starbucks Corporation | 90 | 165 | 107.47 |
McDonald’s target consensus at 337.14 suggests roughly 6% upside from the current 318.53 price. Starbucks shows a wider range, with consensus at 107.47 signaling about 17% potential gain.

Don’t Let Luck Decide Your Entry Point
Optimize your entry points with our advanced ProRealTime indicators. You’ll get efficient buy signals with precise price targets for maximum performance. Start outperforming now!
How do institutions grade them?
Institutional grades for McDonald’s Corporation and Starbucks Corporation are as follows:
McDonald’s Corporation Grades
This table summarizes recent institutional grades for McDonald’s Corporation:
| Grading Company | Action | New Grade | Date |
|---|---|---|---|
| BTIG | Upgrade | Buy | 2026-02-02 |
| Keybanc | Maintain | Overweight | 2026-01-09 |
| Truist Securities | Maintain | Buy | 2026-01-08 |
| TD Cowen | Maintain | Hold | 2026-01-08 |
| Barclays | Maintain | Overweight | 2026-01-07 |
| Oppenheimer | Upgrade | Outperform | 2026-01-06 |
| Guggenheim | Maintain | Neutral | 2025-11-19 |
| Wells Fargo | Maintain | Overweight | 2025-11-06 |
| Barclays | Maintain | Overweight | 2025-11-06 |
| Baird | Maintain | Neutral | 2025-11-06 |
Starbucks Corporation Grades
This table summarizes recent institutional grades for Starbucks Corporation:
| Grading Company | Action | New Grade | Date |
|---|---|---|---|
| Piper Sandler | Maintain | Overweight | 2026-01-30 |
| Barclays | Maintain | Overweight | 2026-01-30 |
| BTIG | Maintain | Buy | 2026-01-30 |
| TD Cowen | Maintain | Hold | 2026-01-30 |
| BTIG | Maintain | Buy | 2026-01-29 |
| Wells Fargo | Maintain | Overweight | 2026-01-29 |
| RBC Capital | Maintain | Outperform | 2026-01-29 |
| Wells Fargo | Maintain | Overweight | 2026-01-27 |
| Mizuho | Maintain | Neutral | 2026-01-26 |
| William Blair | Upgrade | Outperform | 2026-01-23 |
Which company has the best grades?
Both companies receive predominantly positive grades, with multiple “Buy,” “Overweight,” and “Outperform” ratings. McDonald’s shows recent upgrades, including a move to “Buy” and “Outperform.” Starbucks also maintains strong grades with several “Overweight” and “Outperform” ratings. Investors may view these positive grades as signals of institutional confidence but should consider the broader context.
Risks specific to each company
The following categories identify critical pressure points and systemic threats facing McDonald’s Corporation and Starbucks Corporation in the 2026 market environment:
1. Market & Competition
McDonald’s Corporation
- Dominates quick-service with 40K+ restaurants but faces saturation risks and evolving consumer tastes.
Starbucks Corporation
- Specialty coffee niche with 33K+ stores, but intense competition and shifting consumer preferences pressure growth.
2. Capital Structure & Debt
McDonald’s Corporation
- High debt-to-assets ratio at 94% signals leverage risk despite favorable interest coverage.
Starbucks Corporation
- Debt-to-assets at 83% also high; weaker liquidity ratios (current 0.72) raise solvency concerns.
3. Stock Volatility
McDonald’s Corporation
- Beta of 0.53 implies lower volatility, offering defensive qualities in turbulent markets.
Starbucks Corporation
- Beta near 0.96 suggests higher sensitivity to market swings, increasing investor risk.
4. Regulatory & Legal
McDonald’s Corporation
- Operating globally, faces evolving food safety, labor, and franchise regulations.
Starbucks Corporation
- International footprint exposes it to diverse regulatory regimes, including labeling and environmental standards.
5. Supply Chain & Operations
McDonald’s Corporation
- Large scale benefits supply chain resilience but poses complexity in raw material sourcing.
Starbucks Corporation
- Dependence on coffee bean supply exposes vulnerability to climate and geopolitical disruptions.
6. ESG & Climate Transition
McDonald’s Corporation
- Under pressure to improve sustainability practices amid rising consumer and regulatory ESG demands.
Starbucks Corporation
- Active on climate initiatives but faces challenges reducing carbon footprint across global operations.
7. Geopolitical Exposure
McDonald’s Corporation
- Broad international presence subjects it to currency, trade tensions, and regional instability risks.
Starbucks Corporation
- Similarly exposed but with heavier reliance on emerging markets that carry greater geopolitical uncertainty.
Which company shows a better risk-adjusted profile?
McDonald’s shows a better risk-adjusted profile, balancing scale advantages and lower stock volatility against high leverage. Starbucks faces liquidity and profitability challenges, compounded by higher market sensitivity and geopolitical risks. McDonald’s Altman Z-score at 4.8 confirms solid financial health, while Starbucks’ 2.7 signals caution.
Final Verdict: Which stock to choose?
McDonald’s superpower lies in its durable competitive advantage and strong cash generation, supported by a very favorable economic moat with growing ROIC. Its point of vigilance is the relatively high debt load, which could pressure financial flexibility. It suits portfolios focused on stable, long-term value creation with moderate growth expectations.
Starbucks commands a strategic moat through strong brand loyalty and global footprint, but its profitability and ROIC trends signal weakening efficiency. Compared to McDonald’s, it carries more financial risk and operational challenges, making it more appropriate for investors favoring growth at a reasonable price with tolerance for volatility.
If you prioritize durable value creation and financial stability, McDonald’s outshines Starbucks due to its superior capital efficiency and moat durability. However, if your strategy seeks accelerated growth potential despite higher risk, Starbucks offers a more dynamic but less certain profile. Both cases require careful risk assessment aligned with investor risk tolerance.
Disclaimer: Investment carries a risk of loss of initial capital. The past performance is not a reliable indicator of future results. Be sure to understand risks before making an investment decision.
Go Further
I encourage you to read the complete analyses of McDonald’s Corporation and Starbucks Corporation to enhance your investment decisions: