Home > Comparison > Consumer Defensive > MKC vs SJM
The strategic rivalry between McCormick & Company and The J. M. Smucker Company shapes the Packaged Foods industry’s evolution. McCormick operates as a global flavor solutions provider with broad consumer and industrial reach. In contrast, Smucker focuses on diversified branded food and pet products with strong retail penetration. This analysis will clarify which company’s operational focus offers a superior risk-adjusted return for a diversified portfolio navigating consumer defensive dynamics.
Table of contents
Companies Overview
McCormick & Company and The J. M. Smucker Company both command significant presence in the global packaged foods sector.
McCormick & Company, Incorporated: Global Flavor Leader
McCormick dominates the spices and seasoning market, generating revenue through branded consumer products and flavor solutions for food manufacturers. Its strategic focus in 2026 centers on expanding its global footprint and innovation in flavor blends, leveraging iconic brands like French’s and Old Bay to drive growth in diversified retail and foodservice channels.
The J. M. Smucker Company: Diversified Packaged Foods Powerhouse
Smucker commands a broad portfolio spanning pet foods, coffee, and consumer foods. It monetizes through branded products such as Folgers coffee and Meow Mix pet food, targeting multiple retail segments. In 2026, its strategy emphasizes strengthening pet food and coffee categories while optimizing distribution across mass merchandisers and specialty stores to capture evolving consumer preferences.
Strategic Collision: Similarities & Divergences
Both firms leverage strong brand portfolios within the packaged foods industry but diverge in their core business models—McCormick focuses on flavor innovation and B2B partnerships, whereas Smucker prioritizes diversified consumer staples with a significant pet food presence. Their primary battleground lies in retail shelf space and consumer loyalty. Each offers distinct investment profiles: McCormick’s niche specialization contrasts with Smucker’s broad-based consumer exposure.
Income Statement Comparison
The following data dissects the core profitability and scalability of both corporate engines to reveal who dominates the bottom line:
| Metric | McCormick & Company, Incorporated (MKC) | The J. M. Smucker Company (SJM) |
|---|---|---|
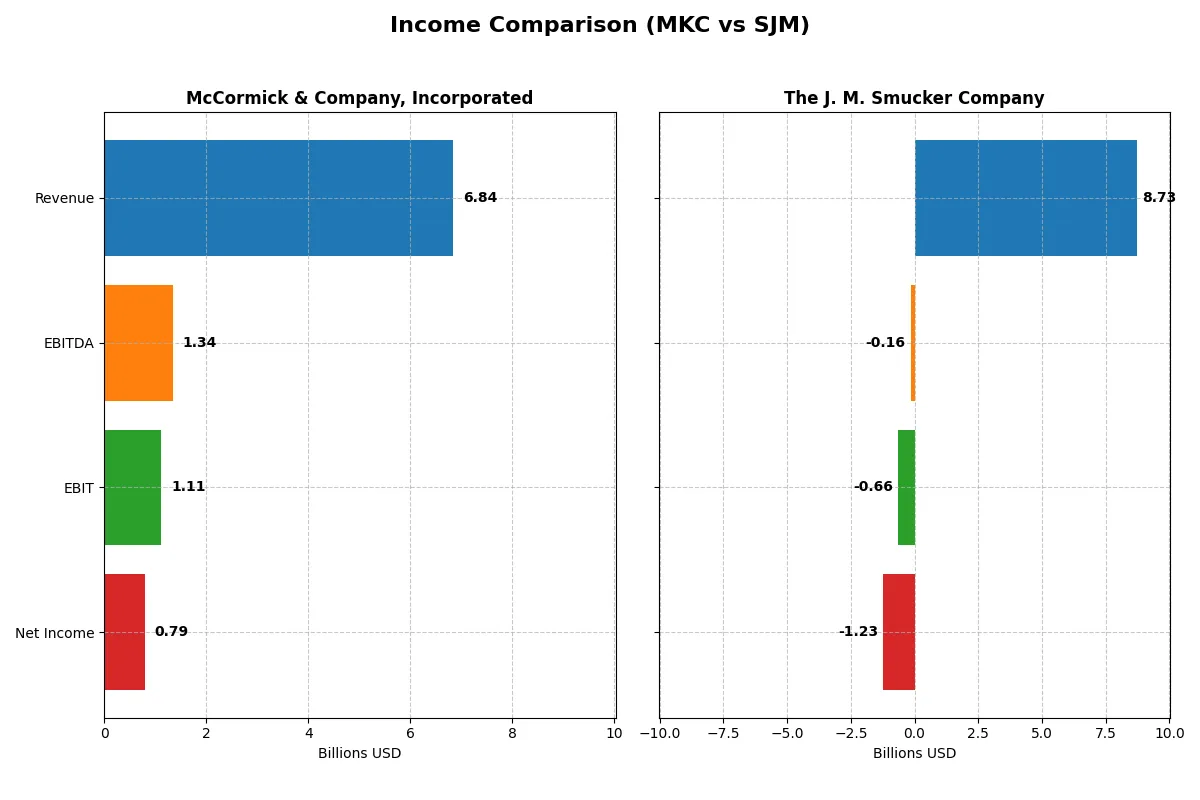
| Revenue | 6.84B | 8.73B |
| Cost of Revenue | 4.25B | 5.34B |
| Operating Expenses | 1.50B | 4.06B |
| Gross Profit | 2.59B | 3.38B |
| EBITDA | 1.34B | -156M |
| EBIT | 1.11B | -658M |
| Interest Expense | 196M | 359M |
| Net Income | 789M | -1.23B |
| EPS | 2.94 | -11.57 |
| Fiscal Year | 2025 | 2025 |
Income Statement Analysis: The Bottom-Line Duel
This income statement comparison reveals the true efficiency and profitability of two distinct corporate engines in the consumer staples sector.
McCormick & Company, Incorporated Analysis
McCormick’s revenue increased steadily by 8.3% over five years, reaching $6.84B in 2025. Net income showed moderate growth, hitting $789M, reflecting strong margin control. Gross margin remains healthy at 37.9%, supporting a solid 11.5% net margin. The company sustains operational efficiency with flat EBIT growth and stable EPS, signaling consistent momentum.
The J. M. Smucker Company Analysis
Smucker’s revenue rose 9% over five years, peaking at $8.73B in 2025. However, it reported a net loss of $1.23B, driven by negative EBIT margin of -7.5%. Despite a favorable gross margin near 38.8%, soaring operating and other expenses eroded profitability. The sharp deterioration in net margin and EPS over one year signals severe operational distress and declining momentum.
Margin Discipline vs. Revenue Expansion
McCormick demonstrates disciplined margin management and steady profit growth, making profitability its core strength. Smucker, despite higher revenue, struggles with escalating costs, resulting in deep losses. For investors, McCormick’s profile offers more reliable earnings and margin stability, while Smucker’s challenges raise significant caution on operational efficiency.
Financial Ratios Comparison
These vital ratios act as a diagnostic tool to expose the underlying fiscal health, valuation premiums, and capital efficiency of the companies compared below:
| Ratios | McCormick (MKC) | J.M. Smucker (SJM) |
|---|---|---|
| ROE | 13.76% | -20.23% |
| ROIC | 7.93% | -4.33% |
| P/E | 22.59 | -10.05 |
| P/B | 3.11 | 2.03 |
| Current Ratio | 0.70 | 0.81 |
| Quick Ratio | 0.28 | 0.35 |
| D/E | 0.70 | 1.28 |
| Debt-to-Assets | 30.27% | 44.19% |
| Interest Coverage | 5.57 | -1.88 |
| Asset Turnover | 0.52 | 0.50 |
| Fixed Asset Turnover | 4.72 | 2.73 |
| Payout Ratio | 61.19% | -37.00% |
| Dividend Yield | 2.71% | 3.68% |
| Fiscal Year | 2025 | 2025 |
Efficiency & Valuation Duel: The Vital Signs
Financial ratios act as a company’s DNA, uncovering hidden risks and operational excellence behind its market performance and stability.
McCormick & Company, Incorporated
McCormick shows solid profitability with a 13.76% ROE and an 11.54% net margin, indicating efficient core operations. Its P/E of 22.59 suggests a fairly valued stock, though a 3.11 P/B hints at a stretched price. The firm rewards shareholders with a 2.71% dividend yield, balancing returns and reinvestment prudently.
The J. M. Smucker Company
Smucker suffers from poor profitability, posting negative ROE (-20.23%) and net margin (-14.1%), reflecting operational challenges. Its negative P/E is favorable only in technical terms, given earnings losses. Despite financial strain, it offers a 3.68% dividend yield, maintaining shareholder income amid adverse fundamentals and elevated leverage.
Operational Strength vs. Financial Strain
McCormick delivers the best balance of operational efficiency and valuation discipline, supported by consistent profitability and dividends. Smucker’s metrics reveal high risk with weak returns despite a higher dividend yield. Investors seeking stability may prefer McCormick, while Smucker fits those tolerating elevated risk for income.
Which one offers the Superior Shareholder Reward?
I compare McCormick & Company (MKC) and The J. M. Smucker Company (SJM) on shareholder reward. MKC yields 2.7% with a payout ratio near 61%, backed by strong free cash flow coverage above 75%. It supplements dividends with moderate buybacks, supporting sustainable returns. SJM offers a higher yield near 3.7%, but its payout ratio and recent net losses raise sustainability concerns despite sizeable dividends. SJM’s free cash flow coverage hovers around 52-67%, and buybacks appear less consistent. I favor MKC’s balanced dividend and buyback strategy, underpinned by stable earnings and cash flow. MKC delivers a more reliable total return profile for 2026 investors.
Comparative Score Analysis: The Strategic Profile
The radar chart reveals the fundamental DNA and trade-offs of McCormick & Company versus The J. M. Smucker Company, highlighting their core financial strengths and weaknesses:
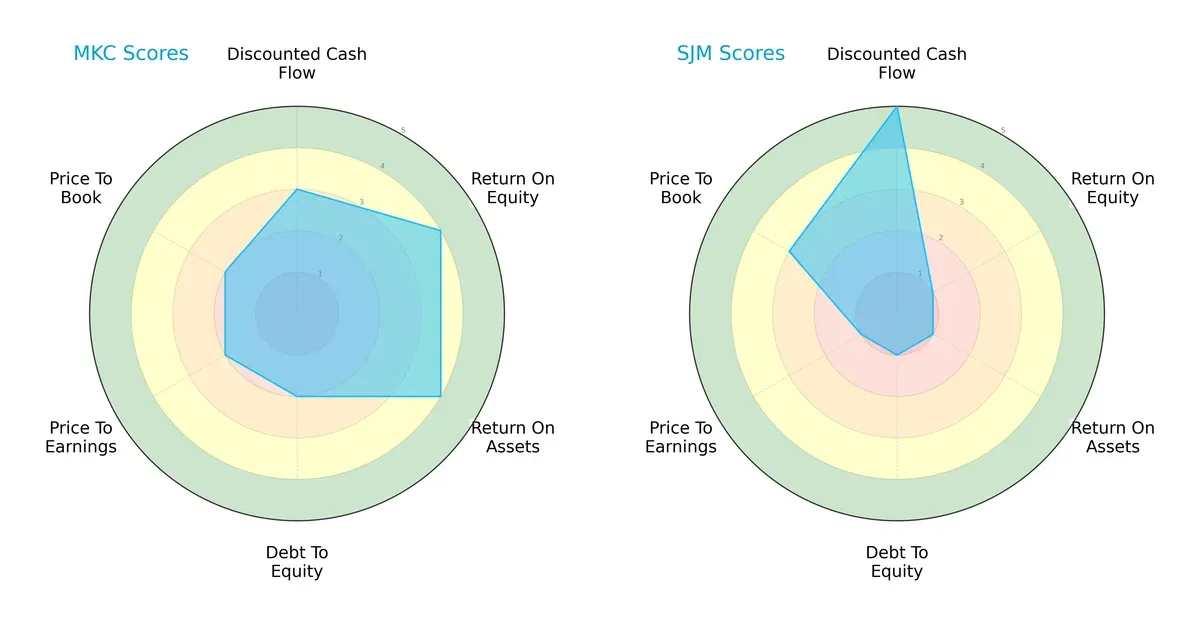
McCormick exhibits a balanced profile with moderate DCF and valuation scores, paired with favorable ROE and ROA, demonstrating efficient capital use. Conversely, Smucker relies heavily on a strong DCF score but suffers very unfavorable returns and leverage metrics, indicating risk concentration. McCormick’s profile shows steadier operational and financial discipline versus Smucker’s lopsided strengths.
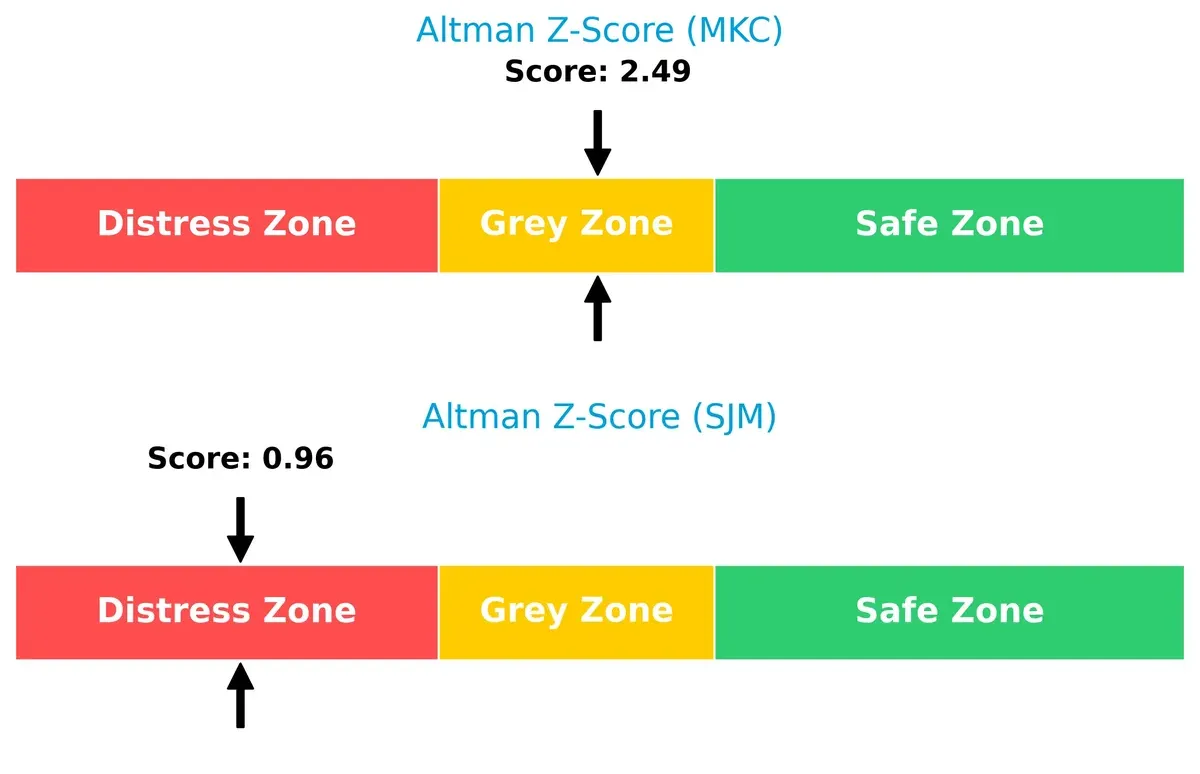
Bankruptcy Risk: Solvency Showdown
McCormick’s Altman Z-Score of 2.49 places it in the grey zone, signaling moderate bankruptcy risk. Smucker’s 0.96 falls in the distress zone, warning of significant solvency concerns in this cycle:
Financial Health: Quality of Operations
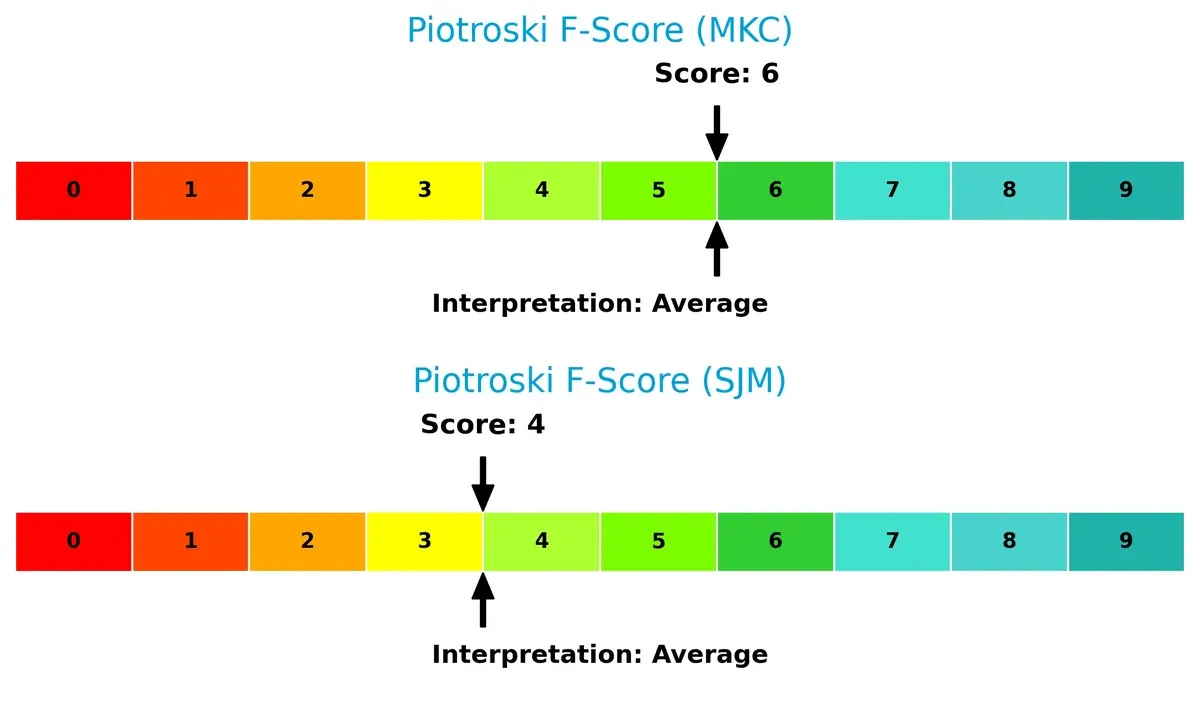
Both firms hold average Piotroski F-Scores—McCormick at 6 and Smucker at 4. However, McCormick’s higher score suggests stronger internal financial controls and fewer red flags compared to Smucker’s weaker operational metrics:
How are the two companies positioned?
This section dissects MKC and SJM’s operational DNA by comparing revenue distribution by segment alongside internal strengths and weaknesses. The goal is to confront their economic moats to reveal which model offers the most resilient, sustainable advantage today.
Revenue Segmentation: The Strategic Mix
The following visual comparison dissects how McCormick & Company and The J. M. Smucker Company diversify their income streams and where their primary sector bets lie:
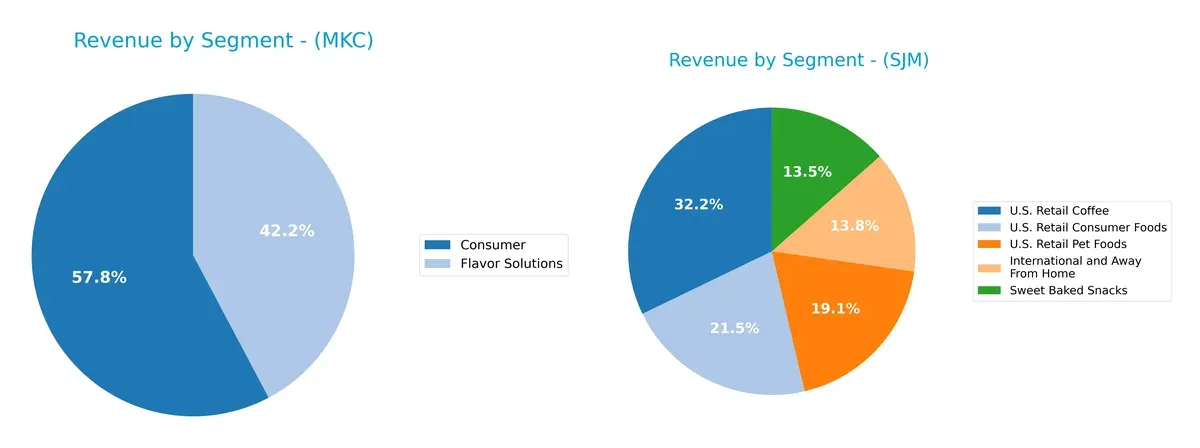
McCormick anchors its revenue in two main segments: Consumer at $3.95B and Flavor Solutions at $2.89B, showing a focused but balanced approach. Smucker dwarfs McCormick in diversification, with five significant segments topped by U.S. Retail Coffee at $2.81B and U.S. Retail Pet Foods at $1.66B. Smucker’s broader mix reduces concentration risk, while McCormick’s dual-segment strategy pivots on product specialization and ecosystem lock-in.
Strengths and Weaknesses Comparison
This table compares the strengths and weaknesses of McCormick & Company, Incorporated (MKC) and The J. M. Smucker Company (SJM):
MKC Strengths
- Favorable net margin at 11.54%
- WACC below ROIC at 6.18%
- Strong interest coverage at 5.65
- High fixed asset turnover at 4.72
- Growing Consumer segment revenue at 3.95B
- Diversified global presence across Americas, Europe, Asia Pacific
SJM Strengths
- Favorable WACC at 4.51%
- Positive dividend yield at 3.68%
- Large U.S. retail revenue base at 8.25B
- Diverse product categories including pet foods and coffee
- Significant U.S. market share with 8.25B revenue
- Stable international sales around 600M
MKC Weaknesses
- Low current ratio at 0.7 indicating liquidity risk
- Unfavorable quick ratio at 0.28
- High price-to-book ratio at 3.11
- Neutral ROE and ROIC near WACC
- Moderate debt-to-equity at 0.7
SJM Weaknesses
- Negative profitability metrics with net margin -14.1%
- Negative ROE at -20.23% and ROIC at -4.33%
- Unfavorable debt-to-equity at 1.28
- Negative interest coverage at -1.84
- Low liquidity ratios (current 0.81, quick 0.35)
- Declining asset turnover at 0.5
MKC exhibits operational efficiency and a solid global footprint but faces liquidity concerns. SJM’s strengths lie in its U.S. market dominance and product diversity but suffers from weak profitability and financial distress indicators. These contrasts highlight distinct strategic challenges and financial profiles.
The Moat Duel: Analyzing Competitive Defensibility
A structural moat alone preserves long-term profits from relentless competition erosion. Let’s dissect how each firm defends its turf:
McCormick & Company, Incorporated: Intangible Assets and Brand Strength
McCormick’s moat stems from powerful brand recognition and proprietary flavor formulas. It sustains high ROIC and margin stability despite modest revenue growth. New product innovation and geographic expansion in 2026 could deepen its competitive edge.
The J. M. Smucker Company: Diversified Product Portfolio Facing Profit Pressure
Smucker relies on a broad product lineup and scale, contrasting McCormick’s brand-driven moat. However, declining ROIC and negative margins reveal weakening capital efficiency. Opportunities exist in premium pet foods and coffee segments but profitability challenges persist.
Moat Resilience Showdown: Brand Equity vs. Scale Efficiency
McCormick exhibits a deeper, more durable moat with growing ROIC and stable margins. Smucker’s shrinking returns and margin erosion signal a fragile moat. I see McCormick better equipped to defend and grow its market share in 2026.
Which stock offers better returns?
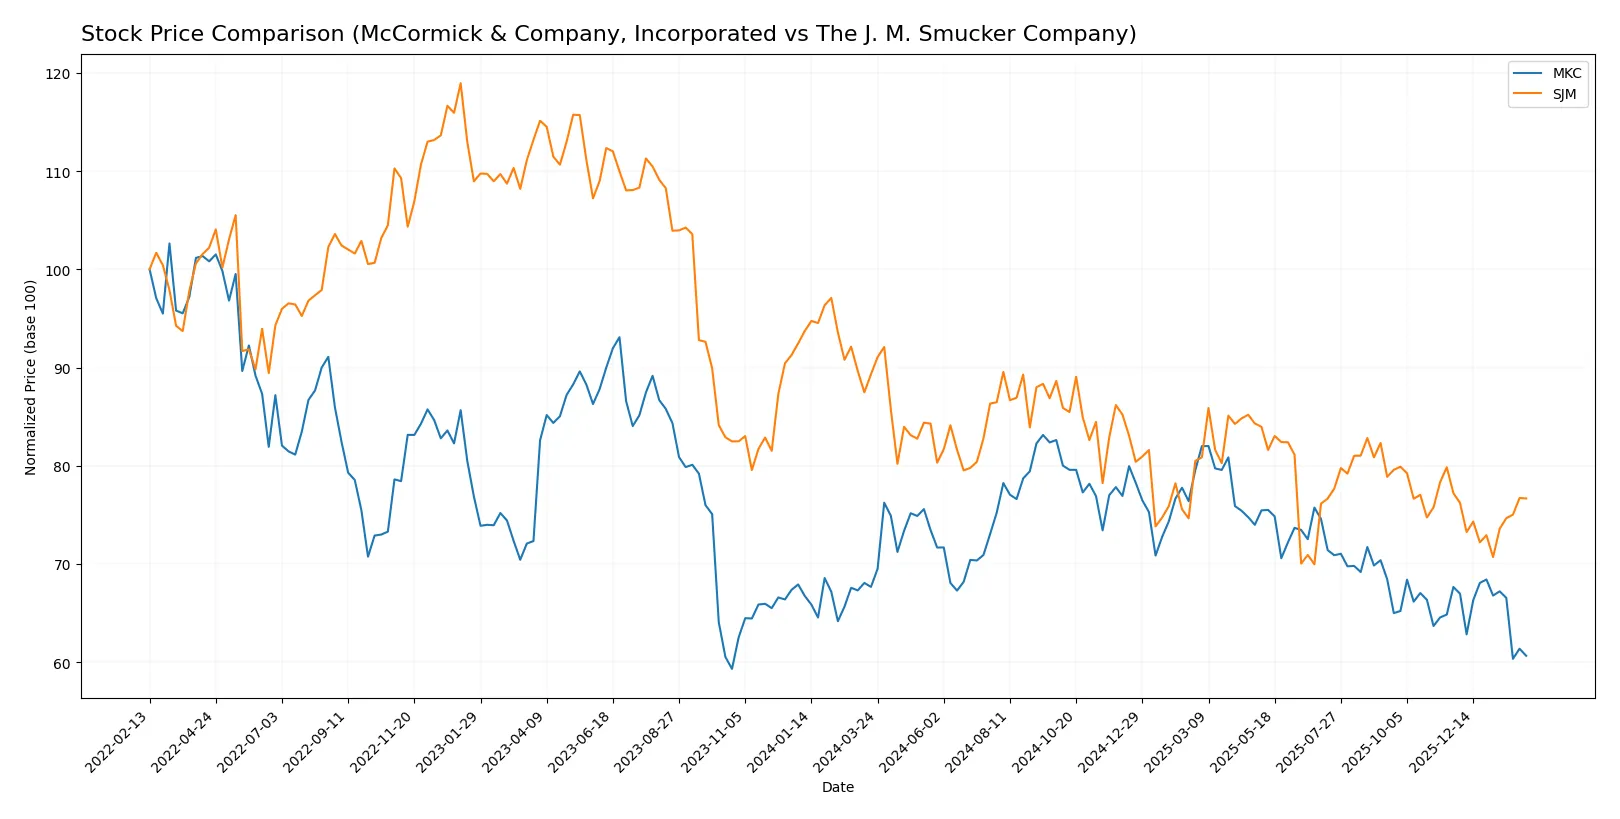
McCormick & Company shows a sustained downward trend over the past year, while The J. M. Smucker Company’s stock also declines, with subtle shifts in momentum and trading activity.
Trend Comparison
McCormick & Company’s stock fell 10.37% over the past 12 months, marking a bearish trend with decelerating losses and a high-low range between 83.76 and 60.79.
The J. M. Smucker Company’s shares dropped 14.16% in the same period, confirming a bearish trend with accelerating declines and price swings between 125.87 and 95.63.
Smucker’s stock delivered a steeper decline than McCormick’s, indicating weaker relative market performance over the last year.
Target Prices
Analysts project solid upside potential for McCormick & Company and The J. M. Smucker Company based on consensus estimates.
| Company | Target Low | Target High | Consensus |
|---|---|---|---|
| McCormick & Company, Incorporated | 67 | 85 | 73.57 |
| The J. M. Smucker Company | 105 | 117 | 111.4 |
The consensus target for McCormick is 73.57, notably above the current 61.1 price, signaling room for growth. Smucker’s 111.4 target also exceeds its 104.79 price, indicating modest upside in this defensive sector.

Don’t Let Luck Decide Your Entry Point
Optimize your entry points with our advanced ProRealTime indicators. You’ll get efficient buy signals with precise price targets for maximum performance. Start outperforming now!
How do institutions grade them?
McCormick & Company, Incorporated Grades
Here are the recent grades from reputable financial institutions for McCormick & Company:
| Grading Company | Action | New Grade | Date |
|---|---|---|---|
| Barclays | maintain | Equal Weight | 2026-01-26 |
| UBS | maintain | Neutral | 2026-01-23 |
| Stifel | maintain | Hold | 2026-01-23 |
| Bernstein | maintain | Outperform | 2025-10-08 |
| Barclays | maintain | Equal Weight | 2025-10-08 |
| Jefferies | maintain | Buy | 2025-10-08 |
| Deutsche Bank | maintain | Hold | 2025-10-08 |
| UBS | maintain | Neutral | 2025-10-08 |
| Stifel | maintain | Hold | 2025-10-08 |
| UBS | maintain | Neutral | 2025-10-01 |
The J. M. Smucker Company Grades
Here are the recent grades from reputable financial institutions for The J. M. Smucker Company:
| Grading Company | Action | New Grade | Date |
|---|---|---|---|
| Morgan Stanley | downgrade | Equal Weight | 2026-01-16 |
| TD Cowen | maintain | Hold | 2026-01-08 |
| UBS | maintain | Buy | 2025-11-26 |
| Stifel | maintain | Hold | 2025-11-26 |
| JP Morgan | maintain | Overweight | 2025-11-26 |
| Bernstein | maintain | Market Perform | 2025-11-26 |
| Morgan Stanley | maintain | Overweight | 2025-11-26 |
| Stifel | maintain | Hold | 2025-10-24 |
| Argus Research | downgrade | Hold | 2025-09-12 |
| Barclays | maintain | Equal Weight | 2025-08-29 |
Which company has the best grades?
McCormick holds a stronger consensus with multiple “Buy” and “Outperform” ratings, while Smucker’s grades lean more toward “Hold” and “Equal Weight.” Investors may view McCormick as having marginally better institutional confidence, potentially reflecting stronger growth or stability expectations.
Risks specific to each company
The following categories identify the critical pressure points and systemic threats facing both firms in the 2026 market environment:
1. Market & Competition
McCormick & Company, Incorporated
- Operates in a competitive spice and seasoning market with diversified global brands, maintaining moderate margins.
The J. M. Smucker Company
- Faces intense competition across coffee, pet foods, and spreads sectors, struggling with negative net margins.
2. Capital Structure & Debt
McCormick & Company, Incorporated
- Moderate debt-to-equity ratio (0.7) with favorable interest coverage (5.65), indicating manageable leverage.
The J. M. Smucker Company
- High debt-to-equity ratio (1.28) with negative interest coverage (-1.84), signaling financial distress risks.
3. Stock Volatility
McCormick & Company, Incorporated
- Beta of 0.61 suggests lower volatility, providing more stability versus the market.
The J. M. Smucker Company
- Extremely low beta of 0.23 implies limited stock price movement, but underlying financial issues pose hidden risks.
4. Regulatory & Legal
McCormick & Company, Incorporated
- Exposed to food safety regulations globally but with strong compliance history minimizing risk.
The J. M. Smucker Company
- Faces complex regulations across diverse product lines, increasing legal and compliance costs.
5. Supply Chain & Operations
McCormick & Company, Incorporated
- Efficient fixed asset turnover (4.72) suggests operational strength despite unfavorable liquidity ratios.
The J. M. Smucker Company
- Weaker fixed asset turnover (2.73) and poor liquidity ratios expose operational vulnerabilities.
6. ESG & Climate Transition
McCormick & Company, Incorporated
- Actively advancing sustainable sourcing and climate initiatives, enhancing long-term resilience.
The J. M. Smucker Company
- ESG efforts lag behind peers, potentially risking brand reputation and regulatory penalties.
7. Geopolitical Exposure
McCormick & Company, Incorporated
- Diverse geographical footprint across Americas, Europe, and Asia cushions geopolitical shocks.
The J. M. Smucker Company
- Primarily US-focused operations increase susceptibility to domestic policy shifts and trade tensions.
Which company shows a better risk-adjusted profile?
McCormick faces its largest risk in liquidity constraints but benefits from manageable debt and operational efficiency. Smucker’s most critical risk is severe financial distress, with negative profitability and weak interest coverage signaling deeper troubles. Consequently, McCormick presents a stronger risk-adjusted profile, supported by a grey zone Altman Z-score (2.49) versus Smucker’s distress zone (0.96). The recent deterioration in Smucker’s return on equity (-20.23%) confirms escalating financial instability, justifying heightened concern.
Final Verdict: Which stock to choose?
McCormick & Company, Incorporated (MKC) excels as a cash-efficient operator with a steadily growing profitability profile. Its slight margin pressure and low liquidity ratios are points of vigilance that suggest cautious monitoring. MKC suits portfolios focused on stable income and moderate growth with a margin of safety.
The J. M. Smucker Company (SJM) offers a strategic moat rooted in brand recognition and recurring consumer demand. However, its declining profitability and unfavorable leverage pose significant risks compared to MKC. SJM may appeal to investors with a higher risk tolerance seeking turnaround potential or value opportunities.
If you prioritize consistent value creation and financial resilience, MKC outshines as the more reliable investment due to its improving returns and manageable debt. However, if you seek speculative growth with potential for recovery, SJM offers better upside but demands acceptance of elevated volatility and operational challenges.
Disclaimer: Investment carries a risk of loss of initial capital. The past performance is not a reliable indicator of future results. Be sure to understand risks before making an investment decision.
Go Further
I encourage you to read the complete analyses of McCormick & Company, Incorporated and The J. M. Smucker Company to enhance your investment decisions: