Home > Comparison > Consumer Defensive > MKC vs PPC
The strategic rivalry between McCormick & Company and Pilgrim’s Pride shapes the packaged foods sector’s evolution. McCormick operates as a global flavor solutions leader, focusing on spices and seasonings with a strong consumer brand portfolio. Pilgrim’s Pride, a high-volume protein producer, emphasizes large-scale poultry and pork processing. This analysis pits McCormick’s innovation-driven model against Pilgrim’s scale-driven approach to identify which offers a superior risk-adjusted return for diversified portfolios.

Table of contents
Companies Overview
McCormick & Company and Pilgrim’s Pride stand as major players in the packaged foods industry, each commanding distinct market niches.
McCormick & Company: Global Leader in Flavors
McCormick primarily operates in the spices and seasoning market, generating revenue through its Consumer and Flavor Solutions segments. It sells branded spices, herbs, and condiments globally, focusing on expanding its flavor solutions to multinational food manufacturers in 2026. The company’s competitive edge lies in its diverse product portfolio and deep penetration in retail and foodservice channels.
Pilgrim’s Pride Corporation: Major Poultry and Pork Producer
Pilgrim’s Pride dominates the fresh and processed poultry sector, earning revenue by producing and marketing chicken and pork products worldwide. In 2026, it concentrates on broadening its value-added offerings and international distribution. Its scale and integration enable it to serve large foodservice clients and retail chains efficiently, supported by strong brand recognition across multiple markets.
Strategic Collision: Similarities & Divergences
Both companies operate within the packaged foods sector but follow different business models—McCormick focuses on branded flavoring products, while Pilgrim’s Pride emphasizes protein production and processing. Their primary battleground lies in retail and foodservice distribution channels, competing indirectly through complementary product lines. Investors will find McCormick offers a stable, brand-driven profile, whereas Pilgrim’s Pride presents a volume-driven, commodity-exposed investment characteristic.
Income Statement Comparison
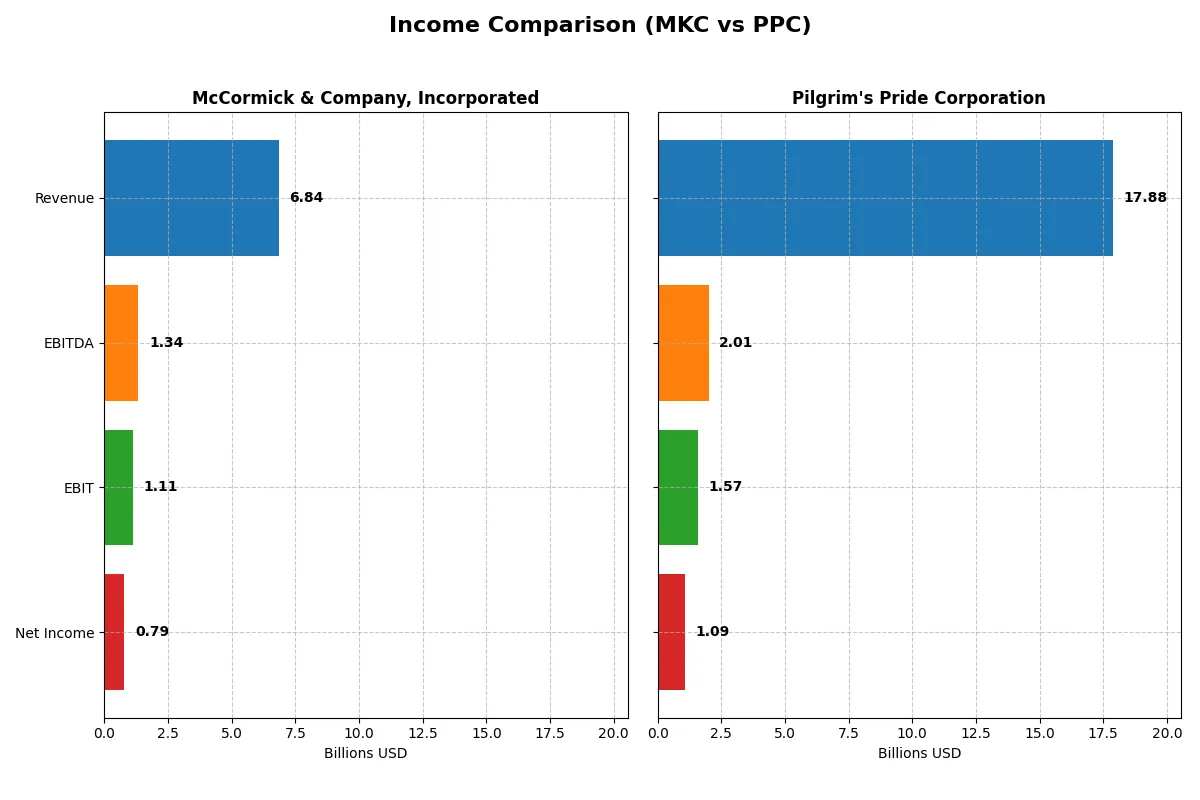
The table below dissects the core profitability and scalability of both corporate engines to reveal who dominates the bottom line:
| Metric | McCormick & Company, Incorporated (MKC) | Pilgrim’s Pride Corporation (PPC) |
|---|---|---|
| Revenue | 6.84B | 17.88B |
| Cost of Revenue | 4.25B | 15.57B |
| Operating Expenses | 1.50B | 807M |
| Gross Profit | 2.59B | 2.31B |
| EBITDA | 1.34B | 2.01B |
| EBIT | 1.11B | 1.57B |
| Interest Expense | 196M | 161M |
| Net Income | 789M | 1.09B |
| EPS | 2.94 | 4.58 |
| Fiscal Year | 2025 | 2024 |
Income Statement Analysis: The Bottom-Line Duel
This income statement comparison uncovers the true operational efficiency and growth momentum of two distinct corporate engines.
McCormick & Company, Incorporated Analysis
McCormick’s revenue rose modestly to 6.84B in 2025, with net income climbing slightly to 789M. The firm sustains strong gross and net margins at 37.9% and 11.5%, respectively. Despite a slight dip in net margin growth, McCormick maintains margin discipline and steady earnings per share, signaling consistent operational efficiency.
Pilgrim’s Pride Corporation Analysis
Pilgrim’s Pride achieved a revenue surge to 17.88B in 2024, with net income more than tripling to 1.09B. Its gross margin remains subdued at 12.9%, but net margin improved sharply to 6.1%. The company shows remarkable momentum in profitability growth, with robust expansions in EBIT and EPS that reflect an accelerating earnings trajectory.
Margin Efficiency vs. Growth Momentum
McCormick commands superior margin efficiency with a stable, high gross margin and disciplined cost control, delivering steady profits. Pilgrim’s Pride, conversely, impresses with explosive revenue and net income growth despite thinner margins. For investors, McCormick offers reliable margin strength, while Pilgrim’s Pride presents a compelling growth story fueled by rapid earnings expansion.
Financial Ratios Comparison
These vital ratios act as a diagnostic tool to expose the underlying fiscal health, valuation premiums, and capital efficiency of the companies compared below:
| Ratios | McCormick & Company, Incorporated (MKC) | Pilgrim’s Pride Corporation (PPC) |
|---|---|---|
| ROE | 13.8% | 25.6% |
| ROIC | 7.9% | 14.2% |
| P/E | 22.6 | 9.9 |
| P/B | 3.11 | 2.54 |
| Current Ratio | 0.70 | 2.01 |
| Quick Ratio | 0.28 | 1.31 |
| D/E (Debt-to-Equity) | 0.70 | 0.82 |
| Debt-to-Assets | 30.3% | 32.5% |
| Interest Coverage | 5.57 | 9.34 |
| Asset Turnover | 0.52 | 1.68 |
| Fixed Asset Turnover | 4.72 | 5.27 |
| Payout Ratio | 61.2% | 0% |
| Dividend Yield | 2.71% | 0% |
| Fiscal Year | 2025 | 2024 |
Efficiency & Valuation Duel: The Vital Signs
Financial ratios serve as a company’s DNA, unveiling hidden risks and operational excellence that define investment potential.
McCormick & Company, Incorporated
McCormick delivers moderate profitability with a 13.8% ROE and an 11.5% net margin, signaling steady but not stellar returns. The stock trades at a neutral P/E of 22.6, reflecting a fair valuation relative to earnings. It offers a 2.7% dividend yield, rewarding shareholders while balancing reinvestment for growth. However, a low current ratio of 0.7 flags liquidity concerns.
Pilgrim’s Pride Corporation
Pilgrim’s Pride excels with a robust 25.6% ROE and a solid 14.2% ROIC, showcasing efficient capital use. Its P/E of 9.9 suggests the stock is attractively valued, with strong operational metrics and a current ratio above 2.0 indicating financial health. The company does not pay dividends, instead prioritizing reinvestment to fuel growth, supported by favorable asset turnover and interest coverage ratios.
Premium Valuation vs. Operational Safety
Pilgrim’s Pride offers superior profitability and valuation metrics paired with strong liquidity, presenting a balanced risk-reward profile. McCormick trades at a premium with moderate returns and a shareholder-friendly dividend but shows liquidity vulnerabilities. Investors seeking growth and operational efficiency may prefer Pilgrim’s, while those valuing income and stability may lean toward McCormick.
Which one offers the Superior Shareholder Reward?
I compare McCormick & Company (MKC) and Pilgrim’s Pride Corporation (PPC) on dividends, payout ratios, and buybacks. MKC yields 2.7% with a 61% payout ratio, showing strong FCF coverage (77%). PPC pays no dividend, reinvesting 100% into growth and acquisitions. MKC’s moderate buyback activity contrasts PPC’s aggressive capital allocation to buybacks and debt reduction, fueling rapid free cash flow growth (6.4/share vs. MKC’s 2.8/share). MKC delivers steady income and sustainable payouts. PPC offers capital gains potential but no income. For 2026 total return, I favor MKC for risk-averse dividend investors and PPC for growth seekers tolerating volatility.
Comparative Score Analysis: The Strategic Profile
The radar chart reveals the fundamental DNA and trade-offs of McCormick & Company and Pilgrim’s Pride Corporation, highlighting their strategic strengths and vulnerabilities:
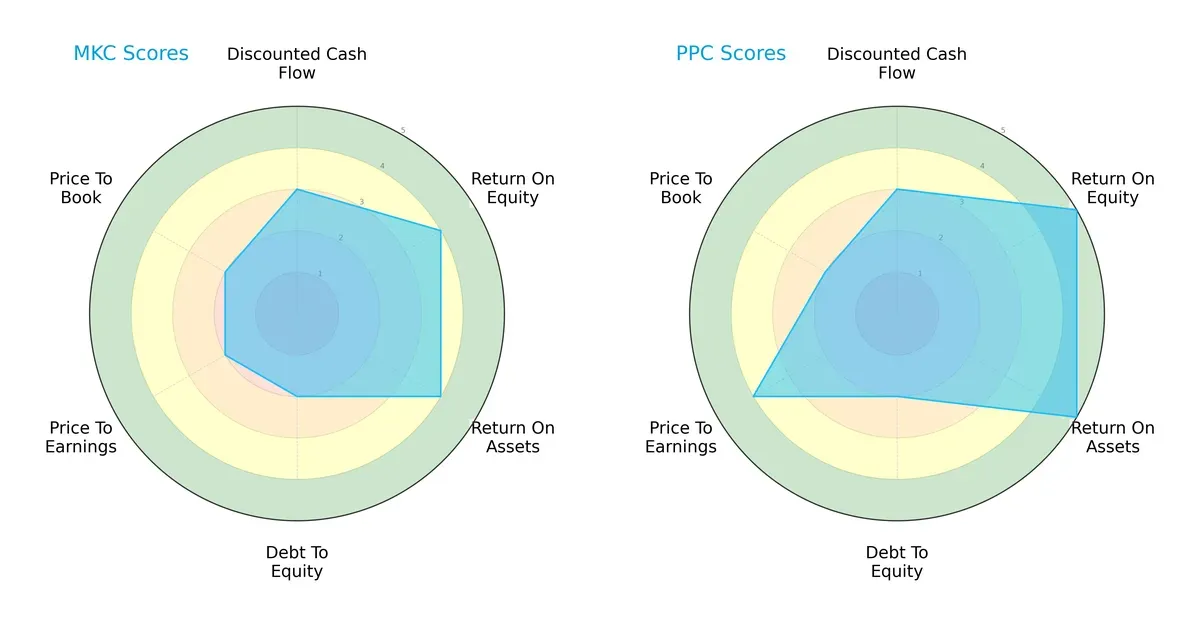
Pilgrim’s Pride leads with a higher overall score (4 vs. 3) and excels in profitability metrics—ROE and ROA scores of 5 compared to McCormick’s 4. Both firms share moderate debt-to-equity risk. McCormick shows more conservative valuation scores (PE and PB at 2) versus Pilgrim’s higher PE score (4), indicating Pilgrim’s shares may command a premium. Pilgrim’s profile balances strong earnings efficiency with growth expectations, while McCormick relies on stable but less aggressive valuation metrics.
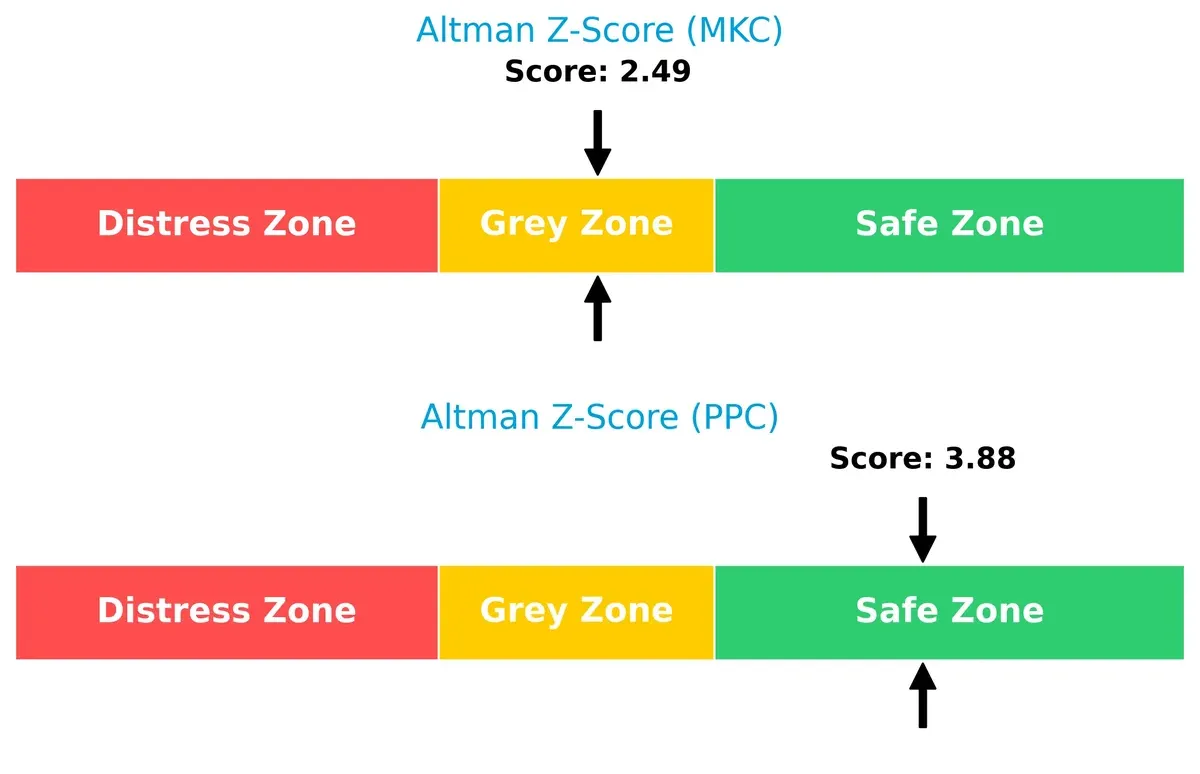
Bankruptcy Risk: Solvency Showdown
Pilgrim’s Pride’s Altman Z-Score of 3.88 places it firmly in the safe zone, signaling strong solvency and low bankruptcy risk. McCormick’s 2.49 lands in the grey zone, implying moderate financial risk and warranting caution in volatile market cycles:
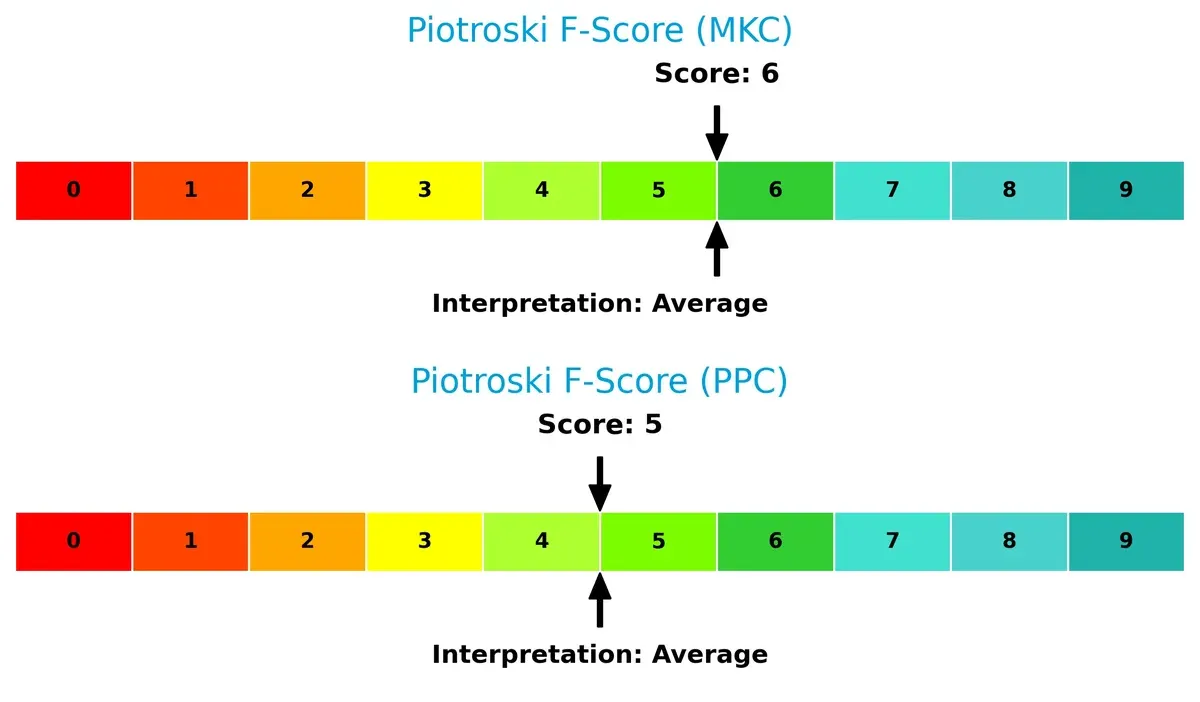
Financial Health: Quality of Operations
McCormick scores a 6 on the Piotroski F-Score, slightly higher than Pilgrim’s 5, suggesting marginally better internal financial health. Neither company shows critical red flags, but Pilgrim’s slightly lower score indicates room for operational improvements:
How are the two companies positioned?
This section dissects the operational DNA of McCormick and Pilgrim’s by comparing their revenue distribution by segment and internal strengths and weaknesses. The final objective is to confront their economic moats to identify which model offers the most resilient and sustainable competitive advantage today.
Revenue Segmentation: The Strategic Mix
This visual comparison dissects how McCormick & Company and Pilgrim’s Pride diversify their income streams and where their primary sector bets lie:
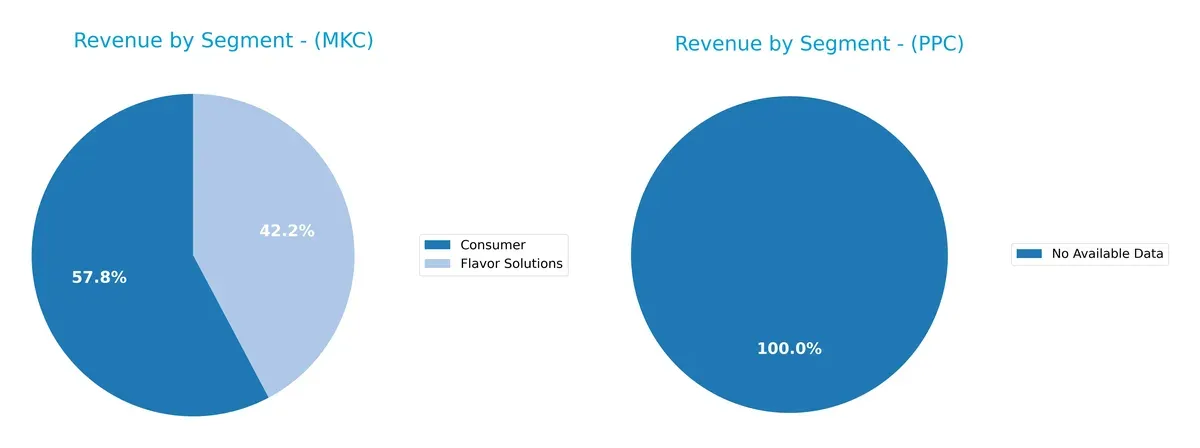
McCormick anchors its revenue in two substantial segments: Consumer at $3.95B and Flavor Solutions at $2.89B in 2025. This balanced split signals strategic diversification, reducing reliance on any single stream. Pilgrim’s Pride lacks available segment data, preventing a direct comparison. McCormick’s approach leverages ecosystem lock-in, blending consumer loyalty with industrial flavor dominance, which mitigates concentration risk effectively.
Strengths and Weaknesses Comparison
This table compares the Strengths and Weaknesses of McCormick & Company, Incorporated and Pilgrim’s Pride Corporation:
McCormick Strengths
- Diverse revenue from Consumer and Flavor Solutions segments
- Strong global presence in Americas, EMEA, and Asia Pacific
- Favorable net margin at 11.54%
- Favorable interest coverage at 5.65
- Dividend yield at 2.71% supports income investors
Pilgrim’s Pride Strengths
- Favorable ROE at 25.63% and ROIC at 14.2% indicate efficient capital use
- Strong asset turnover at 1.68 and fixed asset turnover at 5.27
- Robust liquidity ratios with current ratio 2.01 and quick ratio 1.31
- Favorable P/E at 9.9 supports valuation appeal
- Extensive geographic revenue diversification including U.S., Europe, Mexico, and Asia Pacific
McCormick Weaknesses
- Unfavorable liquidity with current ratio 0.7 and quick ratio 0.28 raises short-term risk
- Price-to-book ratio at 3.11 is high compared to sector norms
- Neutral ROIC at 7.93 close to WACC at 6.18 limits economic moat strength
- Moderate leverage with debt-to-assets 30.27%
Pilgrim’s Pride Weaknesses
- Zero dividend yield reduces appeal to income-focused investors
- Neutral debt-to-assets at 32.55% and debt-to-equity 0.82 indicate moderate leverage
- Lower net margin at 6.08% compared to peers may pressure profitability
- Less diversified product segmentation data available for revenue analysis
Both companies exhibit solid strengths in profitability and geographic reach. McCormick’s higher dividend yield contrasts with Pilgrim’s superior liquidity and capital efficiency. However, McCormick’s weaker liquidity and valuation ratios warrant caution, while Pilgrim’s lack of dividend and moderate net margin may limit investor appeal. These factors shape their strategic priorities going forward.
The Moat Duel: Analyzing Competitive Defensibility
A structural moat protects long-term profits from relentless competition erosion. Without it, market share and pricing power vanish quickly:
McCormick & Company, Incorporated: Intangible Assets Moat
McCormick’s moat stems from strong brand equity and proprietary flavor formulations. Its steady 16% EBIT margin reflects pricing power and margin stability. Expansion into emerging markets in 2026 could deepen this moat but faces rising input costs.
Pilgrim’s Pride Corporation: Scale and Operational Efficiency Moat
Pilgrim’s competitive edge lies in cost advantage through scale and integration. Its ROIC far exceeds WACC, driving rapid margin and earnings growth. Pilgrim’s 2026 outlook includes capacity expansions and product innovation, enhancing market disruption potential versus McCormick.
Brand Equity vs. Scale Leadership: The Defensive Contest
Pilgrim’s Pride sustains a wider and deeper moat, evidenced by an ROIC nearly 9% above WACC versus McCormick’s slight value shedding. Pilgrim’s operational efficiency equips it better to protect and grow market share amid evolving industry pressures.
Which stock offers better returns?
The past year shows McCormick & Company’s stock declining steadily while Pilgrim’s Pride’s shares gained robustly, reflecting contrasting trading momentum and investor sentiment.
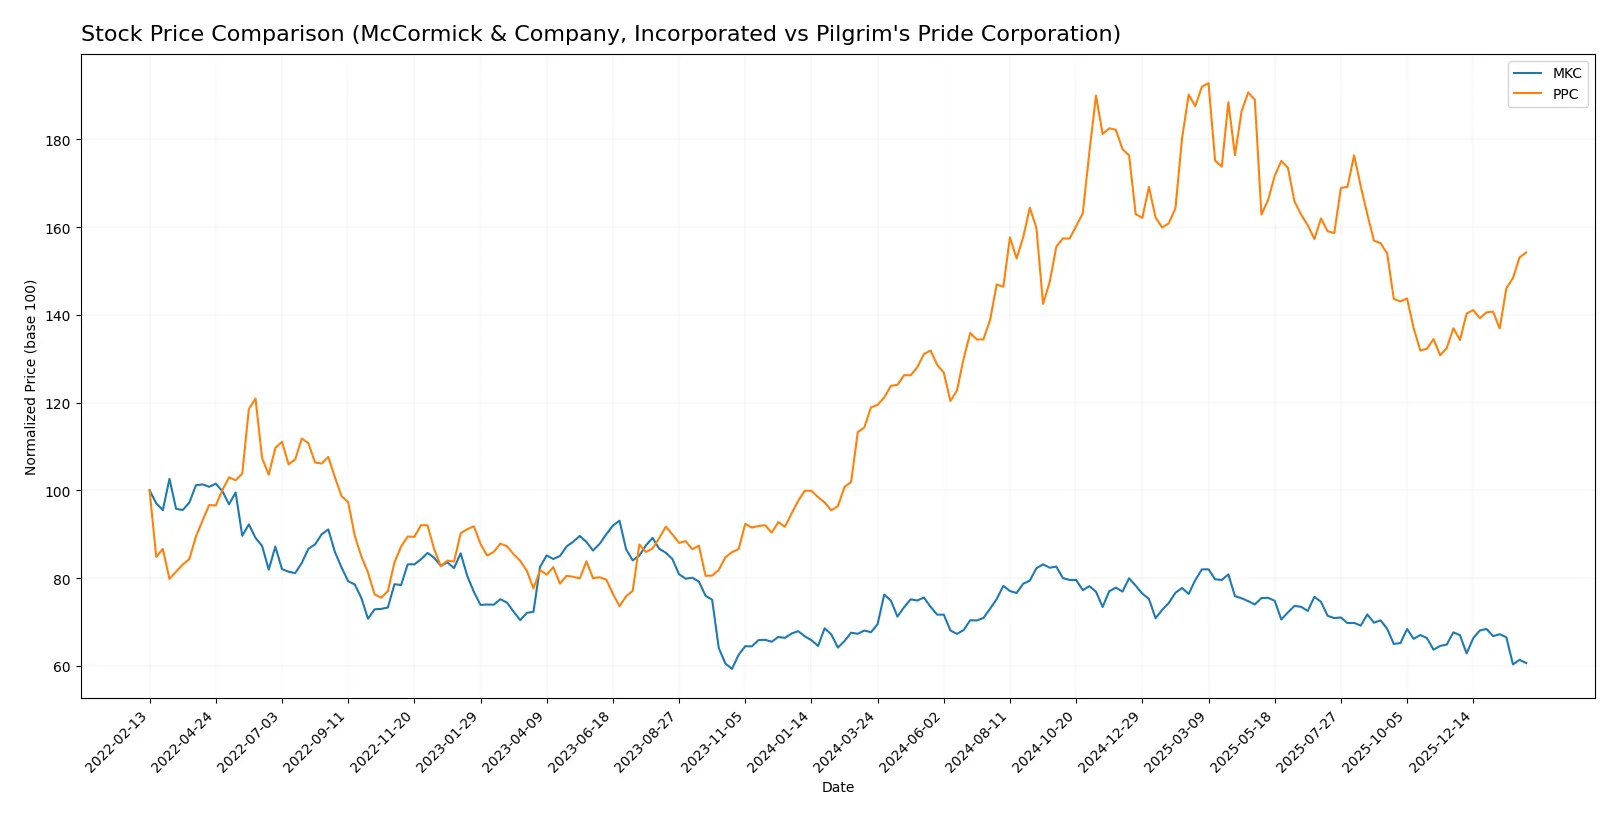
Trend Comparison
McCormick & Company’s stock fell 10.37% over the last 12 months, marking a bearish trend with decelerating decline and a price range between 60.79 and 83.76.
Pilgrim’s Pride’s shares rose 29.68% during the same period, exhibiting a bullish trend with accelerating gains and a price band from 33.69 to 54.62.
Pilgrim’s Pride outperformed McCormick significantly, delivering the highest market returns and stronger upward momentum over the past year.
Target Prices
Analysts present a moderate upside consensus for both McCormick & Company and Pilgrim’s Pride Corporation.
| Company | Target Low | Target High | Consensus |
|---|---|---|---|
| McCormick & Company, Incorporated | 67 | 85 | 73.57 |
| Pilgrim’s Pride Corporation | 45 | 56 | 50.5 |
The consensus targets suggest McCormick trades at a discount to its $73.57 average target versus its $61.1 price. Pilgrim’s Pride also shows upside potential with a $50.5 consensus target above the $43.69 current price.

Don’t Let Luck Decide Your Entry Point
Optimize your entry points with our advanced ProRealTime indicators. You’ll get efficient buy signals with precise price targets for maximum performance. Start outperforming now!
How do institutions grade them?
McCormick & Company, Incorporated Grades
The most recent institutional grades for McCormick & Company are summarized below.
| Grading Company | Action | New Grade | Date |
|---|---|---|---|
| Barclays | Maintain | Equal Weight | 2026-01-26 |
| UBS | Maintain | Neutral | 2026-01-23 |
| Stifel | Maintain | Hold | 2026-01-23 |
| Bernstein | Maintain | Outperform | 2025-10-08 |
| Barclays | Maintain | Equal Weight | 2025-10-08 |
| Jefferies | Maintain | Buy | 2025-10-08 |
| Deutsche Bank | Maintain | Hold | 2025-10-08 |
| UBS | Maintain | Neutral | 2025-10-08 |
| Stifel | Maintain | Hold | 2025-10-08 |
| UBS | Maintain | Neutral | 2025-10-01 |
Pilgrim’s Pride Corporation Grades
Below is a table of recent institutional grades provided for Pilgrim’s Pride Corporation.
| Grading Company | Action | New Grade | Date |
|---|---|---|---|
| Barclays | Maintain | Equal Weight | 2025-12-09 |
| Goldman Sachs | Maintain | Neutral | 2025-10-13 |
| BMO Capital | Maintain | Market Perform | 2025-03-17 |
| Barclays | Maintain | Equal Weight | 2024-11-01 |
| BMO Capital | Maintain | Market Perform | 2024-11-01 |
| Barclays | Maintain | Equal Weight | 2024-09-09 |
| Argus Research | Maintain | Buy | 2024-08-28 |
| B of A Securities | Downgrade | Neutral | 2024-08-15 |
| BMO Capital | Downgrade | Market Perform | 2024-08-12 |
| Barclays | Maintain | Equal Weight | 2024-08-02 |
Which company has the best grades?
McCormick & Company holds a mix of Buy, Outperform, and Hold ratings, reflecting moderate optimism. Pilgrim’s Pride shows a consistent Equal Weight and Market Perform trend with occasional Buy and downgrades, indicating more neutral sentiment. Investors may interpret McCormick’s higher ratings as potential for stronger relative performance.
Risks specific to each company
The following categories identify the critical pressure points and systemic threats facing both firms in the 2026 market environment:
1. Market & Competition
McCormick & Company, Incorporated
- Faces intense competition in packaged foods with premium brand positioning but slower growth.
Pilgrim’s Pride Corporation
- Operates in competitive meat processing with scale advantage but margin pressure from commodity costs.
2. Capital Structure & Debt
McCormick & Company, Incorporated
- Moderate debt level (D/E 0.7), interest coverage strong at 5.65x, but liquidity ratios are weak (current 0.7).
Pilgrim’s Pride Corporation
- Slightly higher leverage (D/E 0.82), strong interest coverage 9.76x, and robust liquidity (current 2.01) reduce financial risk.
3. Stock Volatility
McCormick & Company, Incorporated
- Beta of 0.61 indicates moderate volatility, less sensitive to market swings.
Pilgrim’s Pride Corporation
- Lower beta at 0.45, stock exhibits lower volatility and steadier price movements.
4. Regulatory & Legal
McCormick & Company, Incorporated
- Subject to food safety and labeling regulations; less exposed to meat-specific regulation risks.
Pilgrim’s Pride Corporation
- Faces stricter meat industry regulations and trade compliance risks internationally.
5. Supply Chain & Operations
McCormick & Company, Incorporated
- Complex global supply chains for spices and seasoning ingredients risk disruption.
Pilgrim’s Pride Corporation
- High exposure to livestock supply volatility and feed cost fluctuations impacting margins.
6. ESG & Climate Transition
McCormick & Company, Incorporated
- Pressure to improve sustainability in sourcing and packaging amid growing consumer demands.
Pilgrim’s Pride Corporation
- Faces significant challenges in reducing carbon footprint and animal welfare concerns.
7. Geopolitical Exposure
McCormick & Company, Incorporated
- Moderate global presence with exposure to trade tensions in EMEA and Asia.
Pilgrim’s Pride Corporation
- More vulnerable due to export markets and supply chain spread across volatile regions.
Which company shows a better risk-adjusted profile?
Pilgrim’s Pride faces higher operational and regulatory risks but boasts superior liquidity and stronger profitability metrics. McCormick struggles with liquidity and valuation concerns despite stable market positioning. Pilgrim’s Pride’s safer balance sheet and higher ROIC versus WACC signal a better risk-adjusted profile. However, its ESG and geopolitical vulnerabilities warrant caution.
Final Verdict: Which stock to choose?
McCormick & Company’s superpower lies in its resilient profitability and improving return on invested capital. Its evolving efficiency signals cautious optimism, though its stretched liquidity ratios remain a point of vigilance. It fits portfolios aiming for steady income with moderate growth potential.
Pilgrim’s Pride boasts a robust strategic moat through high returns well above its cost of capital and accelerating profitability. Its stronger liquidity and valuation metrics offer a safety cushion compared to McCormick. This stock suits investors focused on growth at a reasonable price with better stability.
If you prioritize income stability and a proven cash machine, McCormick appears the compelling choice due to its consistent margins and dividend yield. However, if you seek aggressive growth backed by a durable competitive advantage and improving fundamentals, Pilgrim’s Pride offers better upside with enhanced financial health. Both present analytical scenarios aligned with distinct investor profiles.
Disclaimer: Investment carries a risk of loss of initial capital. The past performance is not a reliable indicator of future results. Be sure to understand risks before making an investment decision.
Go Further
I encourage you to read the complete analyses of McCormick & Company, Incorporated and Pilgrim’s Pride Corporation to enhance your investment decisions: