Home > Comparison > Technology > TSEM vs MXL
The strategic rivalry between Tower Semiconductor Ltd. and MaxLinear, Inc. shapes the semiconductor sector’s evolution. Tower operates as a capital-intensive foundry specializing in analog and mixed-signal wafers, while MaxLinear focuses on high-performance RF and mixed-signal communications SoCs. This analysis pits Tower’s manufacturing scale against MaxLinear’s integrated system design. We aim to identify which business model offers the superior risk-adjusted return for a diversified technology portfolio.
Table of contents
Companies Overview
Tower Semiconductor and MaxLinear are pivotal players in the evolving semiconductor landscape, each commanding unique market niches.
Tower Semiconductor Ltd.: Specialist in Analog-Intensive Mixed-Signal Foundry Services
Tower Semiconductor stands as an independent semiconductor foundry focusing on analog-intensive mixed-signal devices. It generates revenue primarily through customizable wafer fabrication and design enablement services. In 2026, the company emphasized expanding its process technologies portfolio, including SiGe and BiCMOS, targeting diverse sectors like automotive, aerospace, and medical devices.
MaxLinear, Inc.: Provider of Integrated Communications SoCs
MaxLinear concentrates on high-performance RF and mixed-signal system-on-chip (SoC) solutions serving connected home and infrastructure markets. Its revenue engine centers on integrated broadband transceivers and modems for 4G/5G infrastructure and home networking equipment. The 2026 strategy focused on enhancing end-to-end communication platform integration and expanding its footprint in fiber-optic and wireless infrastructure applications.
Strategic Collision: Similarities & Divergences
Both companies operate in semiconductors but diverge in focus: Tower Semiconductor delivers foundry services with a customizable analog technology stack, while MaxLinear provides integrated SoCs for communications. Their primary battleground lies in capturing market share across communications and industrial sectors. Tower offers a capital-intensive foundry model; MaxLinear relies on product innovation in system integration—defining distinct risk and growth profiles for investors.
Income Statement Comparison
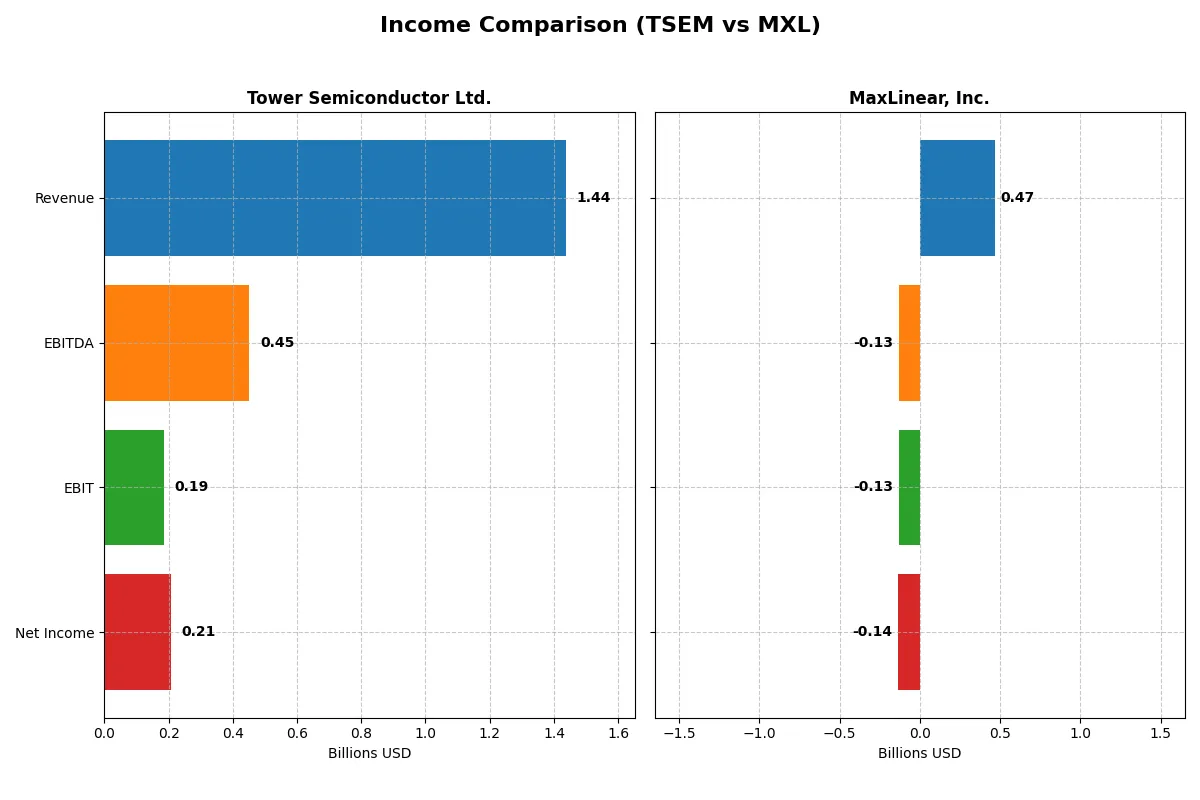
This data dissects the core profitability and scalability of both corporate engines to reveal who dominates the bottom line:
| Metric | Tower Semiconductor Ltd. (TSEM) | MaxLinear, Inc. (MXL) |
|---|---|---|
| Revenue | 1.44B | 467.6M |
| Cost of Revenue | 1.10B | 201.8M |
| Operating Expenses | 148.1M | 392.7M |
| Gross Profit | 339.4M | 265.8M |
| EBITDA | 451.3M | -130.8M |
| EBIT | 185.0M | -130.8M |
| Interest Expense | 5.9M | 10.1M |
| Net Income | 207.9M | -136.7M |
| EPS | 1.87 | -1.58 |
| Fiscal Year | 2024 | 2025 |
Income Statement Analysis: The Bottom-Line Duel
This income statement comparison reveals which company operates with greater efficiency and sustainable profitability over recent years.
Tower Semiconductor Ltd. Analysis
Tower Semiconductor’s revenue showed modest growth, reaching $1.44B in 2024, while net income declined sharply to $208M. Its gross margin remains solid at 23.6%, but net margin dropped to 14.5%, reflecting weakening profitability. Despite this, Tower maintains favorable interest expense and overall margin health, signaling resilience amid margin pressure.
MaxLinear, Inc. Analysis
MaxLinear’s revenue surged 30% to $468M in 2025, with gross margin expanding to 56.8%. However, it recorded a net loss of $137M, reflecting an unfavorable net margin of -29.2%. The company improved year-over-year earnings before interest and taxes (EBIT) but continues to face significant challenges converting top-line gains into profits.
Margin Strength vs. Revenue Momentum
Tower Semiconductor leads with stronger profitability metrics and consistent margin control. MaxLinear shows impressive revenue momentum but struggles with deep losses and negative net margins. Investors seeking stable earnings will favor Tower’s profile, while MaxLinear suits those prioritizing growth potential despite higher risk.
Financial Ratios Comparison
These vital ratios act as a diagnostic tool to expose the underlying fiscal health, valuation premiums, and capital efficiency of the companies compared below:
| Ratios | Tower Semiconductor Ltd. (TSEM) | MaxLinear, Inc. (MXL) |
|---|---|---|
| ROE | 7.83% | -47.49% |
| ROIC | 6.41% | -24.31% |
| P/E | 27.54 | -6.74 |
| P/B | 2.16 | 3.20 |
| Current Ratio | 6.18 | 1.77 |
| Quick Ratio | 5.23 | 1.28 |
| D/E | 0.07 | 0.29 |
| Debt-to-Assets | 5.87% | 17.23% |
| Interest Coverage | 32.64 | -15.52 |
| Asset Turnover | 0.47 | 0.42 |
| Fixed Asset Turnover | 1.11 | 4.65 |
| Payout Ratio | 0 | 0 |
| Dividend Yield | 0 | 0 |
| Fiscal Year | 2024 | 2024 |
Efficiency & Valuation Duel: The Vital Signs
Financial ratios serve as a company’s DNA, unlocking insights into hidden risks and operational performance beyond surface-level numbers.
Tower Semiconductor Ltd.
Tower Semiconductor posts a modest 7.8% ROE, signaling below-par profitability compared to sector norms. Its P/E ratio of 27.5 marks the stock as stretched versus the S&P 500 average. Despite no dividend payout, Tower reinvests steadily in R&D at 1.4% of revenue, aiming for long-term growth. The firm’s strong quick ratio contrasts with a surprisingly high current ratio, flagging working capital inefficiency.
MaxLinear, Inc.
MaxLinear struggles with deeply negative profitability metrics, including a -47.5% ROE and a -68% net margin, reflecting operational distress. The negative P/E implies losses, but a 3.2 PB ratio suggests the stock trades at a premium for its asset base. MaxLinear invests heavily in R&D at 62%, forsaking dividends as it attempts a turnaround. Its low current and quick ratios indicate tighter liquidity relative to peers.
Premium Valuation vs. Operational Safety
Tower Semiconductor balances moderate profitability and stretched valuation with prudent reinvestment and strong liquidity, offering a safer risk profile. MaxLinear’s deep losses and unfavorable returns contrast with aggressive R&D spending but carry higher financial risk. Investors seeking operational stability may prefer Tower; those betting on a high-risk turnaround might consider MaxLinear.
Which one offers the Superior Shareholder Reward?
I observe that Tower Semiconductor Ltd. (TSEM) and MaxLinear, Inc. (MXL) both pay no dividends, focusing entirely on reinvestment and buybacks. TSEM’s free cash flow per share reached 2.1 in 2024, with a modest buyback program supporting shareholder returns sustainably. In contrast, MXL posted a negative free cash flow of -0.75 in 2024 and operates with negative profitability and cash flow margins, signaling weak capital allocation. TSEM’s stronger operating cash flow ratio (2.44 vs. MXL’s -0.25) and low debt-to-equity (0.07 vs. 0.29) underline a more robust balance sheet. MXL’s aggressive reinvestment, amid losses and negative margins, appears riskier. Thus, I conclude TSEM offers a more attractive and sustainable total return profile for investors in 2026.
Comparative Score Analysis: The Strategic Profile
The radar chart reveals the fundamental DNA and trade-offs of Tower Semiconductor Ltd. and MaxLinear, Inc., highlighting their financial strengths and valuation challenges:
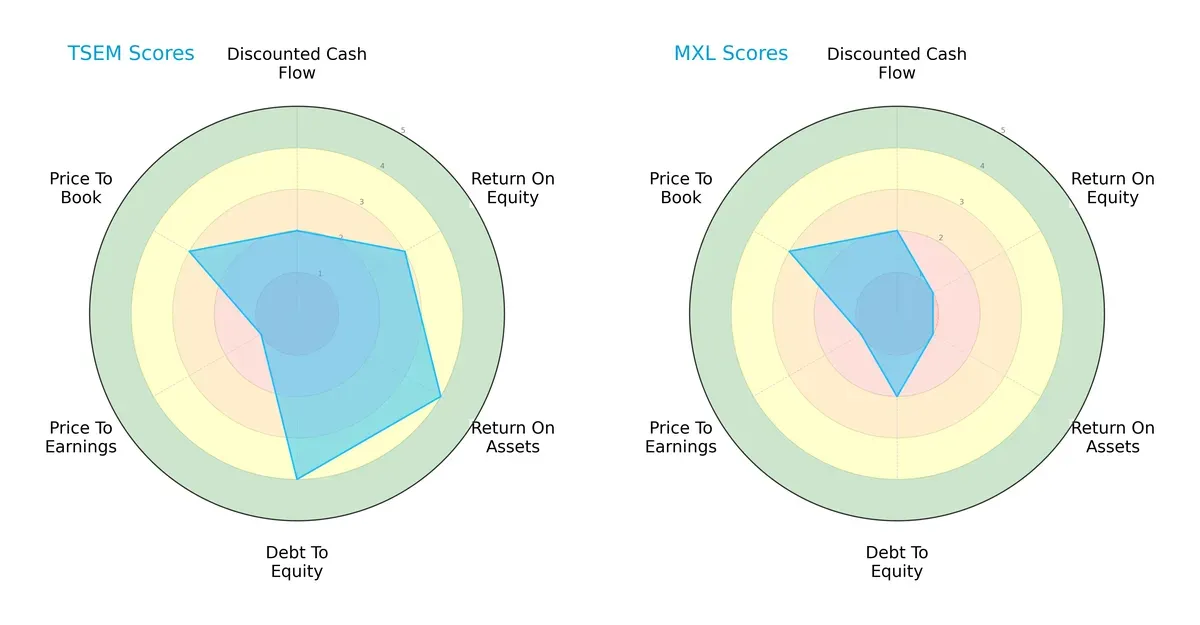
Tower Semiconductor shows a more balanced profile with moderate ROE (3) and strong ROA (4), paired with a solid debt-to-equity score (4). MaxLinear falters in profitability metrics, scoring very low in ROE (1) and ROA (1), relying more on valuation factors, though both suffer from very unfavorable P/E scores (1). Tower’s diversified strengths imply better operational efficiency, while MaxLinear depends heavily on potential undervaluation.
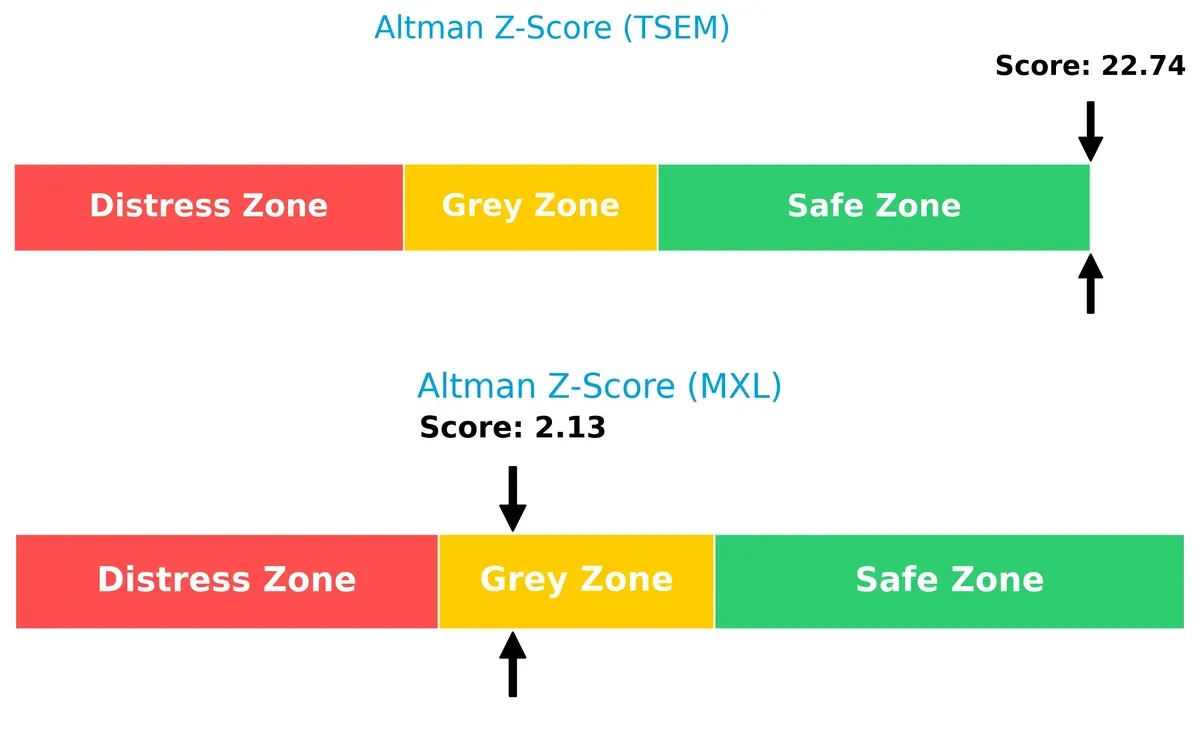
Bankruptcy Risk: Solvency Showdown
Tower Semiconductor’s Altman Z-Score of 22.7 places it comfortably in the safe zone, far exceeding MaxLinear’s 2.1, which lingers in the grey zone. This gap signals Tower’s superior long-term financial resilience and a lower bankruptcy risk amid current market uncertainties:
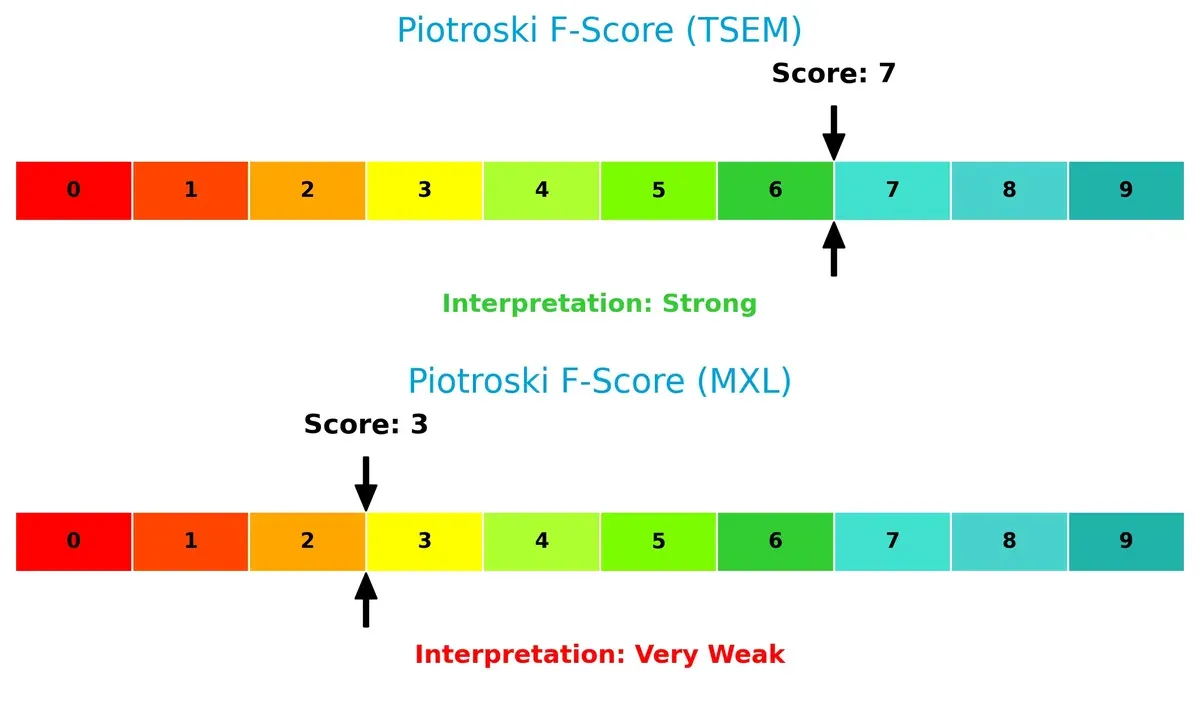
Financial Health: Quality of Operations
Tower Semiconductor’s Piotroski F-Score of 7 indicates strong financial health with robust internal metrics. MaxLinear’s score of 3 flags potential red flags, suggesting weaker profitability, liquidity, or operational efficiency compared to Tower:
How are the two companies positioned?
This section dissects the operational DNA of Tower Semiconductor and MaxLinear by comparing their revenue distribution and internal strengths and weaknesses. The goal is to confront their economic moats and reveal which model offers the most resilient competitive advantage today.
Revenue Segmentation: The Strategic Mix
The following comparison dissects how Tower Semiconductor Ltd. and MaxLinear, Inc. diversify their income streams and where their primary sector bets lie:
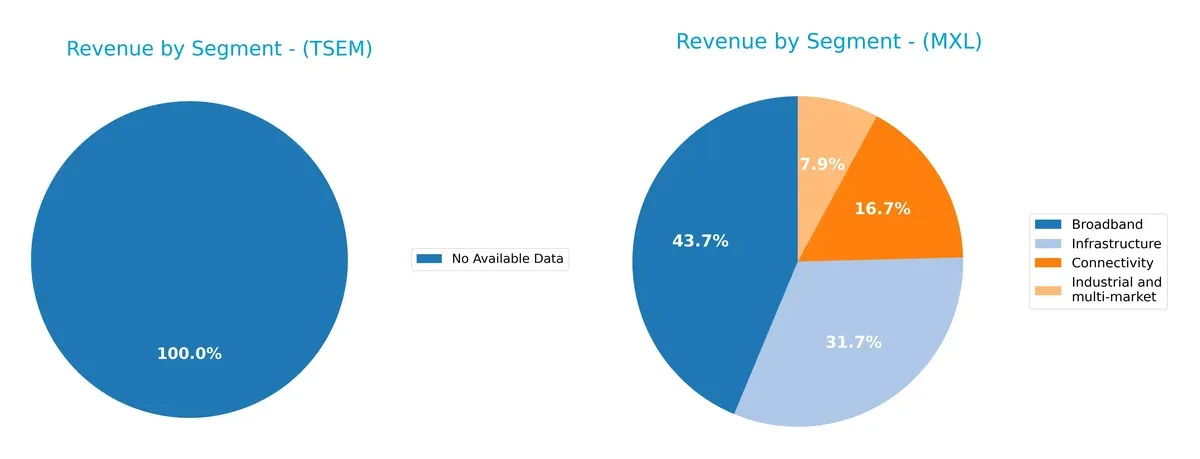
Tower Semiconductor Ltd. lacks available segmentation data, preventing direct comparison. MaxLinear, Inc. shows a diversified mix, with Broadband anchoring revenue at $204M in 2025, followed by Infrastructure at $148M and smaller segments like Connectivity and Industrial. MaxLinear’s spread reduces concentration risk, leveraging multiple markets. In contrast, Tower’s unknown mix poses uncertainty, increasing investment risk due to lack of transparency.
Strengths and Weaknesses Comparison
This table compares the Strengths and Weaknesses of Tower Semiconductor Ltd. (TSEM) and MaxLinear, Inc. (MXL):
TSEM Strengths
- Favorable net margin at 14.47%
- Low debt-to-assets at 5.87%
- High interest coverage at 31.57
- Strong quick ratio at 5.23
- Favorable WACC at 7.98%
MXL Strengths
- Diverse revenue segments across Broadband, Connectivity, Infrastructure
- Favorable current and quick ratios
- Moderate debt-to-assets at 17.23%
- Strong fixed asset turnover at 4.65
- Global presence with significant Asia revenue
TSEM Weaknesses
- Unfavorable ROE at 7.83% below WACC
- High current ratio at 6.18 signals possible inefficiency
- Unfavorable asset turnover at 0.47
- Unfavorable PE at 27.54
- No dividend yield
MXL Weaknesses
- Negative net margin at -68.01%
- Negative ROE and ROIC indicate poor profitability
- Unfavorable interest coverage at -13.01
- Unfavorable PB ratio at 3.2
- No dividend yield
The comparison reveals that TSEM maintains stronger profitability and capital efficiency metrics, despite some liquidity concerns. MXL shows operational diversification and decent asset use but struggles with sustained negative profitability and earnings quality. These factors suggest distinct strategic challenges for each company.
The Moat Duel: Analyzing Competitive Defensibility
A structural moat shields long-term profits from relentless competition erosion. Its strength defines who dominates markets and who fades:
Tower Semiconductor Ltd.: Technological Customization Moat
Tower’s moat stems from its specialized analog and mixed-signal foundry services, creating high switching costs for clients. This niche drives stable gross margins near 24%. Despite recent margin pressures, Tower’s expanding process technologies could reinforce its position in automotive and aerospace sectors by 2026.
MaxLinear, Inc.: Integrated Communications SoC Moat
MaxLinear’s moat relies on system-on-chip integration for broadband and RF communications, differentiating it from Tower’s foundry focus. High gross margins above 56% demonstrate pricing power despite negative net margins. If MaxLinear capitalizes on 5G infrastructure growth, it may reverse its profit erosion and deepen market footholds.
Custom Silicon Solutions vs. Communications Integration: Moat Resilience in Focus
Tower’s growing ROIC trend, despite slight value destruction, suggests improving capital efficiency. MaxLinear’s steep ROIC decline signals weakening competitive advantage. I see Tower possessing the deeper moat, better equipped to defend and expand market share through technological customization.
Which stock offers better returns?
The past year shows starkly divergent price movements between Tower Semiconductor Ltd. and MaxLinear, Inc., with Tower experiencing strong acceleration and MaxLinear remaining under pressure despite recent gains.

Trend Comparison
Tower Semiconductor Ltd. (TSEM) posted a robust 342.38% price increase over 12 months, signaling a bullish trend with accelerating gains and a high volatility level (27.35 std deviation).
MaxLinear, Inc. (MXL) declined 4.91% over the same period, indicating a bearish trend despite a recent 24.11% uptick and low volatility (3.34 std deviation).
TSEM clearly outperformed MXL over the past year, delivering substantially higher returns and stronger upward momentum.
Target Prices
Analysts present a mixed but constructive outlook on Tower Semiconductor Ltd. and MaxLinear, Inc.
| Company | Target Low | Target High | Consensus |
|---|---|---|---|
| Tower Semiconductor Ltd. | 66 | 125 | 96 |
| MaxLinear, Inc. | 15 | 25 | 21 |
Tower Semiconductor’s target consensus at $96 sits below its current price of $137, suggesting potential downside or overvaluation. MaxLinear’s consensus at $21 exceeds its $16.74 price, indicating possible upside.

Don’t Let Luck Decide Your Entry Point
Optimize your entry points with our advanced ProRealTime indicators. You’ll get efficient buy signals with precise price targets for maximum performance. Start outperforming now!
How do institutions grade them?
Here is the comparison of institutional grades for Tower Semiconductor Ltd. and MaxLinear, Inc.:
Tower Semiconductor Ltd. Grades
The latest grades from recognized firms for Tower Semiconductor Ltd. are as follows:
| Grading Company | Action | New Grade | Date |
|---|---|---|---|
| Benchmark | Maintain | Buy | 2026-01-09 |
| Wedbush | Downgrade | Neutral | 2025-12-31 |
| Benchmark | Maintain | Buy | 2025-11-11 |
| Susquehanna | Maintain | Positive | 2025-11-11 |
| Wedbush | Maintain | Outperform | 2025-11-11 |
| Barclays | Maintain | Equal Weight | 2025-11-11 |
| Benchmark | Maintain | Buy | 2025-09-08 |
| Susquehanna | Maintain | Positive | 2025-08-05 |
| Benchmark | Maintain | Buy | 2025-08-05 |
| Benchmark | Maintain | Buy | 2025-08-04 |
MaxLinear, Inc. Grades
Below are the most recent institutional grades for MaxLinear, Inc.:
| Grading Company | Action | New Grade | Date |
|---|---|---|---|
| Wells Fargo | Maintain | Equal Weight | 2026-01-30 |
| Benchmark | Maintain | Buy | 2026-01-16 |
| Benchmark | Maintain | Buy | 2025-10-24 |
| Benchmark | Maintain | Buy | 2025-10-17 |
| Benchmark | Maintain | Buy | 2025-09-02 |
| Loop Capital | Maintain | Hold | 2025-08-04 |
| Wells Fargo | Maintain | Equal Weight | 2025-07-24 |
| Benchmark | Maintain | Buy | 2025-07-24 |
| Susquehanna | Maintain | Neutral | 2025-07-24 |
| Susquehanna | Maintain | Neutral | 2025-07-22 |
Which company has the best grades?
Tower Semiconductor Ltd. has more consistent Buy and Positive ratings, though it faced a recent downgrade by Wedbush. MaxLinear, Inc. shows more neutral and equal weight grades. This suggests Tower Semiconductor currently enjoys stronger institutional conviction, potentially influencing investor confidence and stock momentum.
Risks specific to each company
The following categories identify the critical pressure points and systemic threats facing both firms in the 2026 market environment:
1. Market & Competition
Tower Semiconductor Ltd. (TSEM)
- Operates in a highly competitive semiconductor foundry market with diversified process technologies.
MaxLinear, Inc. (MXL)
- Faces intense competition in RF and mixed-signal SoCs, a segment with rapid innovation and price pressure.
2. Capital Structure & Debt
Tower Semiconductor Ltd. (TSEM)
- Maintains a low debt-to-equity ratio (0.07), indicating a strong balance sheet and manageable leverage.
MaxLinear, Inc. (MXL)
- Higher debt-to-equity (0.29) adds financial risk, especially given negative interest coverage.
3. Stock Volatility
Tower Semiconductor Ltd. (TSEM)
- Beta of 0.89 suggests moderate volatility below the market average, reflecting relative stability.
MaxLinear, Inc. (MXL)
- Beta of 1.71 signals high volatility, increasing risk for risk-averse investors.
4. Regulatory & Legal
Tower Semiconductor Ltd. (TSEM)
- Exposure to global regulatory frameworks in semiconductor manufacturing, including export controls.
MaxLinear, Inc. (MXL)
- Faces regulatory scrutiny in communications technology and export restrictions impacting international sales.
5. Supply Chain & Operations
Tower Semiconductor Ltd. (TSEM)
- Relies on complex wafer fabrication and global suppliers, vulnerable to geopolitical disruptions.
MaxLinear, Inc. (MXL)
- Dependent on component availability and manufacturing partners, with risks from supply bottlenecks.
6. ESG & Climate Transition
Tower Semiconductor Ltd. (TSEM)
- Increasing pressure to meet environmental targets in energy-intensive manufacturing processes.
MaxLinear, Inc. (MXL)
- Needs to address sustainability in product design and supply chain to meet rising ESG standards.
7. Geopolitical Exposure
Tower Semiconductor Ltd. (TSEM)
- Headquartered in Israel with significant international operations, exposed to Middle East tensions.
MaxLinear, Inc. (MXL)
- US-based but with global sales, subject to US-China trade tensions affecting semiconductor supply chains.
Which company shows a better risk-adjusted profile?
Tower Semiconductor faces its most significant risk in geopolitical exposure due to its Israel base and supply chain complexity. MaxLinear’s primary risk is its poor financial health, reflected in negative margins and weak interest coverage. TSEM’s strong balance sheet, lower volatility, and high Altman Z-score position it with a superior risk-adjusted profile. The stark contrast between TSEM’s safe zone Altman Z-score (22.7) and MXL’s grey zone (2.1) underscores MXL’s financial distress risk.
Final Verdict: Which stock to choose?
Tower Semiconductor Ltd. (TSEM) shines with its resilient cash generation and improving profitability, despite a cautious note on its stretched current ratio. This company suits investors seeking exposure to a semi-stable cash machine with growth potential. It aligns well with an Aggressive Growth portfolio aiming to capitalize on operational improvements.
MaxLinear, Inc. (MXL) boasts a strategic moat rooted in its strong research focus and intangible assets, supporting innovation in a niche market. Its financial safety profile is weaker than TSEM’s, reflecting ongoing challenges in profitability and capital efficiency. MXL may appeal to those with a Growth at a Reasonable Price (GARP) approach, willing to endure volatility for potential turnaround gains.
If you prioritize steady cash flow and improving returns on capital, Tower Semiconductor offers a more compelling choice due to its operational resilience and financial stability. However, if you seek exposure to a high-R&D player with a chance for a strategic rebound, MaxLinear provides a riskier but potentially rewarding scenario. Both demand vigilant risk management given their distinct profiles.
Disclaimer: Investment carries a risk of loss of initial capital. The past performance is not a reliable indicator of future results. Be sure to understand risks before making an investment decision.
Go Further
I encourage you to read the complete analyses of Tower Semiconductor Ltd. and MaxLinear, Inc. to enhance your investment decisions: