Home > Comparison > Technology > TXN vs MXL
The strategic rivalry between Texas Instruments Incorporated and MaxLinear, Inc. shapes the semiconductor industry’s evolution. Texas Instruments operates as a diversified semiconductor giant with a broad analog and embedded processing portfolio. In contrast, MaxLinear focuses on high-performance RF and mixed-signal SoCs for communications infrastructure. This analysis evaluates their contrasting growth models to identify which offers the superior risk-adjusted return for a balanced, technology-focused investment portfolio.
Table of contents
Companies Overview
Texas Instruments and MaxLinear stand as key players in the semiconductor market with contrasting scales and strategies.
Texas Instruments Incorporated: Semiconductor Powerhouse
Texas Instruments commands a dominant market position in semiconductors, focusing on analog and embedded processing chips. Its core revenue arises from power management and signal processing products that serve diverse sectors like automotive and industrial. In 2026, Texas Instruments emphasizes innovation in power-efficient solutions, reinforcing its broad product portfolio and global sales network.
MaxLinear, Inc.: Communications SoC Specialist
MaxLinear operates in the semiconductor sector with a focus on high-performance analog and mixed-signal SoCs for communications infrastructure. Its revenue streams stem from broadband transceivers, Wi-Fi routers, and 4G/5G radio modems. In 2026, MaxLinear prioritizes integrated end-to-end platform solutions to capture growth in connected home and wireless infrastructure markets.
Strategic Collision: Similarities & Divergences
Texas Instruments and MaxLinear both target semiconductor markets but differ in scale and product scope. Texas Instruments pursues a broad analog and embedded processing approach, while MaxLinear focuses on niche communication SoCs. They compete primarily in industrial and communications hardware. Their investment profiles contrast sharply: Texas Instruments offers scale and diversification; MaxLinear presents targeted growth with higher beta and volatility.
Income Statement Comparison
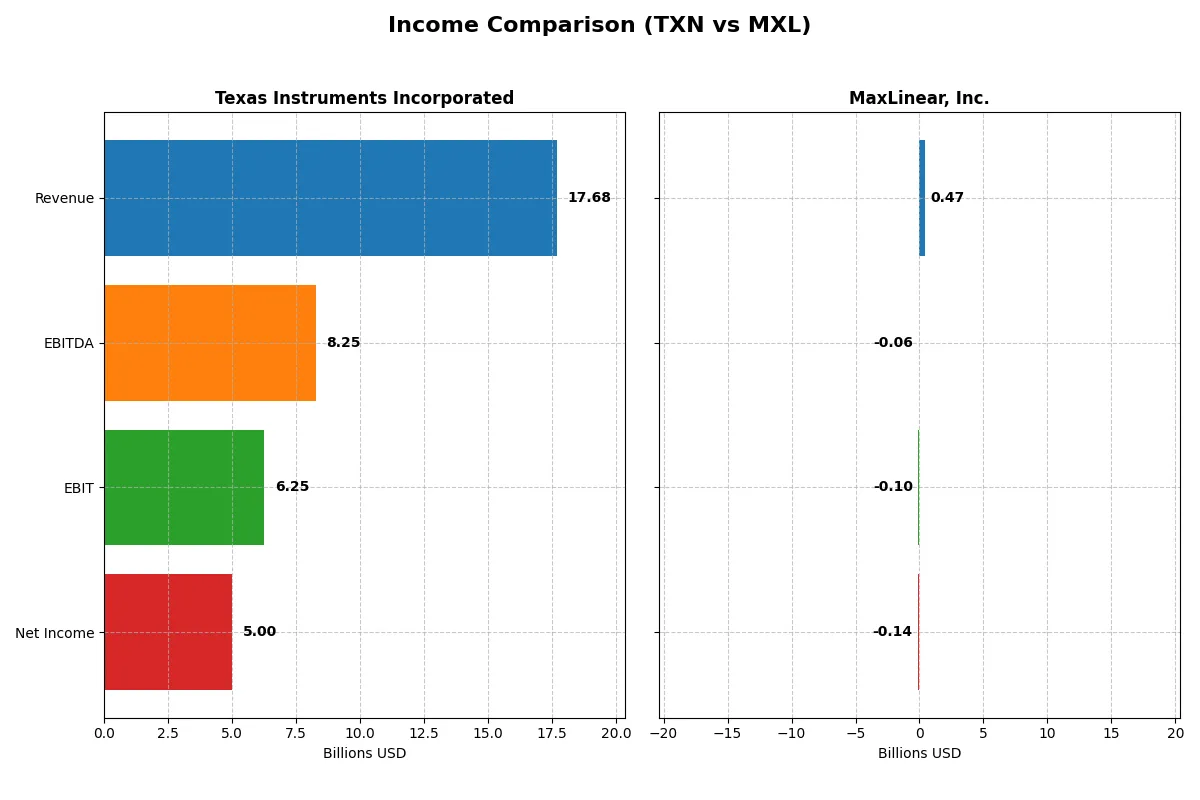
This data dissects the core profitability and scalability of both corporate engines to reveal who dominates the bottom line:
| Metric | Texas Instruments Incorporated (TXN) | MaxLinear, Inc. (MXL) |
|---|---|---|
| Revenue | 17.7B | 468M |
| Cost of Revenue | 7.6B | 202M |
| Operating Expenses | 4.1B | 393M |
| Gross Profit | 10.1B | 266M |
| EBITDA | 8.3B | -58M |
| EBIT | 6.3B | -102M |
| Interest Expense | 543M | 10M |
| Net Income | 5.0B | -137M |
| EPS | 5.45 | -1.58 |
| Fiscal Year | 2025 | 2025 |
Income Statement Analysis: The Bottom-Line Duel
The following income statement comparison reveals which company operates its business engine with greater efficiency and financial discipline.
Texas Instruments Incorporated Analysis
Texas Instruments shows a mixed revenue trajectory, with a slight decline overall but a 13% revenue increase from 2024 to 2025. Its gross margin remains strong at 57%, and net margin holds favorably at 28%, reflecting disciplined cost control. In 2025, TI’s net income reached $5B, demonstrating resilient profitability despite margin pressures.
MaxLinear, Inc. Analysis
MaxLinear’s revenue bounced back sharply with a 30% increase in 2025 after a steep decline over five years. The company’s gross margin stays healthy near 57%, but it suffers from negative EBIT and net margins, showing ongoing operational losses. Still, 2025 marked improvement in net margin growth and EPS, indicating early signs of operational momentum.
Profitability Rebound vs. Consistent Margin Strength
Texas Instruments commands the fundamental advantage with robust profitability and stable margins despite revenue fluctuations. MaxLinear’s strong revenue rebound is encouraging but offset by persistent net losses. Investors seeking dependable earnings should favor Texas Instruments’ consistent margin strength over MaxLinear’s recovery-driven profile.
Financial Ratios Comparison
These vital ratios act as a diagnostic tool to expose the underlying fiscal health, valuation premiums, and capital efficiency of the companies compared below:
| Ratios | Texas Instruments (TXN) | MaxLinear (MXL) |
|---|---|---|
| ROE | 30.7% | -30.2% |
| ROIC | 16.5% | -19.6% |
| P/E | 31.5 | -11.0 |
| P/B | 9.69 | 3.34 |
| Current Ratio | 4.35 | 1.34 |
| Quick Ratio | 2.83 | 0.92 |
| D/E (Debt-to-Equity) | 0.86 | 0.32 |
| Debt-to-Assets | 40.6% | 18.2% |
| Interest Coverage | 11.1 | -12.6 |
| Asset Turnover | 0.51 | 0.59 |
| Fixed Asset Turnover | 1.44 | 7.26 |
| Payout Ratio | 99.96% | 0% |
| Dividend Yield | 3.17% | 0% |
| Fiscal Year | 2025 | 2025 |
Efficiency & Valuation Duel: The Vital Signs
Financial ratios act as a company’s DNA, exposing hidden risks and operational strengths that shape investor confidence.
Texas Instruments Incorporated
Texas Instruments posts a strong 30.7% ROE and a healthy 28.3% net margin, signaling robust profitability. However, its P/E of 31.5 and P/B of 9.7 suggest the stock trades at a premium, reflecting high market expectations. The company supports shareholders with a solid 3.17% dividend yield, balancing returns with ongoing R&D investment above 11%.
MaxLinear, Inc.
MaxLinear shows negative profitability metrics, including a -30.3% ROE and a -29.2% net margin, revealing operational challenges. Its P/E ratio is negative, reflecting losses, but a moderate P/B of 3.3 suggests some asset value remains. The company pays no dividend, instead focusing heavily on R&D, allocating 44.6% of revenue toward innovation.
Premium Valuation vs. Operational Struggles
Texas Instruments offers a well-rounded profile with strong returns and shareholder payouts, despite a stretched valuation. MaxLinear’s metrics warn of ongoing losses and operational inefficiencies but highlight aggressive reinvestment. Investors seeking stability may prefer Texas Instruments, while those targeting turnaround potential might consider MaxLinear’s growth emphasis.
Which one offers the Superior Shareholder Reward?
Texas Instruments (TXN) delivers a superior shareholder reward compared to MaxLinear (MXL). TXN pays a steady dividend with a 3.17% yield and a near 100% payout ratio, fully covered by robust free cash flow (FCF) of 2.9B in 2025. TXN also executes disciplined buybacks, enhancing total return sustainably. By contrast, MXL pays no dividend, suffers negative net margins, and shows weak cash flow generation with minimal buyback activity. MXL reinvests heavily in growth but lacks the durable capital allocation efficiency TXN exhibits. For long-term investors in 2026, TXN’s balanced dividend and buyback strategy offers a more attractive and sustainable total return profile than MXL’s high-risk reinvestment approach.
Comparative Score Analysis: The Strategic Profile
The radar chart reveals the fundamental DNA and trade-offs of Texas Instruments and MaxLinear, highlighting their distinct operational strengths and valuation challenges:
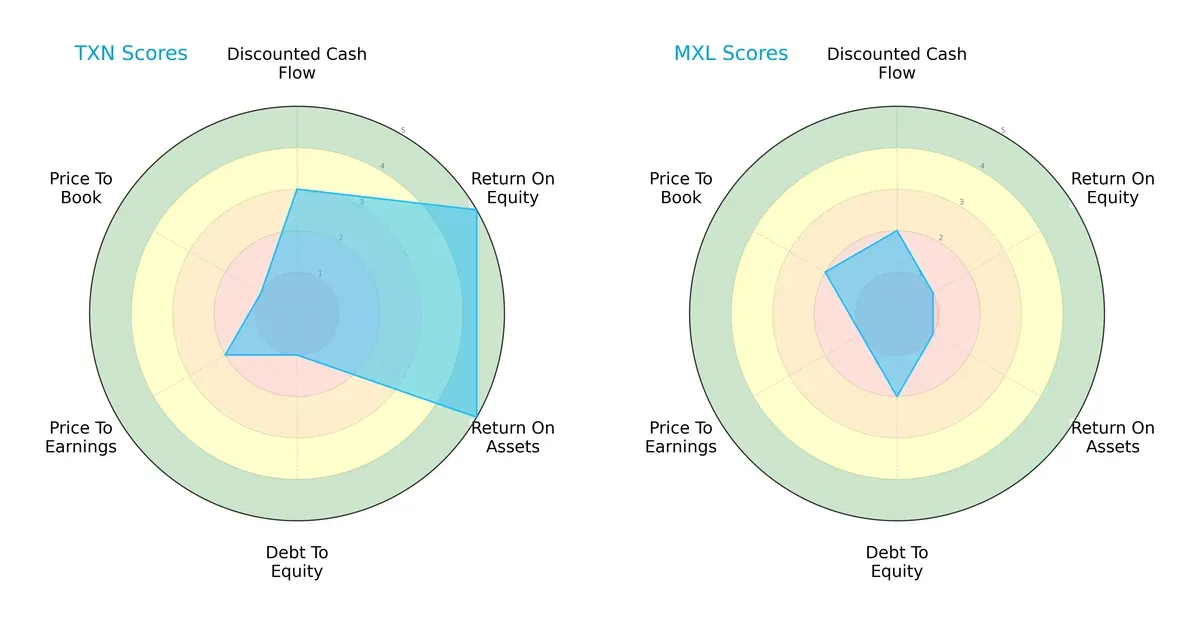
Texas Instruments demonstrates strong profitability with top ROE and ROA scores (5 each), reflecting efficient asset and equity utilization. However, its balance sheet shows risk with a very unfavorable debt-to-equity score (1). MaxLinear lags on profitability, scoring very low on ROE and ROA (1 each), but maintains a slightly better debt profile (2). Valuation metrics suggest Texas Instruments faces unfavorable P/E and P/B ratios, indicating potential overvaluation, while MaxLinear appears undervalued but with weaker fundamentals. Overall, Texas Instruments offers a more balanced profile anchored in operational excellence, while MaxLinear relies on a lower leverage advantage amid weaker returns.
Bankruptcy Risk: Solvency Showdown
The Altman Z-Score gap signals stark differences in long-term survival prospects in this cycle:
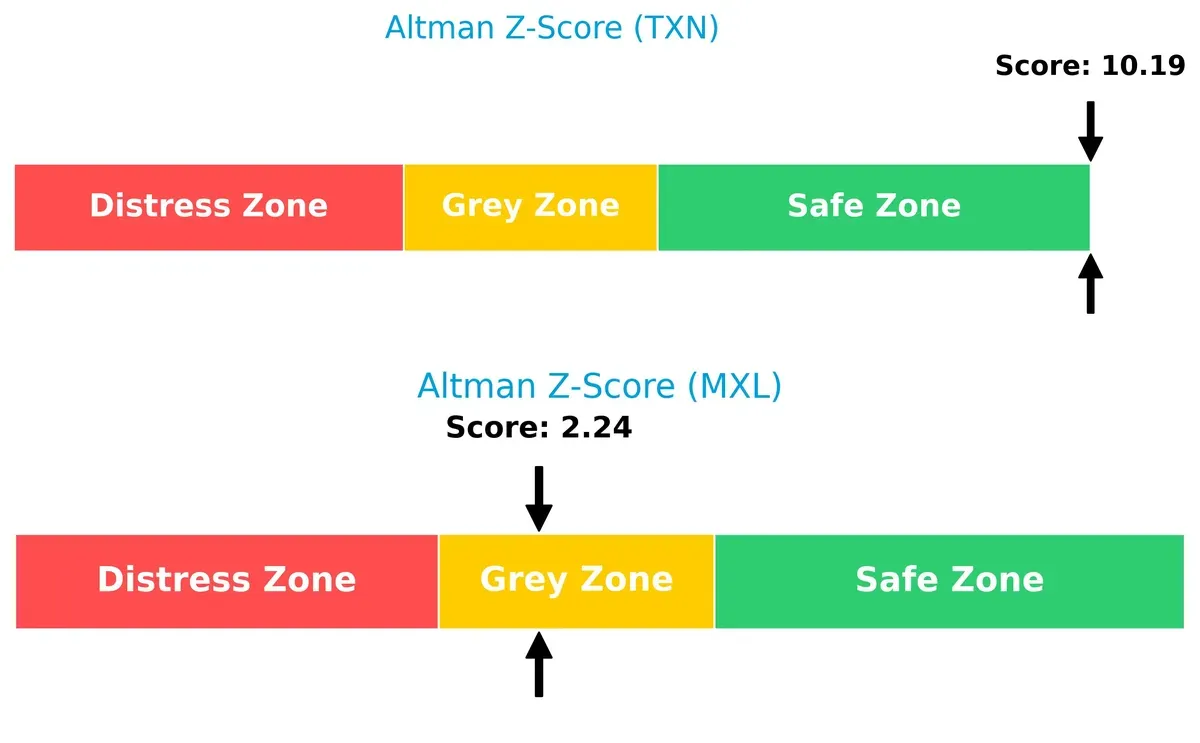
Texas Instruments scores a robust 10.2, placing it firmly in the safe zone. This indicates strong financial stability and low bankruptcy risk. MaxLinear’s 2.2 score situates it in the grey zone, implying moderate distress risk and the need for cautious monitoring.
Financial Health: Quality of Operations
Piotroski F-Score comparisons shed light on internal financial health and operational quality:
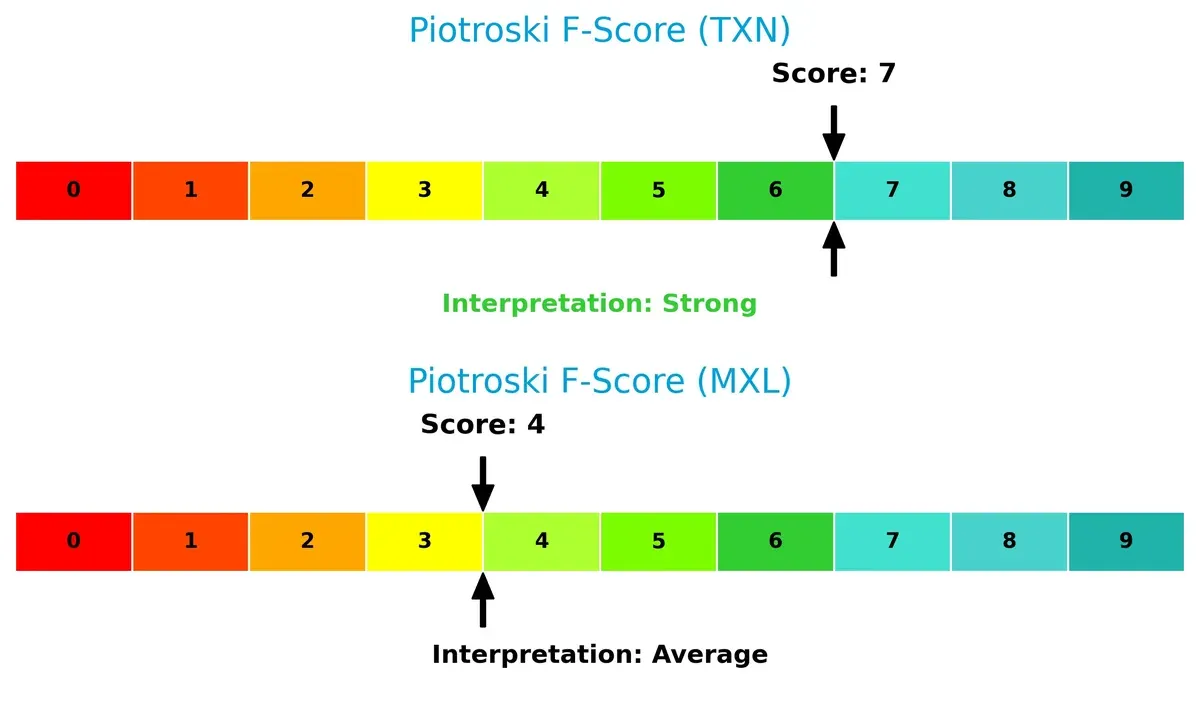
Texas Instruments, with a strong score of 7, evidences solid profitability, liquidity, and operational efficiency. MaxLinear’s average score of 4 raises red flags about weaker internal metrics and financial controls, suggesting it is less resilient to market shocks.
How are the two companies positioned?
This section dissects the operational DNA of Texas Instruments and MaxLinear by comparing their revenue distribution and internal strengths and weaknesses. The goal is to confront their economic moats to reveal which model offers the most resilient competitive advantage today.
Revenue Segmentation: The Strategic Mix
The following comparison dissects how Texas Instruments and MaxLinear diversify income streams and where their primary sector bets lie:
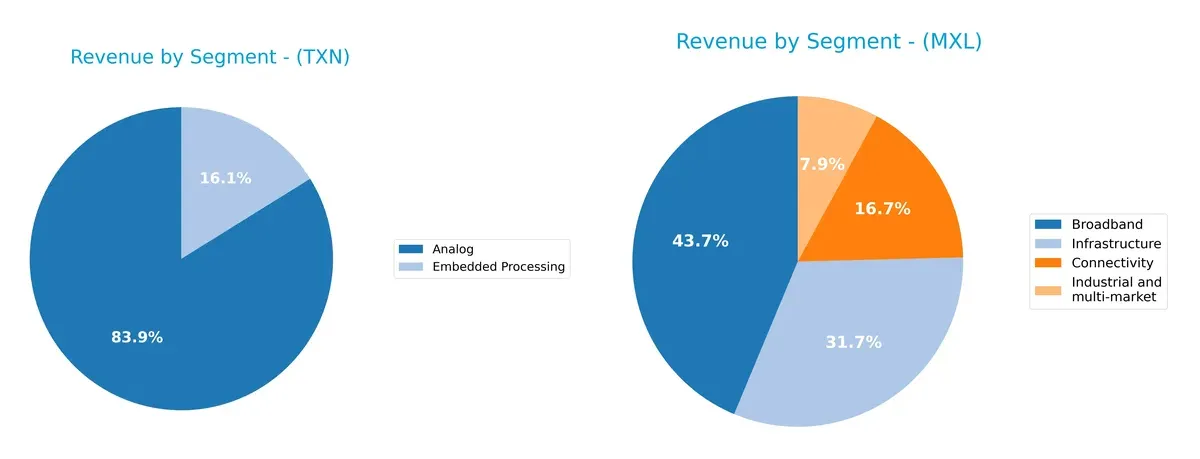
Texas Instruments dwarfs MaxLinear in scale, with Analog revenue hitting $14B in 2025, anchoring its portfolio. TI’s Embedded Processing at $2.7B shows moderate diversification but still relies heavily on Analog. MaxLinear’s revenues, smaller and more balanced, pivot across Broadband ($204M), Infrastructure ($148M), Connectivity ($78M), and Industrial ($37M). TI’s concentration poses concentration risk but benefits from infrastructure dominance, while MaxLinear’s spread reduces risk but limits ecosystem lock-in.
Strengths and Weaknesses Comparison
This table compares the Strengths and Weaknesses of Texas Instruments and MaxLinear based on diversification, profitability, financials, innovation, global presence, and market share:
Texas Instruments Strengths
- High profitability with 28.28% net margin and 30.73% ROE
- Strong ROIC at 16.52% above WACC
- Solid quick ratio at 2.83 and interest coverage of 11.52
- Diversified revenue from Analog and Embedded Processing segments
- Significant global presence with strong US and China sales
- Consistent dividend yield of 3.17%
MaxLinear Strengths
- Favorable low debt-to-equity ratio at 0.32 and low debt-to-assets at 18.21%
- High fixed asset turnover at 7.26 indicating efficient asset use
- Moderate diversification across Broadband, Connectivity, Industrial, and Infrastructure
- PE ratio favorable due to negative earnings context
- Global presence focused on Asia and Rest of World markets
- Growth in Broadband and Connectivity segments
Texas Instruments Weaknesses
- Unfavorable high PE at 31.53 and PB at 9.69 indicating possibly overvalued stock
- Unfavorable current ratio at 4.35 might signal inefficient asset use
- Moderate debt level with 40.62% debt-to-assets
- Asset turnover neutral at 0.51 may limit growth leverage
- Limited innovation info beyond segment revenue breakdowns
- Market share concentrated heavily in Analog segment
MaxLinear Weaknesses
- Negative profitability with -29.23% net margin, -30.25% ROE, and -19.58% ROIC
- Unfavorable WACC at 11.38% surpassing returns
- Negative interest coverage of -10.18 signals financial distress
- No dividend yield to attract income investors
- Limited scale with smaller revenue base and geographic presence
- PB ratio unfavorable at 3.34 reflecting valuation concerns
Texas Instruments demonstrates robust profitability and global diversification, underpinned by strong financial health but faces valuation and efficiency challenges. MaxLinear shows asset efficiency and low leverage but struggles with profitability and financial stability, highlighting significant risks in its current strategy.
The Moat Duel: Analyzing Competitive Defensibility
A structural moat is the sole shield protecting long-term profits from relentless competition erosion. Let’s dissect the competitive defenses of two semiconductor players:
Texas Instruments Incorporated: Durable Cost Advantage
Texas Instruments leverages an extensive analog and embedded processing portfolio to sustain a cost advantage. Its 35% EBIT margin and 8.4% ROIC premium over WACC confirm strong capital efficiency. In 2026, expanding industrial and automotive markets could deepen this moat, though declining ROIC signals caution.
MaxLinear, Inc.: Emerging Innovation Moat
MaxLinear relies on high-performance RF and mixed-signal SoCs for communications, differentiating from TI’s broad analog focus. Despite a negative EBIT margin and ROIC below WACC, recent 55% EBIT growth shows operational improvement. Future 5G and fiber network expansions may enable MaxLinear to build a stronger moat.
Cost Leadership vs. Innovation Growth: Who Holds the Moat Edge?
Texas Instruments currently possesses the wider and deeper moat with superior profitability and value creation. MaxLinear’s turnaround potential is promising but remains vulnerable. TI is better equipped to defend its market share in 2026’s competitive semiconductor landscape.
Which stock offers better returns?
The past year shows Texas Instruments’ stock climbing steadily with accelerating gains, while MaxLinear’s price rises moderately, both reflecting buyer-dominant trading patterns amid increasing volume.
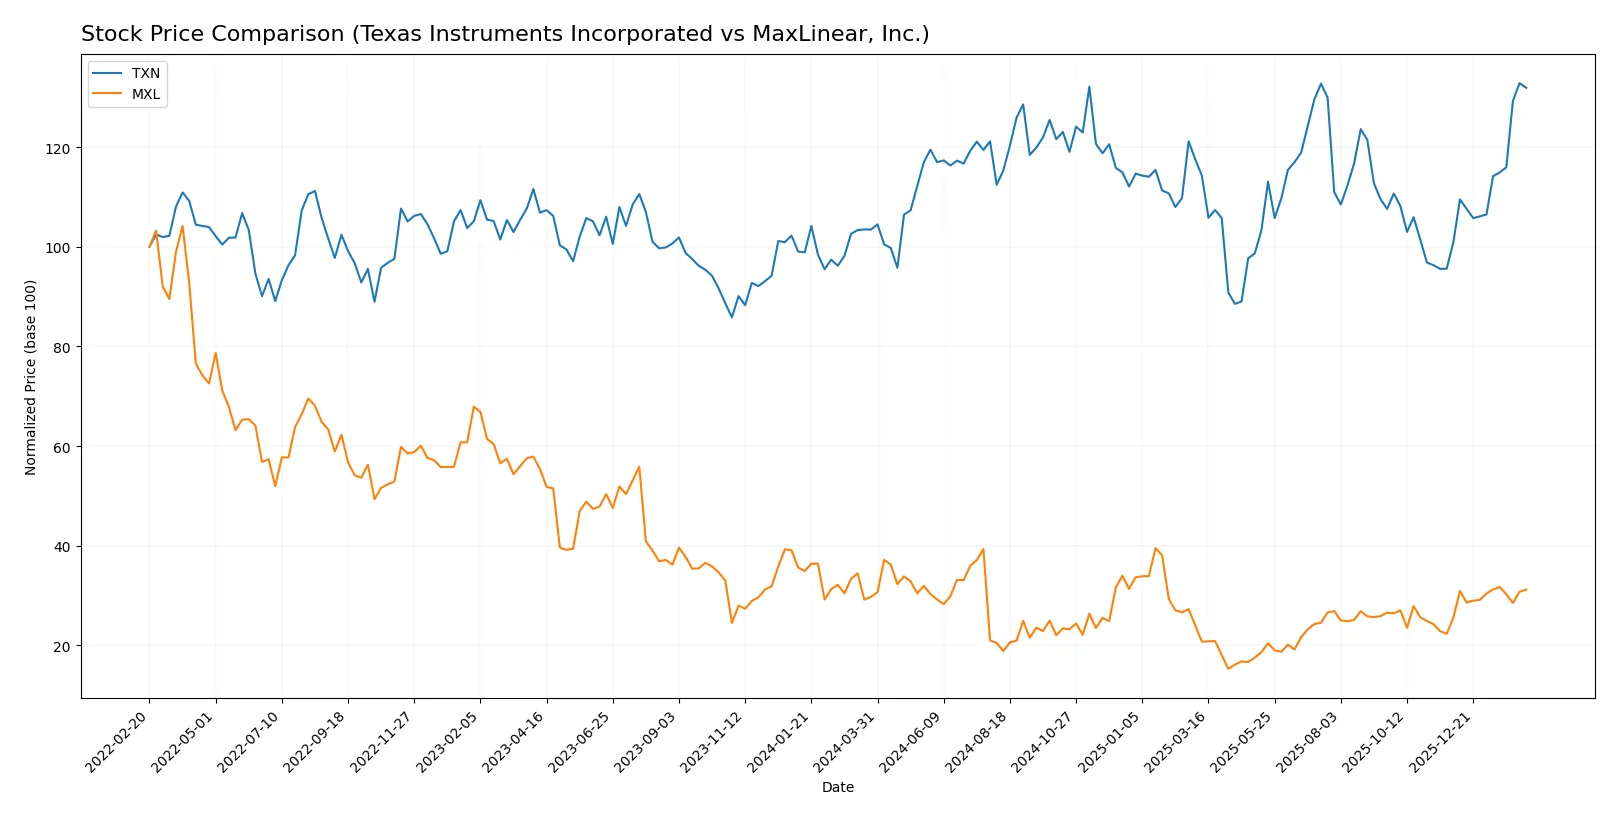
Trend Comparison
Texas Instruments’ stock price surged 27.5% over the past year, marking a bullish trend with accelerating momentum and a high volatility level of 16.43. It reached a peak of 221.44 and held a low near 147.6.
MaxLinear’s stock rose 4.86% over the same period, also bullish with acceleration but significantly lower volatility at 3.36. Its price ranged between 9.31 and a high of 24.05.
Comparing both, Texas Instruments delivered the highest market performance, substantially outperforming MaxLinear in total price appreciation and trend strength.
Target Prices
Analysts present a measured target consensus for Texas Instruments and MaxLinear, reflecting cautious optimism.
| Company | Target Low | Target High | Consensus |
|---|---|---|---|
| Texas Instruments Incorporated | 160 | 260 | 204.64 |
| MaxLinear, Inc. | 23 | 25 | 24 |
The consensus target for Texas Instruments sits below its current price of 221, signaling limited upside. MaxLinear’s targets suggest modest growth from the current 19.03 price, indicating moderate analyst confidence.

Don’t Let Luck Decide Your Entry Point
Optimize your entry points with our advanced ProRealTime indicators. You’ll get efficient buy signals with precise price targets for maximum performance. Start outperforming now!
How do institutions grade them?
Texas Instruments Incorporated Grades
The following table shows recent grades issued by reputable firms for Texas Instruments Incorporated:
| Grading Company | Action | New Grade | Date |
|---|---|---|---|
| Rosenblatt | Maintain | Buy | 2026-02-05 |
| JP Morgan | Maintain | Overweight | 2026-01-28 |
| Cantor Fitzgerald | Maintain | Neutral | 2026-01-28 |
| Wells Fargo | Maintain | Equal Weight | 2026-01-28 |
| Truist Securities | Maintain | Hold | 2026-01-28 |
| Stifel | Maintain | Hold | 2026-01-28 |
| UBS | Maintain | Buy | 2026-01-28 |
| Mizuho | Maintain | Underperform | 2026-01-28 |
| Jefferies | Maintain | Hold | 2026-01-28 |
| Benchmark | Maintain | Buy | 2026-01-28 |
MaxLinear, Inc. Grades
Below are recent grades assigned by established grading firms for MaxLinear, Inc.:
| Grading Company | Action | New Grade | Date |
|---|---|---|---|
| Wells Fargo | Maintain | Equal Weight | 2026-01-30 |
| Benchmark | Maintain | Buy | 2026-01-16 |
| Benchmark | Maintain | Buy | 2025-10-24 |
| Benchmark | Maintain | Buy | 2025-10-17 |
| Benchmark | Maintain | Buy | 2025-09-02 |
| Loop Capital | Maintain | Hold | 2025-08-04 |
| Susquehanna | Maintain | Neutral | 2025-07-24 |
| Wells Fargo | Maintain | Equal Weight | 2025-07-24 |
| Benchmark | Maintain | Buy | 2025-07-24 |
| Susquehanna | Maintain | Neutral | 2025-07-22 |
Which company has the best grades?
Texas Instruments holds a broader range of grades, including multiple Buy and Overweight ratings from top firms, reflecting stronger institutional confidence. MaxLinear’s grades skew toward Buy and Equal Weight without higher-tier recommendations. This disparity suggests investors may perceive Texas Instruments as having a more favorable outlook.
Risks specific to each company
The following categories identify the critical pressure points and systemic threats facing both firms in the 2026 market environment:
1. Market & Competition
Texas Instruments Incorporated
- Dominates mature analog and embedded processing markets with a strong moat and diversified end markets.
MaxLinear, Inc.
- Faces intense competition in specialized RF and mixed-signal SoC segments with limited scale and market share.
2. Capital Structure & Debt
Texas Instruments Incorporated
- Moderate leverage with debt-to-assets at 40.6%, interest coverage strong at 11.5x.
MaxLinear, Inc.
- Low leverage (18.2% debt-to-assets) but negative interest coverage indicating financial stress.
3. Stock Volatility
Texas Instruments Incorporated
- Beta near 1.0 suggests average market volatility, stable large-cap presence.
MaxLinear, Inc.
- High beta of 1.7 shows elevated volatility and risk sensitivity.
4. Regulatory & Legal
Texas Instruments Incorporated
- Operates globally with typical semiconductor regulatory risks; no major legal flags.
MaxLinear, Inc.
- Smaller footprint but exposed to regulations around communications technology and data security.
5. Supply Chain & Operations
Texas Instruments Incorporated
- Extensive global supply chain with scale advantages but exposed to semiconductor cycle swings.
MaxLinear, Inc.
- More vulnerable supply chain due to smaller size and niche components.
6. ESG & Climate Transition
Texas Instruments Incorporated
- Advancing sustainability practices typical of large tech firms; better ESG integration.
MaxLinear, Inc.
- ESG efforts less visible; smaller firms often lag in climate transition initiatives.
7. Geopolitical Exposure
Texas Instruments Incorporated
- Global operations expose it to US-China tensions and trade uncertainties.
MaxLinear, Inc.
- Similar geopolitical risks but with less global diversification, increasing vulnerability.
Which company shows a better risk-adjusted profile?
Texas Instruments faces moderate leverage and market risks but benefits from strong profitability, financial stability, and scale. MaxLinear struggles with negative profitability and financial distress signals, amplified by higher stock volatility and weaker capital structure. TI’s Altman Z-Score of 10.2 confirms a safe financial zone, while MaxLinear’s 2.2 signals vulnerability. The biggest risk for TI is geopolitical exposure, whereas MaxLinear’s critical risk is its financial distress and poor profitability. Overall, Texas Instruments shows a markedly better risk-adjusted profile for 2026 investors.
Final Verdict: Which stock to choose?
Texas Instruments stands out as a cash-generating powerhouse with a robust economic moat. Its efficiency in deploying capital and consistent profitability underpin its status. However, the stretched current ratio signals a liquidity vigilance point. It suits investors seeking steady, long-term growth in a portfolio emphasizing quality.
MaxLinear’s strategic moat lies in its aggressive R&D investment and potential for rapid innovation. It offers a lower debt burden, suggesting a more conservative financial structure. Yet, its negative returns and volatile profitability mark it as a speculative pick ideal for high-risk, high-reward portfolios.
If you prioritize durable profitability and capital efficiency, Texas Instruments outshines with a proven value-creation track record. However, if you seek aggressive growth with higher risk tolerance, MaxLinear offers a compelling scenario, banking on innovation but with considerable financial instability. Each fits a distinct investor profile, demanding careful risk calibration.
Disclaimer: Investment carries a risk of loss of initial capital. The past performance is not a reliable indicator of future results. Be sure to understand risks before making an investment decision.
Go Further
I encourage you to read the complete analyses of Texas Instruments Incorporated and MaxLinear, Inc. to enhance your investment decisions: