Home > Comparison > Technology > TER vs MXL
The competitive dynamic between Teradyne, Inc. and MaxLinear, Inc. shapes the semiconductor industry’s innovation and market direction. Teradyne operates as a capital-intensive leader in test equipment and industrial automation. MaxLinear focuses on high-performance analog and mixed-signal SoCs for communications infrastructure. This analysis confronts Teradyne’s scale and diversification against MaxLinear’s specialization, aiming to identify which company offers a superior risk-adjusted return for a diversified portfolio in 2026.
Table of contents
Companies Overview
Teradyne and MaxLinear both play pivotal roles in the semiconductor industry, shaping critical technology infrastructure globally.
Teradyne, Inc.: Leader in Automated Test Solutions
Teradyne dominates the automatic test equipment market, generating revenue from Semiconductor, System, Industrial Automation, and Wireless Test segments. Its core strength lies in wafer and device package testing across automotive, communications, and consumer electronics sectors. In 2026, Teradyne emphasizes expanding its industrial automation and advanced wireless test solutions to address growing IoT and 5G demands.
MaxLinear, Inc.: Innovator in RF and Mixed-Signal SoCs
MaxLinear specializes in high-performance analog and RF communication SoCs, powering broadband modems, Wi-Fi routers, and 4G/5G infrastructure. Its revenue hinges on integrated communication platforms combining RF, digital signal processing, and power management. The company’s 2026 strategy focuses on advancing end-to-end connectivity solutions for wired and wireless infrastructure markets.
Strategic Collision: Similarities & Divergences
Both companies operate in semiconductors but diverge sharply in scope: Teradyne’s strength is in testing and automation, while MaxLinear excels in integrated communication chips. Their competition centers on the evolving wireless and broadband infrastructure where testing and chip performance intersect. Teradyne offers a broad industrial automation moat; MaxLinear presents a niche in SoC innovation, defining distinct investment profiles.
Income Statement Comparison
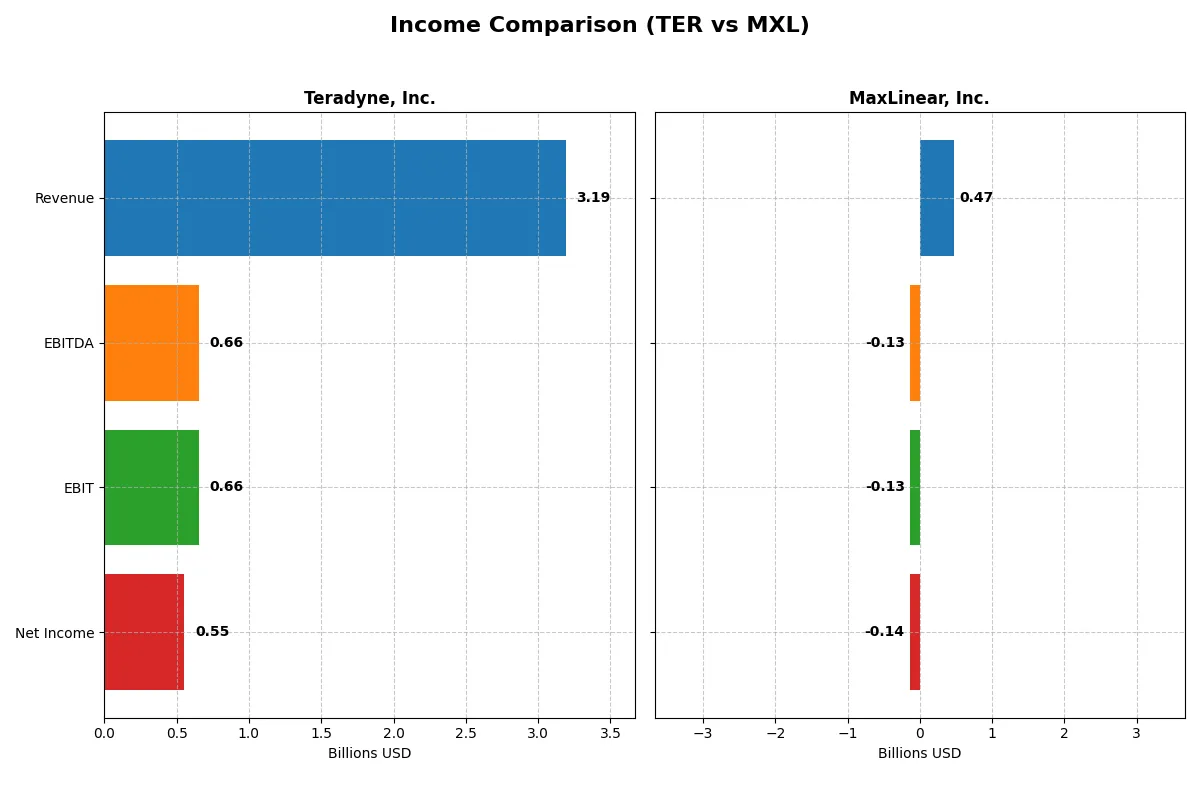
This table dissects the core profitability and scalability of both corporate engines to reveal who dominates the bottom line:
| Metric | Teradyne, Inc. (TER) | MaxLinear, Inc. (MXL) |
|---|---|---|
| Revenue | 3.19B | 468M |
| Cost of Revenue | 1.33B | 202M |
| Operating Expenses | 1.21B | 393M |
| Gross Profit | 1.86B | 266M |
| EBITDA | 656M | -131M |
| EBIT | 656M | -131M |
| Interest Expense | 8.0M | 10.1M |
| Net Income | 554M | -137M |
| EPS | 3.49 | -1.58 |
| Fiscal Year | 2025 | 2025 |
Income Statement Analysis: The Bottom-Line Duel
This income statement comparison reveals which company operates its business more efficiently and delivers stronger profitability momentum.
Teradyne, Inc. Analysis
Teradyne’s revenue grew steadily from 2.67B in 2023 to 3.19B in 2025, with net income rising from 449M to 554M. The company sustains robust margins, with a gross margin of 58.2% and net margin near 17.4% in 2025. Despite a slight net margin dip, Teradyne maintains solid operational efficiency and favorable earnings per share growth.
MaxLinear, Inc. Analysis
MaxLinear’s revenue recovered sharply from a low of 360M in 2024 to 468M in 2025, yet remains well below its 2022 peak of 1.12B. The firm faces challenges, posting a negative net income of -137M in 2025, reflecting a negative net margin of -29.2%. However, recent margin improvements and a 46% EPS growth show potential momentum in operational turnaround.
Consistent Profitability vs. Recovery Trajectory
Teradyne delivers consistent profitability with strong margins and steady net income growth, outperforming MaxLinear’s volatile revenue and persistent losses. Teradyne’s stable earnings profile appeals to investors prioritizing efficiency and margin resilience. MaxLinear offers a high-risk, high-reward turnaround story, suited for those seeking growth despite ongoing profitability challenges.
Financial Ratios Comparison
These vital ratios act as a diagnostic tool to expose the underlying fiscal health, valuation premiums, and capital efficiency of the companies analyzed:
| Ratios | Teradyne, Inc. (TER) | MaxLinear, Inc. (MXL) |
|---|---|---|
| ROE | 19.24% | -47.49% |
| ROIC | 17.25% | -24.31% |
| P/E | 36.93 | -6.74 |
| P/B | 7.11 | 3.20 |
| Current Ratio | 2.91 | 1.77 |
| Quick Ratio | 1.84 | 1.28 |
| D/E | 0.03 | 0.29 |
| Debt-to-Assets | 2.07% | 17.23% |
| Interest Coverage | 165.54 | -15.52 |
| Asset Turnover | 0.76 | 0.42 |
| Fixed Asset Turnover | 4.88 | 4.65 |
| Payout ratio | 14.09% | 0.00% |
| Dividend yield | 0.38% | 0.00% |
| Fiscal Year | 2024 | 2024 |
Efficiency & Valuation Duel: The Vital Signs
Financial ratios serve as a company’s DNA, exposing hidden risks and operational strengths behind the numbers.
Teradyne, Inc.
Teradyne posts a robust 19.24% ROE and a healthy 19.23% net margin, signaling strong profitability. Its P/E ratio at 36.93 suggests the stock is expensive relative to earnings. Despite a modest 0.38% dividend yield, Teradyne’s low debt and high interest coverage indicate financial resilience and operational efficiency.
MaxLinear, Inc.
MaxLinear displays deeply negative profitability metrics, with ROE at -47.49% and net margin at -68.01%. While its negative P/E reflects losses, the stock trades at a lower valuation multiple (P/B 3.2) than Teradyne. MaxLinear retains no dividend, focusing heavily on R&D amid operational challenges and a weaker balance sheet.
Premium Valuation vs. Operational Safety
Teradyne offers a favorable risk-reward balance with consistent profitability and sound financial health but trades at a premium. MaxLinear’s metrics reveal distress and growth investments, posing higher risk. Investors seeking stability may prefer Teradyne’s profile, while those betting on a turnaround face greater uncertainty with MaxLinear.
Which one offers the Superior Shareholder Reward?
I find Teradyne, Inc. (TER) offers a superior shareholder reward compared to MaxLinear, Inc. (MXL) in 2026. TER pays a modest dividend yield of 0.38% with a low 14% payout ratio, ensuring strong free cash flow coverage at 70%. TER also executes consistent buybacks, enhancing total return. In contrast, MXL pays no dividends and suffers negative margins with free cash flow deficits. MXL’s reinvestment focuses on growth but lacks profitability and sustainable capital allocation. TER’s balanced distribution with dividends and buybacks supports long-term value more reliably. Given the risk and return profiles, I favor TER for total shareholder return in 2026.
Comparative Score Analysis: The Strategic Profile
The radar chart reveals the fundamental DNA and trade-offs of Teradyne, Inc. and MaxLinear, Inc., highlighting their financial strengths and vulnerabilities:
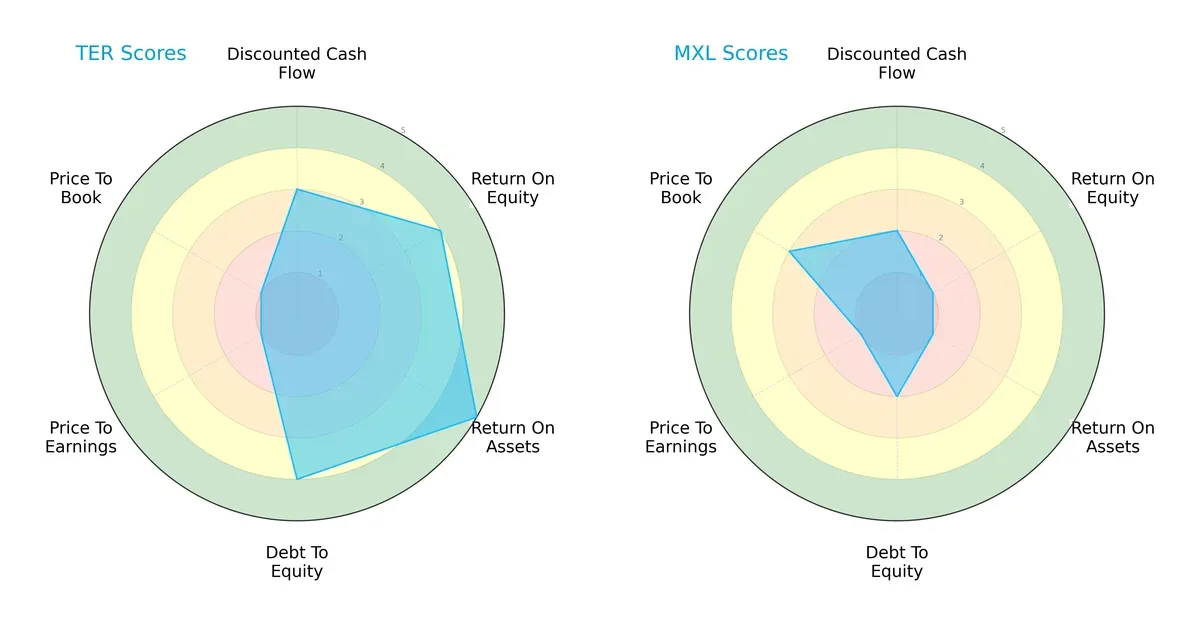
Teradyne demonstrates a balanced profile with strong ROE (4) and ROA (5) scores, signaling efficient asset use and profitability. It maintains a favorable debt-to-equity (4), supporting financial stability. However, its valuation metrics (PE/PB scores of 1 each) indicate possible overvaluation or market skepticism. MaxLinear leans heavily on its price-to-book score (3) but suffers from weak profitability scores (ROE 1, ROA 1) and moderate leverage (debt-to-equity 2). Overall, Teradyne offers a more consistent and robust financial foundation, while MaxLinear depends on valuation appeal amid operational weaknesses.
Bankruptcy Risk: Solvency Showdown
Teradyne’s Altman Z-Score of 19.9 far exceeds MaxLinear’s 2.13, signaling a stark contrast in long-term solvency prospects:
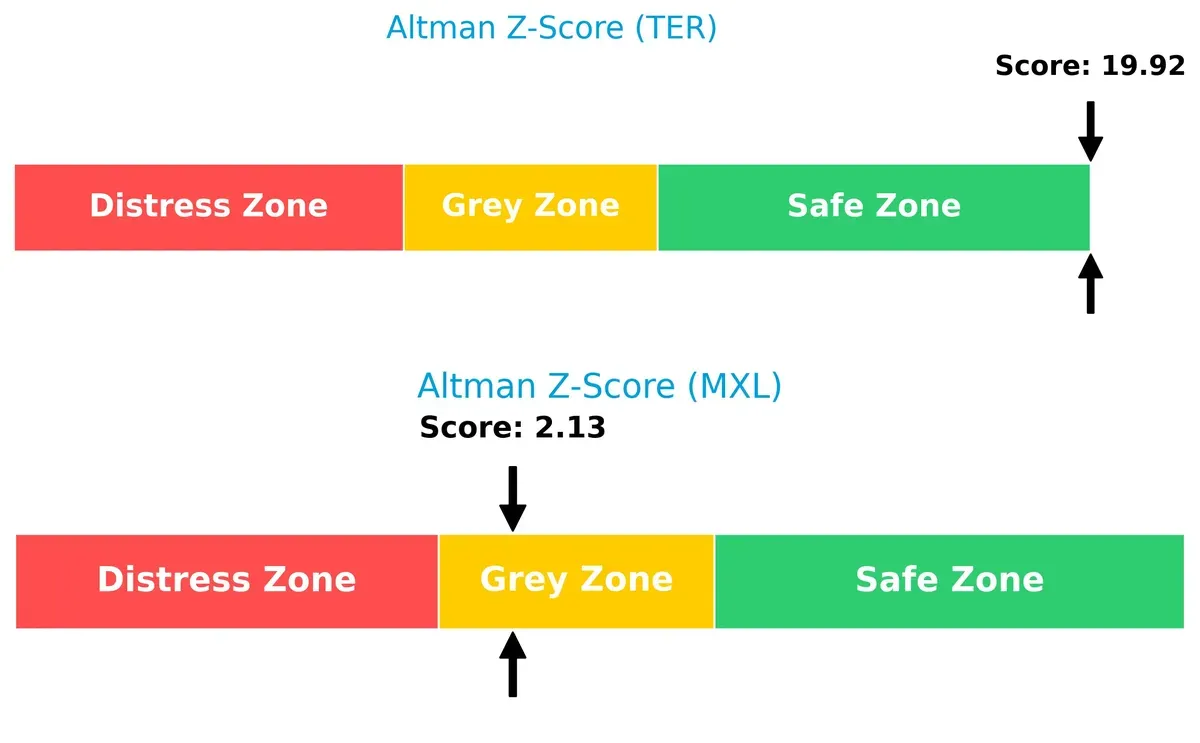
Teradyne resides well within the safe zone, reflecting its strong financial resilience and low bankruptcy risk despite market cycles. MaxLinear’s score in the grey zone warns of moderate distress potential, suggesting investors should monitor its cash flow and debt management closely in volatile conditions.
Financial Health: Quality of Operations
Teradyne’s Piotroski F-Score of 5 indicates average financial health, outperforming MaxLinear’s weak score of 3, which raises red flags on internal operational metrics:
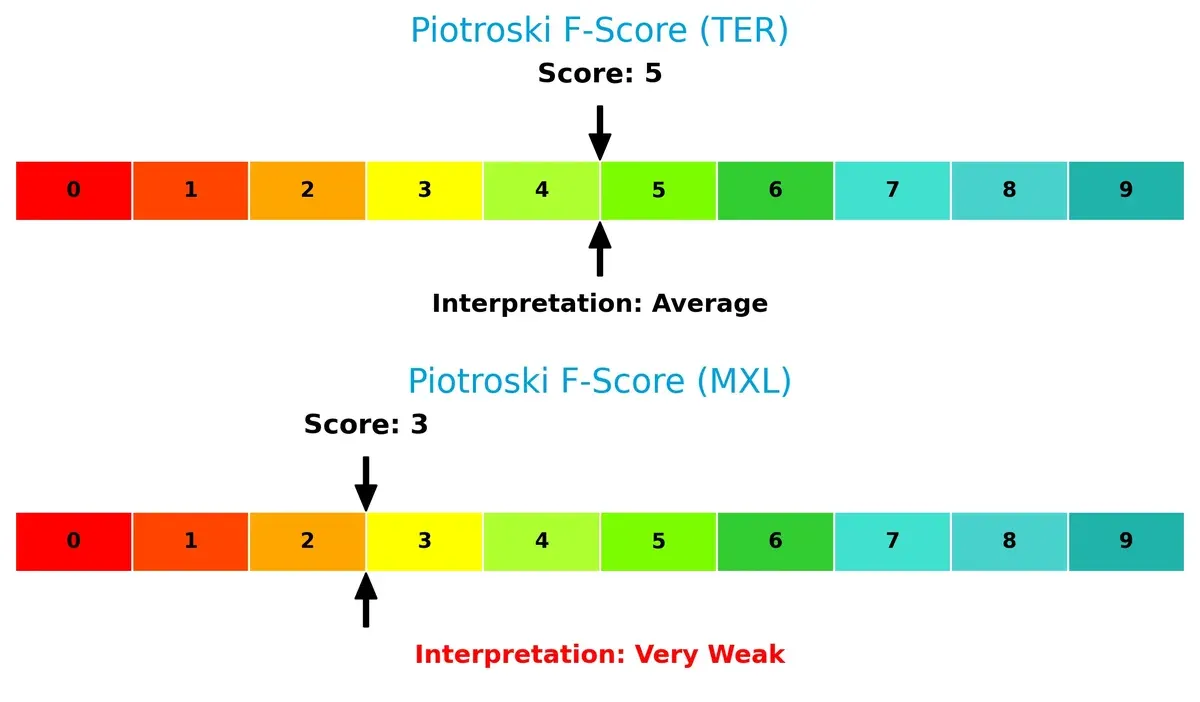
This disparity points to Teradyne’s superior profitability, liquidity, and efficiency. MaxLinear’s lower score reflects challenges in sustaining strong fundamentals, which may signal caution for risk-averse investors aiming for durable quality in their portfolio.
How are the two companies positioned?
This section dissects the operational DNA of Teradyne and MaxLinear by comparing their revenue distribution by segment and internal dynamics. The goal is to confront their economic moats to identify which model offers the most resilient competitive advantage today.
Revenue Segmentation: The Strategic Mix
The following comparison dissects how Teradyne, Inc. and MaxLinear, Inc. diversify their income streams and highlights their primary sector bets:
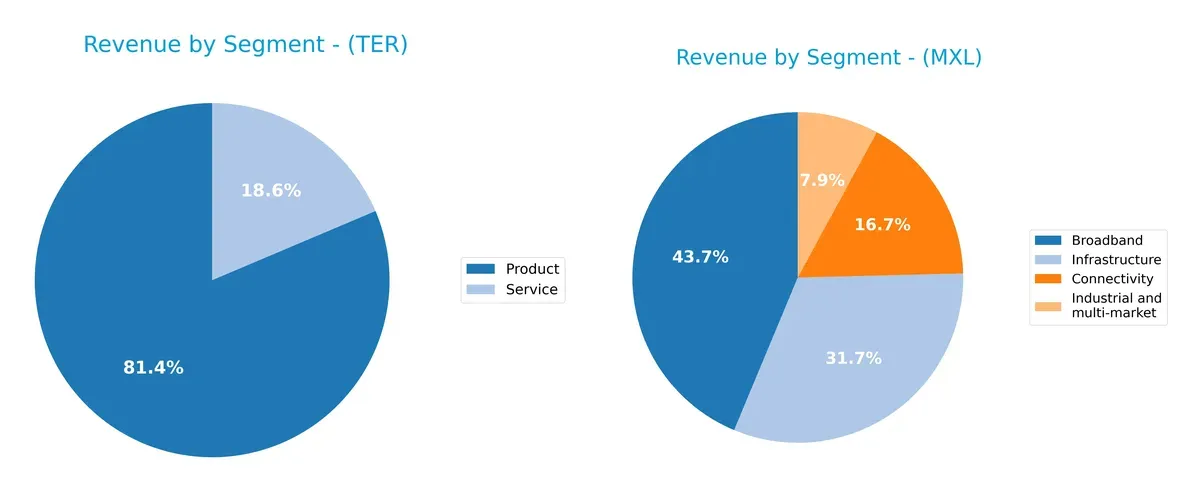
Teradyne anchors its revenue heavily in Products with $2.3B in 2024, supported by $525M in Services, showing moderate diversification. MaxLinear spreads its $370M total across Broadband ($117M), Infrastructure ($114M), Connectivity ($56M), and Industrial ($74M), revealing a more balanced mix. Teradyne’s concentration signals strength in semiconductor and test equipment but risks cyclical exposure. MaxLinear’s diversified footprint suggests resilience through varied market exposures.
Strengths and Weaknesses Comparison
This table compares the Strengths and Weaknesses of Teradyne, Inc. (TER) and MaxLinear, Inc. (MXL):
TER Strengths
- Strong net margin at 19.23%
- Favorable ROE at 19.24%
- Very low debt-to-equity at 0.03
- High current ratio at 2.91 indicates liquidity
- Diverse product and services revenue streams
- Global presence with substantial revenue in Asia and US
MXL Strengths
- Favorable PE ratio despite negative earnings
- Positive current and quick ratios showing liquidity
- Moderate debt-to-equity at 0.29
- Diverse revenue across broadband, connectivity, infrastructure
- Significant growth in Asia revenue
- Presence in multiple end markets including industrial
TER Weaknesses
- High PE at 36.93 suggests overvaluation risk
- High price-to-book ratio at 7.11
- Dividend yield low at 0.38%
- ROIC and WACC not available, limiting capital efficiency insight
- Asset turnover only neutral at 0.76
MXL Weaknesses
- Negative net margin at -68.01% and ROE at -47.49%
- Negative ROIC and interest coverage ratios
- Asset turnover low at 0.42 indicates inefficiency
- No dividend yield
- PB ratio unfavorable at 3.2
Teradyne exhibits strong profitability and liquidity with a robust global footprint, but valuation metrics raise caution. MaxLinear’s liquidity and market diversification are positives, though poor profitability and operational inefficiencies present significant challenges for capital allocation and growth strategies.
The Moat Duel: Analyzing Competitive Defensibility
A structural moat is the sole barrier protecting long-term profits from relentless competitive erosion. Let’s dissect how Teradyne and MaxLinear defend their turf:
Teradyne, Inc.: Intangible Assets Fueling Test Equipment Dominance
Teradyne’s moat stems from its proprietary test platforms and integrated automation systems. This delivers high gross margins (58%) and stable EBIT margins (20%) despite industry cyclicality. Emerging industrial automation products in 2026 may deepen its economic moat but declining ROIC trends warrant caution.
MaxLinear, Inc.: Cost Advantage in RF and Mixed-Signal SoCs
MaxLinear relies on cost-efficient, high-performance communications chips to compete. Despite a favorable revenue surge (+30% last year), it suffers negative EBIT and net margins, reflecting operational struggles. Its steep ROIC decline signals a shrinking moat, though recent margin improvements hint at potential turnaround opportunities.
Moat Battle: Proprietary Platforms vs. Cost Efficiency
Teradyne’s intangible asset moat offers deeper competitive protection than MaxLinear’s cost-driven position, especially given Teradyne’s margin stability. I see Teradyne better equipped to defend market share amid intensifying semiconductor test demands, while MaxLinear faces tougher value erosion risks.
Which stock offers better returns?
The past year reveals stark contrasts in price action and trading dynamics between Teradyne, Inc. and MaxLinear, Inc., highlighting divergent market sentiment and momentum.
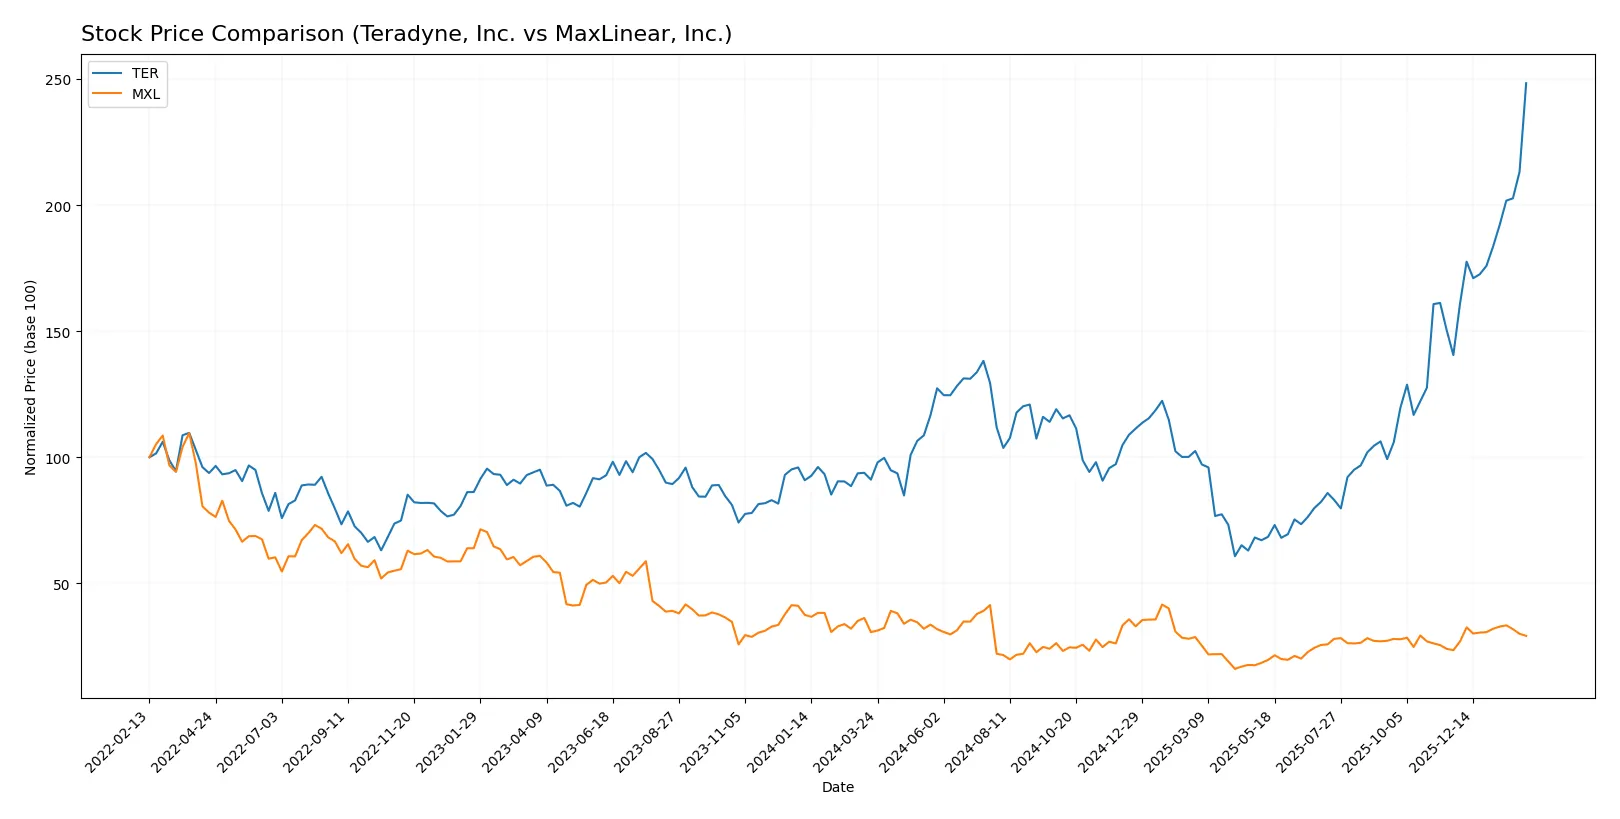
Trend Comparison
Teradyne, Inc. shows a strong bullish trend over 12 months with a 172.47% price increase and accelerating momentum. Prices soared from a 68.72 low to a 280.81 high, reflecting significant market enthusiasm.
MaxLinear, Inc. exhibits a bearish trend over the same period, with a 4.91% price decline despite recent acceleration. Its price range is narrower, between 9.31 and 24.05, and volatility remains modest.
Comparing both, Teradyne’s stock outperforms MaxLinear’s by a wide margin, delivering the highest market returns supported by robust buyer dominance and accelerating price gains.
Target Prices
Analysts show a mixed but generally optimistic target consensus for Teradyne, Inc. and MaxLinear, Inc.
| Company | Target Low | Target High | Consensus |
|---|---|---|---|
| Teradyne, Inc. | 136 | 280 | 230.17 |
| MaxLinear, Inc. | 15 | 25 | 21 |
Teradyne’s consensus target of 230.17 sits just below its current price of 280, signaling potential price compression or market premium. MaxLinear’s target consensus at 21 indicates upside from its current 16.85, reflecting moderate analyst optimism.

Don’t Let Luck Decide Your Entry Point
Optimize your entry points with our advanced ProRealTime indicators. You’ll get efficient buy signals with precise price targets for maximum performance. Start outperforming now!
How do institutions grade them?
Teradyne, Inc. Grades
The following table summarizes recent institutional grades for Teradyne, Inc.:
| Grading Company | Action | New Grade | Date |
|---|---|---|---|
| Evercore ISI Group | maintain | Outperform | 2026-02-03 |
| Cantor Fitzgerald | maintain | Overweight | 2026-02-02 |
| Stifel | maintain | Buy | 2026-01-30 |
| UBS | maintain | Buy | 2026-01-26 |
| B of A Securities | maintain | Buy | 2026-01-22 |
| Stifel | maintain | Buy | 2026-01-14 |
| B of A Securities | maintain | Buy | 2026-01-13 |
| Goldman Sachs | upgrade | Buy | 2025-12-16 |
| Stifel | upgrade | Buy | 2025-12-02 |
| Citigroup | maintain | Buy | 2025-11-12 |
MaxLinear, Inc. Grades
Below are recent institutional grades for MaxLinear, Inc.:
| Grading Company | Action | New Grade | Date |
|---|---|---|---|
| Wells Fargo | maintain | Equal Weight | 2026-01-30 |
| Benchmark | maintain | Buy | 2026-01-16 |
| Benchmark | maintain | Buy | 2025-10-24 |
| Benchmark | maintain | Buy | 2025-10-17 |
| Benchmark | maintain | Buy | 2025-09-02 |
| Loop Capital | maintain | Hold | 2025-08-04 |
| Wells Fargo | maintain | Equal Weight | 2025-07-24 |
| Benchmark | maintain | Buy | 2025-07-24 |
| Susquehanna | maintain | Neutral | 2025-07-24 |
| Susquehanna | maintain | Neutral | 2025-07-22 |
Which company has the best grades?
Teradyne, Inc. consistently receives “Buy” or better ratings, including “Outperform” and “Overweight” from top firms. MaxLinear’s grades center on “Buy” and “Equal Weight,” with some “Hold” and “Neutral.” Investors may view Teradyne’s stronger consensus ratings as a sign of higher institutional confidence.
Risks specific to each company
The following categories identify critical pressure points and systemic threats facing Teradyne, Inc. and MaxLinear, Inc. in the evolving 2026 market environment:
1. Market & Competition
Teradyne, Inc.
- Operates in diverse semiconductor test and automation segments with broad end markets, enhancing resilience.
MaxLinear, Inc.
- Focuses on RF and mixed-signal SoCs in competitive communications systems, facing intense pricing pressure.
2. Capital Structure & Debt
Teradyne, Inc.
- Extremely low debt-to-equity of 0.03, reflecting a conservative capital structure and strong financial stability.
MaxLinear, Inc.
- Higher leverage with debt-to-equity at 0.29, increasing financial risk amid weak profitability.
3. Stock Volatility
Teradyne, Inc.
- Beta of 1.82 indicates above-market volatility, typical for tech sector leaders with growth orientation.
MaxLinear, Inc.
- Beta of 1.71 also signals elevated volatility, compounded by recent negative price momentum.
4. Regulatory & Legal
Teradyne, Inc.
- Subject to global semiconductor export controls but diversified product lines reduce single-point regulatory risk.
MaxLinear, Inc.
- Faces regulatory scrutiny on communications tech standards compliance, with potential for costly adjustments.
5. Supply Chain & Operations
Teradyne, Inc.
- Complex global supply chains for semiconductor test equipment; supply disruptions could impact production cycles.
MaxLinear, Inc.
- Reliant on specialized components for RF SoCs, vulnerable to supply bottlenecks and input cost inflation.
6. ESG & Climate Transition
Teradyne, Inc.
- Industrial automation focus aligns with energy efficiency trends; ESG initiatives likely integrated but data limited.
MaxLinear, Inc.
- ESG performance less transparent; mixed-signal semiconductor manufacturing has moderate environmental impact.
7. Geopolitical Exposure
Teradyne, Inc.
- Exposure to US-China tensions due to semiconductor supply chain; diversified customer base mitigates risk.
MaxLinear, Inc.
- Similar geopolitical risks with concentrated exposure in communication infrastructure markets globally.
Which company shows a better risk-adjusted profile?
Teradyne’s strongest risk is market competition, given its premium valuation and growth expectations. MaxLinear’s most severe risk lies in capital structure and profitability, with negative margins and weak returns signaling distress. Teradyne exhibits a superior risk profile, supported by a robust Altman Z-score of 19.9 (safe zone) versus MaxLinear’s 2.1 (grey zone). This gap, combined with Teradyne’s conservative leverage and diversified segments, underscores its resilience amid market volatility and operational challenges.
Final Verdict: Which stock to choose?
Teradyne, Inc. stands out with its superpower of consistent operational efficiency and robust cash generation. Its financial discipline supports growth, although the premium valuation and declining ROIC trend warrant vigilance. It suits investors seeking aggressive growth fueled by solid execution in a competitive landscape.
MaxLinear, Inc. offers a strategic moat rooted in its specialized technology and recurring R&D investment, aiming for future market positioning. Relative to Teradyne, it presents a higher risk profile but potential for turnaround. This makes it a candidate for growth-at-a-reasonable-price (GARP) portfolios willing to tolerate volatility.
If you prioritize steady operational excellence and cash flow strength, Teradyne is the compelling choice due to its favorable financial health and market momentum. However, if you seek speculative growth with potential upside from innovation and restructuring, MaxLinear offers better upside but commands caution given its current value destruction.
Disclaimer: Investment carries a risk of loss of initial capital. The past performance is not a reliable indicator of future results. Be sure to understand risks before making an investment decision.
Go Further
I encourage you to read the complete analyses of Teradyne, Inc. and MaxLinear, Inc. to enhance your investment decisions: