Home > Comparison > Technology > TSM vs MXL
The strategic rivalry between Taiwan Semiconductor Manufacturing Company Limited and MaxLinear, Inc. shapes the semiconductor sector’s future. TSM dominates as a capital-intensive foundry giant with a global footprint, while MXL operates as a niche provider of high-performance analog and mixed-signal SoCs. This analysis explores their contrasting growth trajectories and capital allocation strategies, aiming to identify which stock offers superior risk-adjusted returns for diversified portfolios amid evolving industry dynamics.
Table of contents
Companies Overview
Taiwan Semiconductor Manufacturing Company Limited and MaxLinear, Inc. shape critical segments of the semiconductor industry with distinct market roles.
Taiwan Semiconductor Manufacturing Company Limited: Global Foundry Titan
Taiwan Semiconductor dominates as the world’s largest semiconductor foundry. It generates revenue by manufacturing integrated circuits and advanced wafer fabrication processes for diverse applications. Its 2026 strategy focuses on expanding cutting-edge CMOS technology and broadening support services to sustain its market leadership in high-performance computing and consumer electronics.
MaxLinear, Inc.: Communications SoC Innovator
MaxLinear specializes in radiofrequency and mixed-signal system-on-chip solutions for high-speed communications infrastructure. It earns through integrated SoCs used in broadband modems, routers, and 4G/5G base stations. The firm’s 2026 emphasis lies in enhancing end-to-end platform integration and expanding its footprint in wired and wireless connectivity, reinforcing its competitive edge in communications systems.
Strategic Collision: Similarities & Divergences
Both companies innovate within semiconductors but diverge sharply: Taiwan Semiconductor runs a foundry model enabling broad client fabrication, while MaxLinear pursues a vertically integrated SoC approach. Their primary battleground is advanced connectivity, where TSM’s scale contrasts with MXL’s niche specialization. This creates distinct investment profiles—one anchored in global manufacturing dominance, the other in specialized communications technology.
Income Statement Comparison
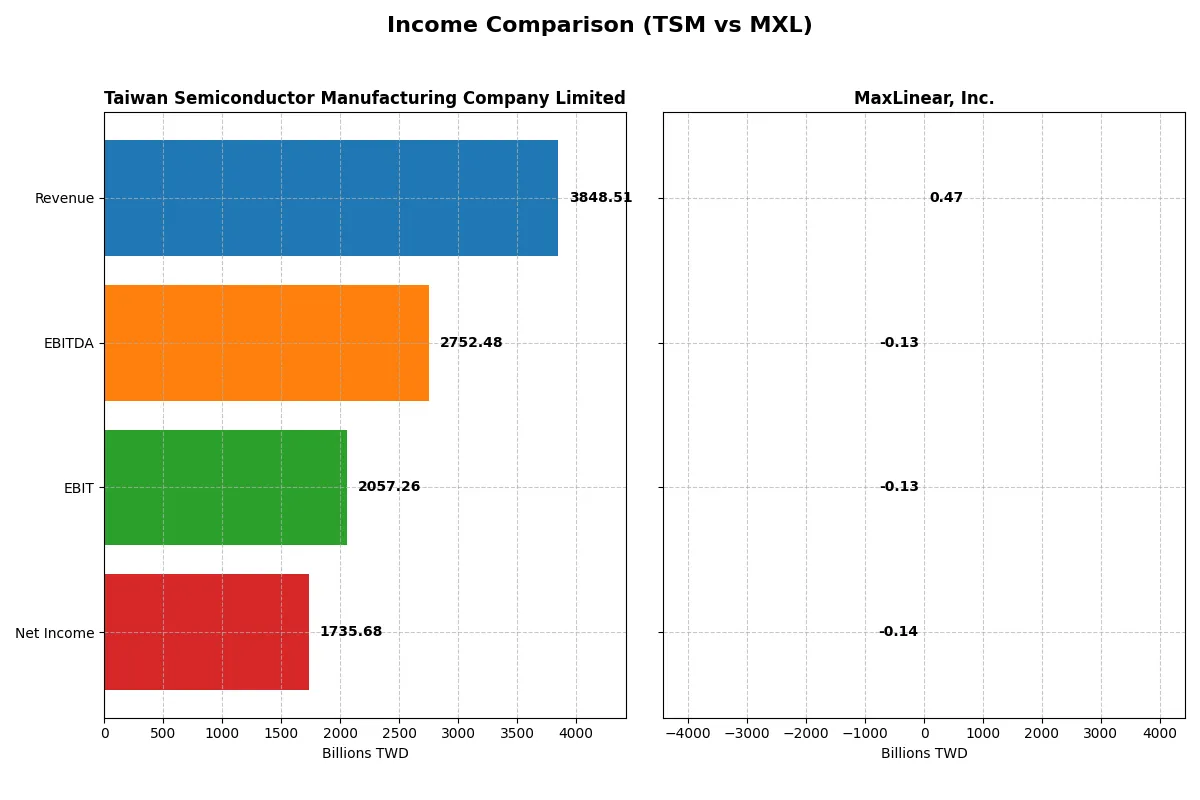
This data dissects the core profitability and scalability of both corporate engines to reveal who dominates the bottom line:
| Metric | Taiwan Semiconductor Manufacturing Company Limited (TSM) | MaxLinear, Inc. (MXL) |
|---|---|---|
| Revenue | 3.85T TWD | 468M USD |
| Cost of Revenue | 1.54T TWD | 202M USD |
| Operating Expenses | 349B TWD | 393M USD |
| Gross Profit | 2.30T TWD | 266M USD |
| EBITDA | 2.75T TWD | -131M USD |
| EBIT | 2.06T TWD | -131M USD |
| Interest Expense | 0 | 10M USD |
| Net Income | 1.74T TWD | -137M USD |
| EPS | 334.6 TWD | -1.58 USD |
| Fiscal Year | 2025 | 2025 |
Income Statement Analysis: The Bottom-Line Duel
The following income statement comparison exposes how each company converts revenue into profit, revealing their operational efficiency and growth momentum.
Taiwan Semiconductor Manufacturing Company Limited Analysis
TSM exhibits a robust upward trajectory, with revenue surging from 1.59T TWD in 2021 to 3.85T TWD in 2025. Net income more than doubled, reaching 1.74T TWD in 2025. Gross margin holds steady at nearly 60%, while net margin impresses at 45.1%, showcasing strong cost control and operational efficiency. Recent growth in revenue and earnings signals accelerating momentum.
MaxLinear, Inc. Analysis
MXL’s revenue fluctuates, peaking at 1.12B USD in 2022 but declining to 468M USD in 2025. Net income remains negative, though losses narrowed from -245M USD in 2024 to -137M USD in 2025. Gross margin is decent at 56.8%, but the net margin stands deeply negative at -29.2%, reflecting ongoing profitability struggles despite improving margins and operational adjustments.
Steady Growth and Margin Strength vs. Recovery Challenge
TSM outperforms MXL clearly, boasting consistent revenue and profit growth with high margins. MXL, while improving, still battles significant net losses and volatile top-line figures. Investors seeking durable operational efficiency will find TSM’s profile more compelling, while MXL’s recovery remains a longer-term risk to monitor.
Financial Ratios Comparison
These vital ratios act as a diagnostic tool to expose the underlying fiscal health, valuation premiums, and capital efficiency of the companies analyzed:
| Ratios | Taiwan Semiconductor Manufacturing Company Limited (TSM) | MaxLinear, Inc. (MXL) |
|---|---|---|
| ROE | 32.1% | -47.5% |
| ROIC | 24.9% | -24.3% |
| P/E | 28.5 | -6.74 |
| P/B | 9.14 | 3.20 |
| Current Ratio | 2.62 | 1.77 |
| Quick Ratio | 2.42 | 1.28 |
| D/E (Debt to Equity) | 0.18 | 0.29 |
| Debt-to-Assets | 12.5% | 17.2% |
| Interest Coverage | 0 | -15.5 |
| Asset Turnover | 0.49 | 0.42 |
| Fixed Asset Turnover | 1.05 | 4.65 |
| Payout ratio | 27.2% | 0% |
| Dividend yield | 0.95% | 0% |
| Fiscal Year | 2025 | 2024 |
Efficiency & Valuation Duel: The Vital Signs
Financial ratios serve as a company’s DNA, exposing hidden risks and operational strengths that shape investor decisions.
Taiwan Semiconductor Manufacturing Company Limited
TSMC posts a robust 32.1% ROE and a stellar 45.1% net margin, signaling strong profitability. Its P/E ratio of 28.45 appears stretched versus sector norms, reflecting premium valuation. The company sustains shareholder value through a modest 0.95% dividend yield, balancing cash returns with reinvestment in R&D and growth.
MaxLinear, Inc.
MaxLinear suffers from a negative 47.5% ROE and a steep -68.0% net margin, highlighting operational challenges. Its P/E is negative but low at -6.74, suggesting valuation struggles amid losses. The absence of dividends underscores a reinvestment focus on R&D, though negative free cash flow and weak coverage ratios raise caution flags.
Premium Valuation vs. Operational Safety
TSMC delivers a favorable ratio profile with strong profitability and a stable balance sheet, albeit at a premium price. MaxLinear’s unfavorable ratios and persistent losses increase investment risk despite potential growth bets. TSMC suits investors seeking operational safety; MaxLinear fits those willing to accept volatility for potential turnaround upside.
Which one offers the Superior Shareholder Reward?
I see Taiwan Semiconductor Manufacturing Company Limited (TSM) offers a more attractive shareholder reward than MaxLinear, Inc. (MXL) in 2026. TSM pays a steady dividend yielding about 1.08% with a sustainable payout ratio near 31%. Its free cash flow comfortably covers dividends and capex, supporting ongoing shareholder returns. TSM also runs significant buybacks, enhancing total return. In contrast, MXL pays no dividends and delivers negative free cash flow, reflecting losses and cash burn. MXL’s reinvestment focus on R&D and growth carries higher risk without immediate shareholder payout. TSM’s balanced dividend plus buyback strategy offers a superior, sustainable total return profile for conservative investors.
Comparative Score Analysis: The Strategic Profile
The radar chart reveals the fundamental DNA and trade-offs of both firms, highlighting their core financial strengths and vulnerabilities:
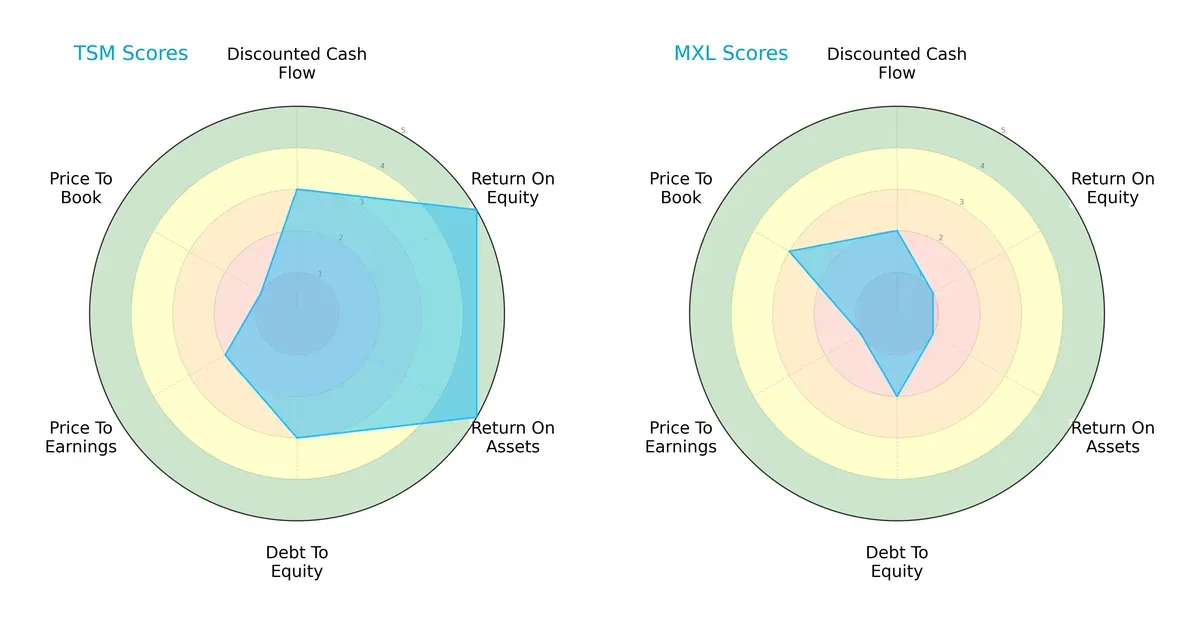
Taiwan Semiconductor Manufacturing Company Limited (TSM) shows a balanced profile with very strong returns on equity (5) and assets (5), moderate debt management (3), but struggles on valuation metrics, especially price-to-book (1). MaxLinear, Inc. (MXL) relies on a weaker operational edge, marked by low returns (ROE 1, ROA 1) and moderate debt control (2), though it holds a slightly better price-to-book score (3). TSM clearly leads in profitability and operational efficiency, while MXL depends more on relative valuation advantages.
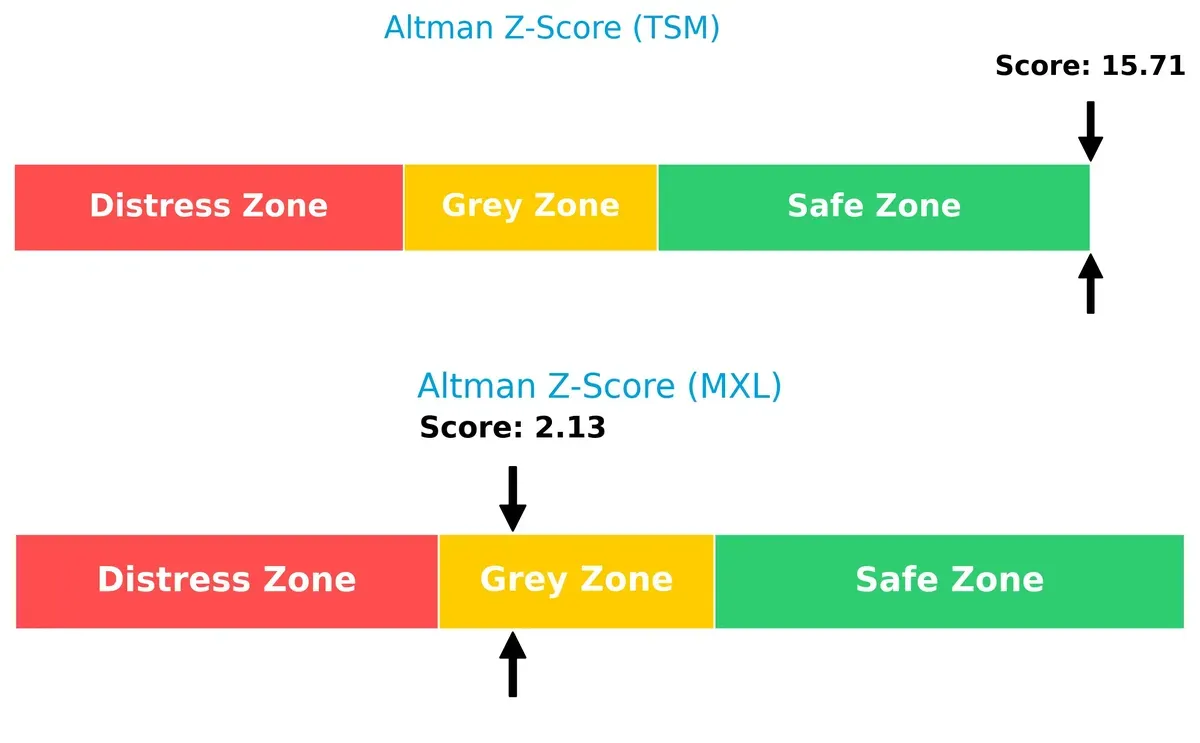
Bankruptcy Risk: Solvency Showdown
TSM’s Altman Z-Score of 15.7 places it deeply in the safe zone, indicating robust financial stability and very low bankruptcy risk. MXL’s score at 2.1 situates it in the grey zone, signaling moderate distress risk in this market cycle:
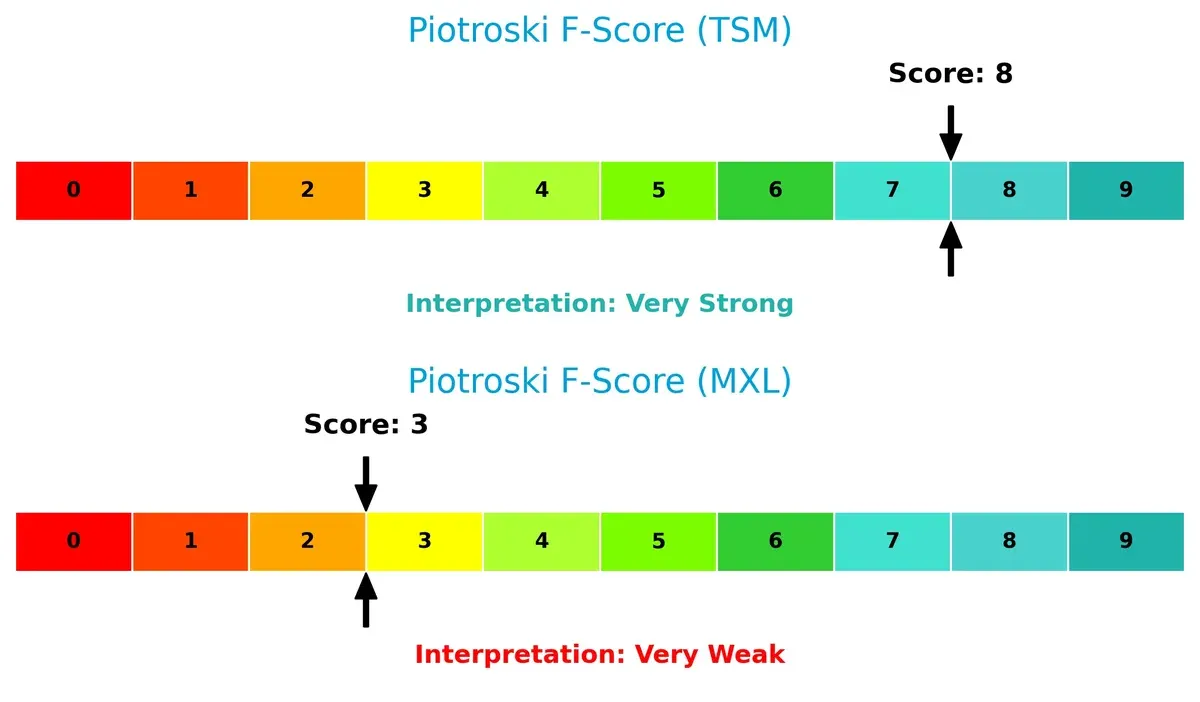
Financial Health: Quality of Operations
TSM scores an 8 on the Piotroski F-Score, reflecting very strong financial health with solid profitability, liquidity, and operational efficiency. Conversely, MXL’s score of 3 flags significant red flags, suggesting weak internal financial metrics and operational challenges:
How are the two companies positioned?
This section dissects the operational DNA of TSM and MXL by comparing their revenue distribution by segment and internal dynamics. The goal is to confront their economic moats and identify which model offers the most resilient competitive advantage today.
Revenue Segmentation: The Strategic Mix
This visual comparison dissects how Taiwan Semiconductor Manufacturing Company Limited and MaxLinear, Inc. diversify their income streams and where their primary sector bets lie:
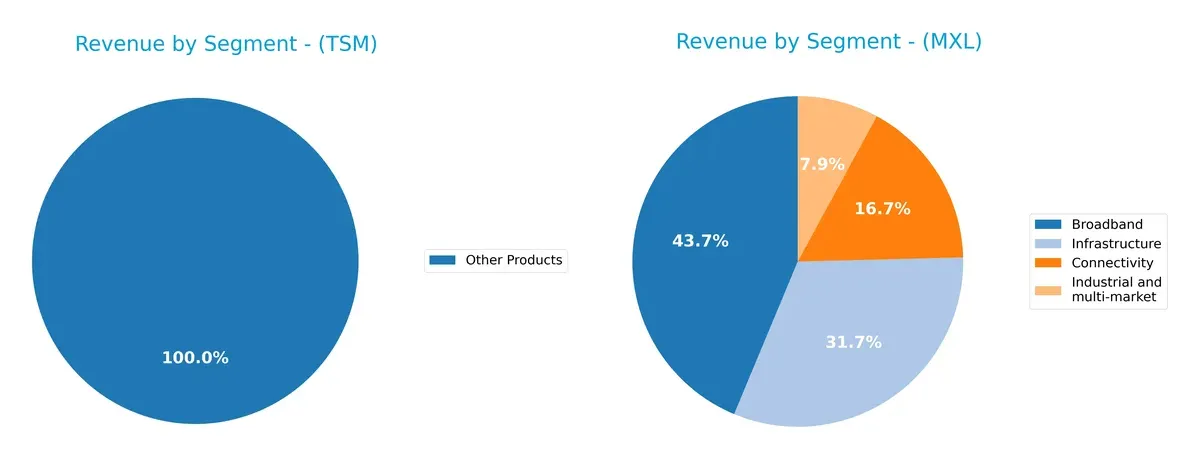
Taiwan Semiconductor anchors its revenue heavily in wafer sales, with 1.99T TWD in 2022, dwarfing its modest 272B TWD in other products. This concentration highlights TSM’s infrastructure dominance in semiconductor manufacturing. MaxLinear shows a more balanced mix in 2025, with Broadband at $204M, Infrastructure $148M, Connectivity $78M, and Industrial $37M, reducing concentration risk but lacking a dominant ecosystem lock-in.
Strengths and Weaknesses Comparison
This table compares the Strengths and Weaknesses of Taiwan Semiconductor Manufacturing Company Limited (TSM) and MaxLinear, Inc. (MXL):
TSM Strengths
- High net margin (45.1%) and ROE (32.12%) indicating strong profitability
- Low debt levels with favorable debt-to-assets (12.52%)
- Solid liquidity ratios (current 2.62, quick 2.42)
- Large global presence with significant revenue from US, China, and Taiwan
- Diverse product base including wafers and other products
MXL Strengths
- Favorable fixed asset turnover (4.65) indicating efficient asset use
- Positive current (1.77) and quick ratios (1.28) showing liquidity
- Moderate debt levels with favorable debt-to-assets (17.23%)
- Product diversification across broadband, connectivity, industrial, and infrastructure segments
- Presence in Asia and United States markets
TSM Weaknesses
- High price-to-book (9.14) and price-to-earnings ratio (28.45) may indicate overvaluation risk
- Asset turnover (0.49) is below ideal, reflecting moderate efficiency
- Dividend yield is low (0.95%) possibly limiting income appeal
- Limited diversification beyond wafer and other product categories
MXL Weaknesses
- Negative profitability metrics: net margin (-68.01%), ROE (-47.49%), and ROIC (-24.31%)
- Negative interest coverage (-13.01) signals financial stress
- Price-to-book (3.2) unfavorable and fluctuating PE ratio
- Zero dividend yield reduces investor income potential
- Asset turnover (0.42) is low
TSM demonstrates robust profitability, strong liquidity, and a well-established global presence, but it faces valuation and efficiency challenges. MXL shows operational strengths in asset usage and liquidity but suffers from significant profitability and financial stability issues, impacting its overall financial health.
The Moat Duel: Analyzing Competitive Defensibility
A structural moat is the only barrier protecting long-term profits from relentless competitive erosion. Let’s dissect the moats at play:
Taiwan Semiconductor Manufacturing Company Limited: Unmatched Scale and Technological Leadership
TSMC’s moat stems from its cutting-edge manufacturing scale and advanced process technology. This translates into superior ROIC above WACC and margin stability. Innovations in 3nm and 2nm nodes in 2026 could deepen this edge.
MaxLinear, Inc.: Niche Integration with Mixed-Signal SoCs
MaxLinear relies on specialized mixed-signal system-on-chip solutions, a narrower moat than TSMC’s. Its negative ROIC trend signals vulnerability, yet recent revenue growth hints at possible recovery via 5G infrastructure expansion.
Scale Dominance vs. Specialized Integration: The Moat Verdict
TSMC’s wide, durable moat outclasses MaxLinear’s narrow, fragile one. TSMC’s expanding ROIC and technological scale better defend market share against rivals. MaxLinear faces significant risks sustaining profitability.
Which stock offers better returns?
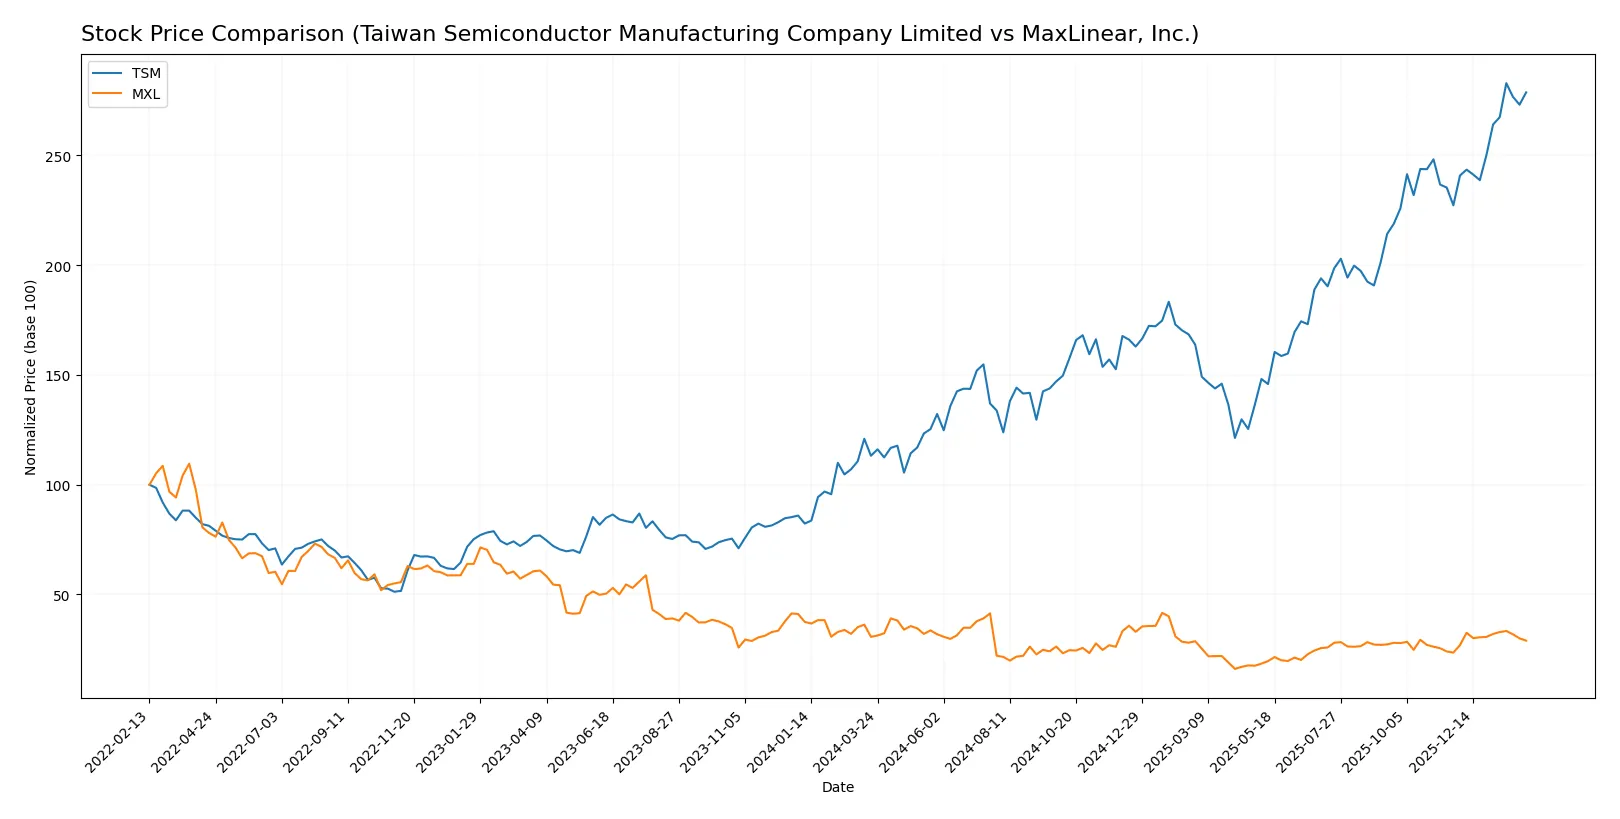
The past year shows stark contrasts: Taiwan Semiconductor surges with strong acceleration and wide price swings, while MaxLinear slides overall but gains modestly in recent months.
Trend Comparison
Taiwan Semiconductor’s stock jumped 146.27% over the past year, marking a bullish trend with accelerating gains and significant volatility. Its price ranged from 127.7 to 342.4, reflecting strong momentum.
MaxLinear’s stock declined 5.58% over the same period, defining a bearish trend despite recent 23.24% gains. Volatility remained low, and recent upward movement shows deceleration.
Taiwan Semiconductor outperformed MaxLinear significantly, delivering the highest market return with sustained acceleration and larger price swings.
Target Prices
Analysts present a moderate target consensus for both Taiwan Semiconductor Manufacturing Company Limited and MaxLinear, Inc.
| Company | Target Low | Target High | Consensus |
|---|---|---|---|
| Taiwan Semiconductor Manufacturing Company Limited | 330 | 450 | 397.5 |
| MaxLinear, Inc. | 15 | 25 | 21 |
The consensus target for TSM sits about 18% above its current price of 338, signaling upside potential. MXL’s target consensus at 21 indicates roughly 25% upside from its current 16.8 price, reflecting optimistic analyst expectations.

Don’t Let Luck Decide Your Entry Point
Optimize your entry points with our advanced ProRealTime indicators. You’ll get efficient buy signals with precise price targets for maximum performance. Start outperforming now!
How do institutions grade them?
Taiwan Semiconductor Manufacturing Company Limited Grades
The table below shows recent grades from reputable institutions for TSM:
| Grading Company | Action | New Grade | Date |
|---|---|---|---|
| TD Cowen | Maintain | Hold | 2026-01-16 |
| Barclays | Maintain | Overweight | 2026-01-16 |
| Needham | Maintain | Buy | 2026-01-15 |
| Bernstein | Maintain | Outperform | 2025-12-08 |
| Needham | Maintain | Buy | 2025-10-27 |
| Barclays | Maintain | Overweight | 2025-10-17 |
| Needham | Maintain | Buy | 2025-10-16 |
| Susquehanna | Maintain | Positive | 2025-10-10 |
| Barclays | Maintain | Overweight | 2025-10-09 |
| Barclays | Maintain | Overweight | 2025-09-16 |
MaxLinear, Inc. Grades
Below are recent institutional grades recorded for MXL:
| Grading Company | Action | New Grade | Date |
|---|---|---|---|
| Wells Fargo | Maintain | Equal Weight | 2026-01-30 |
| Benchmark | Maintain | Buy | 2026-01-16 |
| Benchmark | Maintain | Buy | 2025-10-24 |
| Benchmark | Maintain | Buy | 2025-10-17 |
| Benchmark | Maintain | Buy | 2025-09-02 |
| Loop Capital | Maintain | Hold | 2025-08-04 |
| Wells Fargo | Maintain | Equal Weight | 2025-07-24 |
| Benchmark | Maintain | Buy | 2025-07-24 |
| Susquehanna | Maintain | Neutral | 2025-07-24 |
| Susquehanna | Maintain | Neutral | 2025-07-22 |
Which company has the best grades?
TSM consistently receives higher grades such as Buy, Outperform, and Overweight. MXL shows mostly Buy and Equal Weight ratings. TSM’s stronger grades may signal greater institutional confidence, potentially influencing investor sentiment positively.
Risks specific to each company
In the complex 2026 market environment, the following categories reveal critical pressure points and systemic threats facing both Taiwan Semiconductor Manufacturing Company Limited (TSM) and MaxLinear, Inc. (MXL):
1. Market & Competition
Taiwan Semiconductor Manufacturing Company Limited
- Dominates advanced semiconductor manufacturing with a strong global footprint. Faces intense competition from other foundries like Samsung.
MaxLinear, Inc.
- Operates in niche RF and mixed-signal markets but faces fierce rivalry from larger, diversified semiconductor players.
2. Capital Structure & Debt
Taiwan Semiconductor Manufacturing Company Limited
- Maintains a conservative debt-to-equity ratio (0.18) and strong interest coverage, indicating low financial risk.
MaxLinear, Inc.
- Shows a higher leverage ratio (0.29) and negative interest coverage, signaling vulnerability from debt servicing pressures.
3. Stock Volatility
Taiwan Semiconductor Manufacturing Company Limited
- Beta of 1.27 suggests moderate sensitivity to market swings, typical for large-cap tech stocks.
MaxLinear, Inc.
- Beta of 1.71 reveals higher volatility and risk, reflecting smaller size and less market stability.
4. Regulatory & Legal
Taiwan Semiconductor Manufacturing Company Limited
- Exposed to geopolitical tensions affecting Taiwan and export restrictions on semiconductor tech.
MaxLinear, Inc.
- Faces regulatory scrutiny primarily in US markets, with less geopolitical risk but tighter domestic compliance demands.
5. Supply Chain & Operations
Taiwan Semiconductor Manufacturing Company Limited
- Complex global supply chain sensitive to geopolitical disruptions but benefits from scale and advanced process technology.
MaxLinear, Inc.
- Smaller scale supply chain, potentially more agile but vulnerable to component shortages and supplier concentration.
6. ESG & Climate Transition
Taiwan Semiconductor Manufacturing Company Limited
- Increasing investments in green manufacturing and energy efficiency align with global ESG trends.
MaxLinear, Inc.
- ESG initiatives less mature; risks from regulatory pressure on environmental standards may increase.
7. Geopolitical Exposure
Taiwan Semiconductor Manufacturing Company Limited
- High geopolitical risk due to Taiwan-China tensions, impacting investor sentiment and operational continuity.
MaxLinear, Inc.
- Primarily US-based with limited direct geopolitical risk but exposed to global supply chain impacts.
Which company shows a better risk-adjusted profile?
TSM’s dominant market position, superior capital structure, and robust financial health provide a safer risk-adjusted profile. MXL struggles with negative profitability, weaker debt coverage, and higher stock volatility. The biggest risk for TSM is geopolitical tension in Taiwan, while MXL’s critical risk lies in its financial instability and operational vulnerability. TSM’s Altman Z-Score of 15.7 and strong Piotroski score emphasize safety and financial strength, contrasting sharply with MXL’s distress-zone Z-Score of 2.1 and weak Piotroski score.
Final Verdict: Which stock to choose?
Taiwan Semiconductor Manufacturing Company Limited (TSM) wields unmatched operational efficiency and a durable competitive advantage, delivering consistent value creation with rising profitability. Its premium valuation and asset turnover require vigilance. TSM suits portfolios focused on stable, long-term growth anchored by a robust economic moat.
MaxLinear, Inc. (MXL) offers a niche strategic moat through specialized technology investments and aggressive R&D spending. However, it currently struggles with value destruction and volatile financials, reflecting higher risk. MXL may appeal to investors seeking speculative turnaround opportunities with a tolerance for instability.
If you prioritize durable competitive moats and consistent value creation, TSM outshines due to its superior profitability and financial strength. However, if you seek high-risk, potential-reward scenarios, MXL could offer opportunities despite its current challenges. Each fits distinct investor profiles demanding different risk appetites and time horizons.
Disclaimer: Investment carries a risk of loss of initial capital. The past performance is not a reliable indicator of future results. Be sure to understand risks before making an investment decision.
Go Further
I encourage you to read the complete analyses of Taiwan Semiconductor Manufacturing Company Limited and MaxLinear, Inc. to enhance your investment decisions: