Home > Comparison > Technology > STM vs MXL
The strategic rivalry between STMicroelectronics N.V. and MaxLinear, Inc. shapes the semiconductor industry’s evolution. STMicroelectronics operates as a diversified, capital-intensive semiconductor manufacturer serving automotive and industrial markets. MaxLinear focuses on high-performance analog and mixed-signal SoCs for communications infrastructure, emphasizing integration and niche applications. This analysis contrasts their business models to determine which offers superior risk-adjusted returns amid ongoing sector innovation and competitive pressures.
Table of contents
Companies Overview
STMicroelectronics N.V. and MaxLinear, Inc. stand as pivotal players in the semiconductor market, shaping technology infrastructure globally.
STMicroelectronics N.V.: Global Semiconductor Powerhouse
STMicroelectronics dominates with a broad semiconductor portfolio spanning automotive, industrial, and consumer electronics. Its core revenue derives from diverse segments including automotive ICs, analog and MEMS sensors, and microcontrollers. In 2026, the company emphasized innovation in integrated power transistors and secure microcontrollers to strengthen its competitive advantage across multiple markets.
MaxLinear, Inc.: Communications SoC Specialist
MaxLinear leads in high-performance analog and mixed-signal SoCs for connected home and infrastructure markets. Its revenue engine centers on integrated communication systems combining RF, digital processing, and power management. The 2026 focus sharpened on expanding broadband radio transceiver products and advanced 5G infrastructure solutions to capture growth in wireless and fiber networks, reinforcing its market position in communications.
Strategic Collision: Similarities & Divergences
Both firms operate in semiconductors but embrace distinct philosophies: STMicroelectronics delivers a diversified product range with a broad ecosystem approach, while MaxLinear targets niche communication SoC solutions with deep integration. Their primary battleground lies in the expanding wireless and automotive sectors. Investors face contrasting profiles: a large-scale diversified innovator versus a focused, high-growth communications specialist.
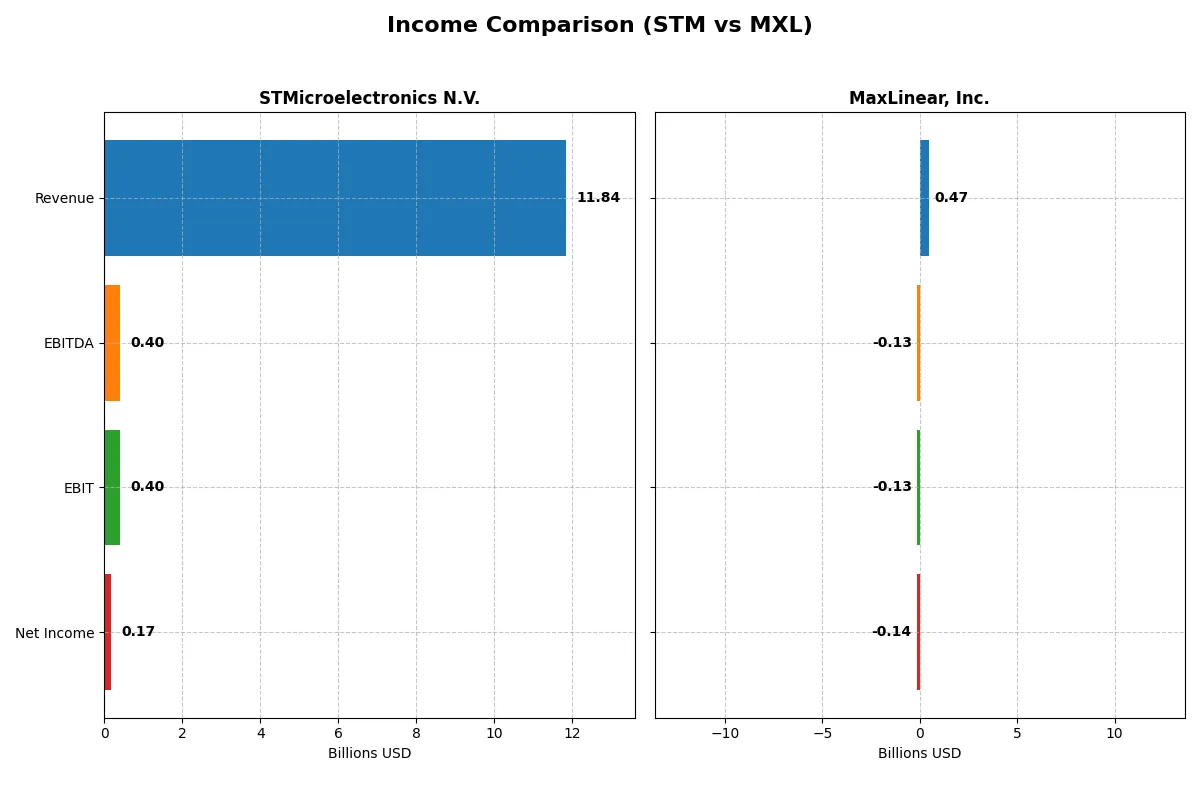
Income Statement Comparison
This data dissects the core profitability and scalability of both corporate engines to reveal who dominates the bottom line:
| Metric | STMicroelectronics N.V. (STM) | MaxLinear, Inc. (MXL) |
|---|---|---|
| Revenue | 11.8B | 468M |
| Cost of Revenue | 7.8B | 202M |
| Operating Expenses | 3.7B | 393M |
| Gross Profit | 4.0B | 266M |
| EBITDA | 401M | -131M |
| EBIT | 401M | -131M |
| Interest Expense | 0 | 10M |
| Net Income | 167M | -137M |
| EPS | 0.19 | -1.58 |
| Fiscal Year | 2025 | 2025 |
Income Statement Analysis: The Bottom-Line Duel
This income statement comparison exposes which company operates its business more efficiently and generates stronger profitability momentum.
STMicroelectronics N.V. Analysis
STMicroelectronics’ revenue declined from $17.3B in 2023 to $11.8B in 2025, dragging net income sharply down from $4.2B to $167M. Gross margin weakened but remained solid at 33.9% in 2025, while net margin collapsed to 1.4%, signaling margin compression amid falling sales. The latest year shows a steep earnings decline and eroding profitability momentum.
MaxLinear, Inc. Analysis
MaxLinear’s revenue rebounded to $468M in 2025 after a prior slump, growing 29.7% year-over-year. Despite a strong gross margin near 57%, the company posted a negative $137M net income and a net margin of -29.2%, reflecting heavy operating losses. However, the improving revenue and margin trends in 2025 indicate nascent operational recovery.
Margin Resilience vs. Recovery Challenge
STMicroelectronics dominates in scale and historical profitability but faces severe margin and income erosion recently. MaxLinear shows encouraging top-line growth and stable gross margins but struggles with consistent profitability. Investors seeking stability may prefer STM’s scale, while those focusing on turnaround potential might watch MXL’s improving momentum.
Financial Ratios Comparison
These vital ratios act as a diagnostic tool to expose the underlying fiscal health, valuation premiums, and capital efficiency of the companies compared below:
| Ratios | STMicroelectronics N.V. (STM) | MaxLinear, Inc. (MXL) |
|---|---|---|
| ROE | 8.92% | -47.49% |
| ROIC | 6.34% | -24.31% |
| P/E | 14.43 | -6.74 |
| P/B | 1.29 | 3.20 |
| Current Ratio | 3.11 | 1.77 |
| Quick Ratio | 2.37 | 1.28 |
| D/E | 0.18 | 0.29 |
| Debt-to-Assets | 12.80% | 17.23% |
| Interest Coverage | 19.72 | -15.52 |
| Asset Turnover | 0.54 | 0.42 |
| Fixed Asset Turnover | 1.22 | 4.65 |
| Payout ratio | 18.50% | 0 |
| Dividend yield | 1.28% | 0 |
| Fiscal Year | 2024 | 2024 |
Efficiency & Valuation Duel: The Vital Signs
Financial ratios serve as a company’s DNA, exposing hidden risks and operational strengths behind headline figures.
STMicroelectronics N.V.
STMicroelectronics shows weak profitability with a 0.93% ROE and a slim 1.41% net margin, signaling operational challenges. Its valuation metrics appear favorable but lack clarity due to zero reported P/E, suggesting possible earnings volatility. The firm maintains a strong current ratio of 3.36 but pays no dividends, instead focusing heavily on R&D (about 15.7% of revenue) to fuel growth.
MaxLinear, Inc.
MaxLinear suffers deep losses reflected in a negative 47.5% ROE and a severe -68% net margin, highlighting profitability struggles. Despite a seemingly attractive negative P/E, its 3.2 price-to-book ratio and unfavorable WACC at 11.46% paint a stretched valuation. The company lacks dividends, directing significant capital (over 62% of revenue) toward R&D, aiming for long-term turnaround.
Profitability Struggles vs. Growth Ambitions
STMicroelectronics delivers a more stable, albeit low, profitability profile with prudent capital structure and solid liquidity. MaxLinear’s metrics reveal heavier losses and higher risk, offset by aggressive R&D investment. Investors seeking operational resilience may prefer STMicroelectronics, while those favoring speculative growth might consider MaxLinear’s bold reinvestment strategy.
Which one offers the Superior Shareholder Reward?
STMicroelectronics (STM) delivers a more balanced and sustainable shareholder reward than MaxLinear (MXL). STM pays a modest dividend yield of 1.28% with a conservative 18% payout ratio, covering dividends reliably from free cash flow. STM also maintains consistent buybacks, enhancing total returns. Conversely, MXL pays no dividend and reports negative margins, relying on reinvestment amid operating losses. Its buyback activity is negligible, raising concerns about capital allocation effectiveness. Historically, STM’s prudent distribution coupled with solid cash flow underpins a superior total return profile in 2026. I favor STM for investors seeking disciplined yield and capital appreciation.
Comparative Score Analysis: The Strategic Profile
The radar chart reveals the fundamental DNA and trade-offs of STMicroelectronics and MaxLinear, highlighting their financial strengths and valuation contrasts:
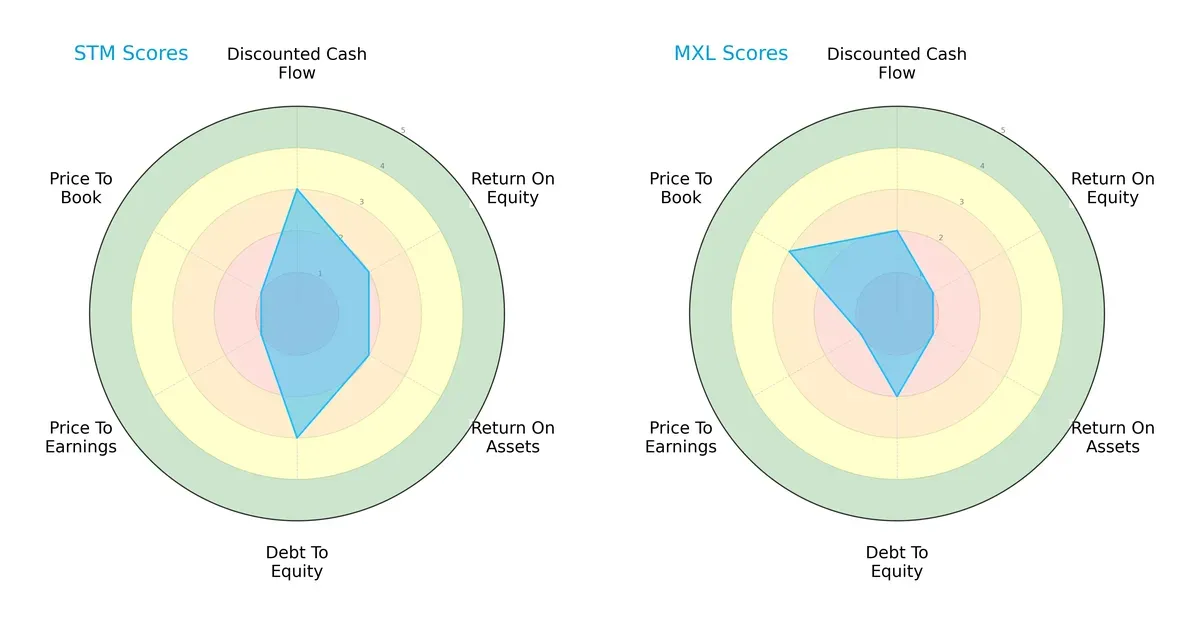
STMicroelectronics (STM) shows a balanced profile with moderate scores in DCF (3), ROE (2), ROA (2), and Debt/Equity (3), but suffers from very unfavorable valuation metrics (P/E and P/B scores of 1). MaxLinear (MXL) leans on a better Price-to-Book score (3) but lags behind in profitability (ROE 1, ROA 1) and DCF (2). STM’s profile is broader, while MXL relies on valuation appeal amid weaker operational metrics.
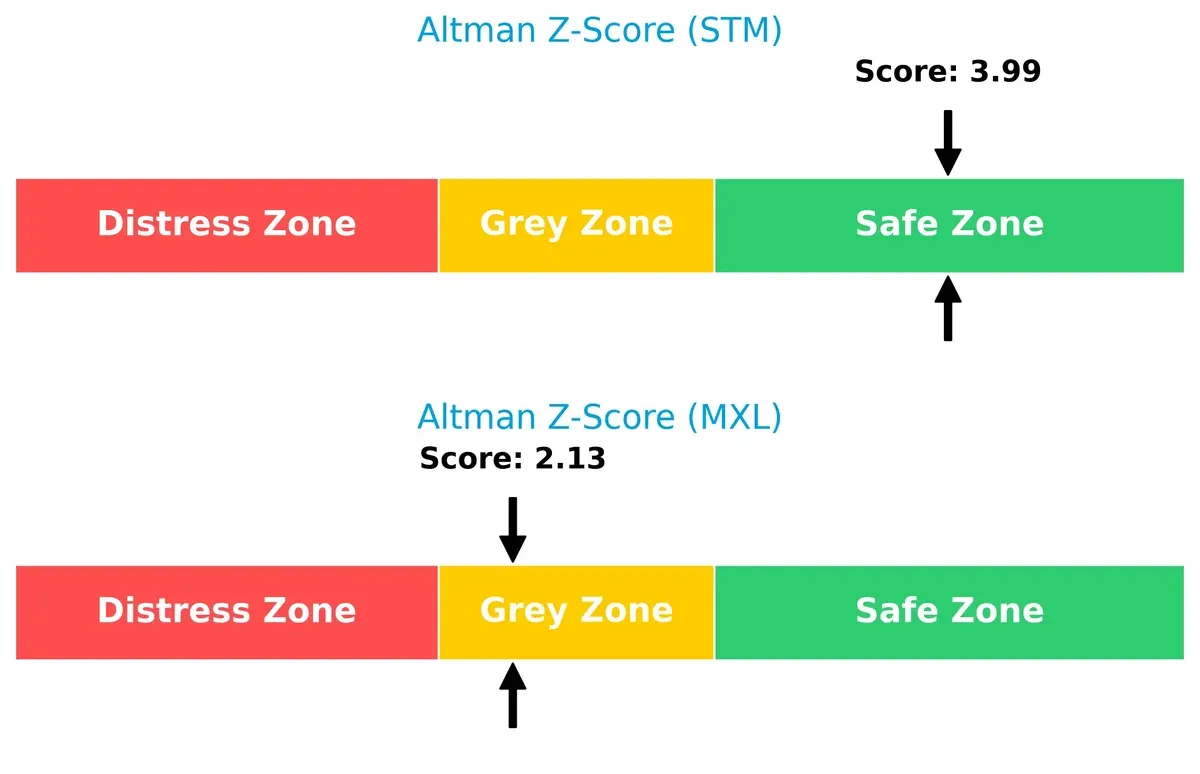
Bankruptcy Risk: Solvency Showdown
STM’s Altman Z-Score at 3.99 places it safely above distress, reflecting robust long-term solvency. MXL’s 2.13 score flags moderate bankruptcy risk in this cycle’s volatility:
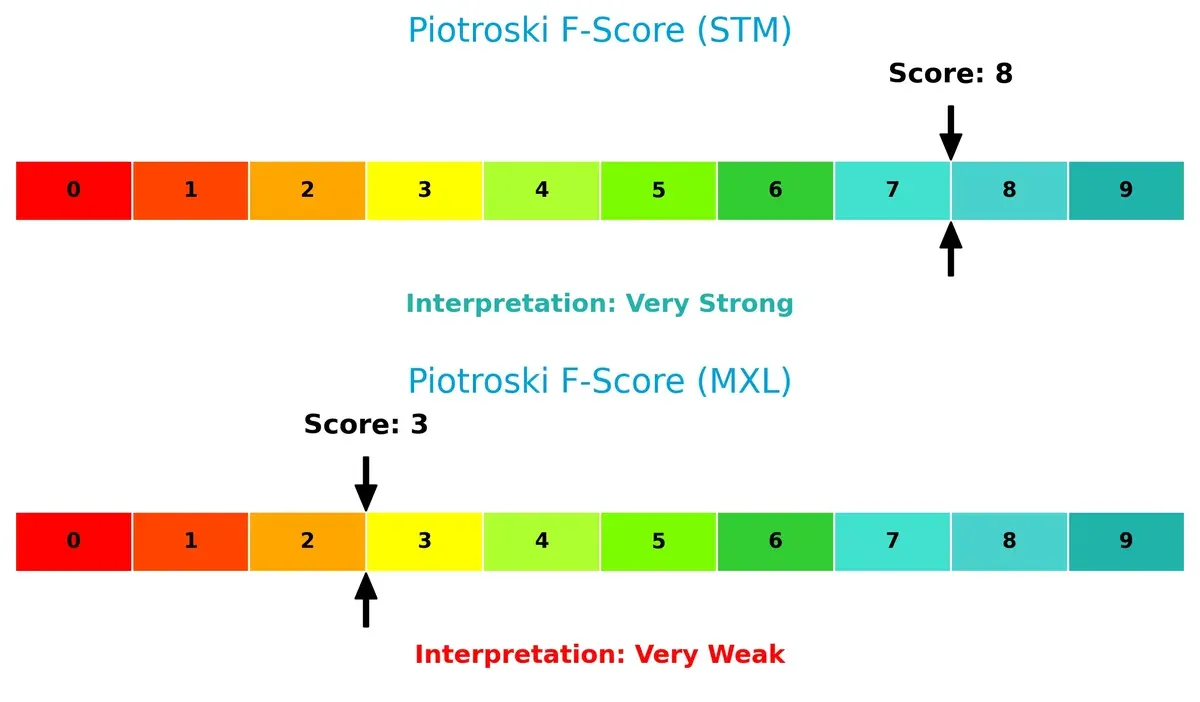
Financial Health: Quality of Operations
STM scores 8 on the Piotroski F-Score, signaling very strong financial health and operational quality. MXL’s 3 marks red flags, indicating weak internal metrics and potential financial distress:
How are the two companies positioned?
This section dissects STM and MXL’s operational DNA by comparing revenue distribution and internal dynamics—strengths and weaknesses. The goal is to confront their economic moats and identify the more resilient and sustainable competitive advantage.
Revenue Segmentation: The Strategic Mix
This visual comparison dissects how STMicroelectronics N.V. and MaxLinear, Inc. diversify their income streams and where their primary sector bets lie:
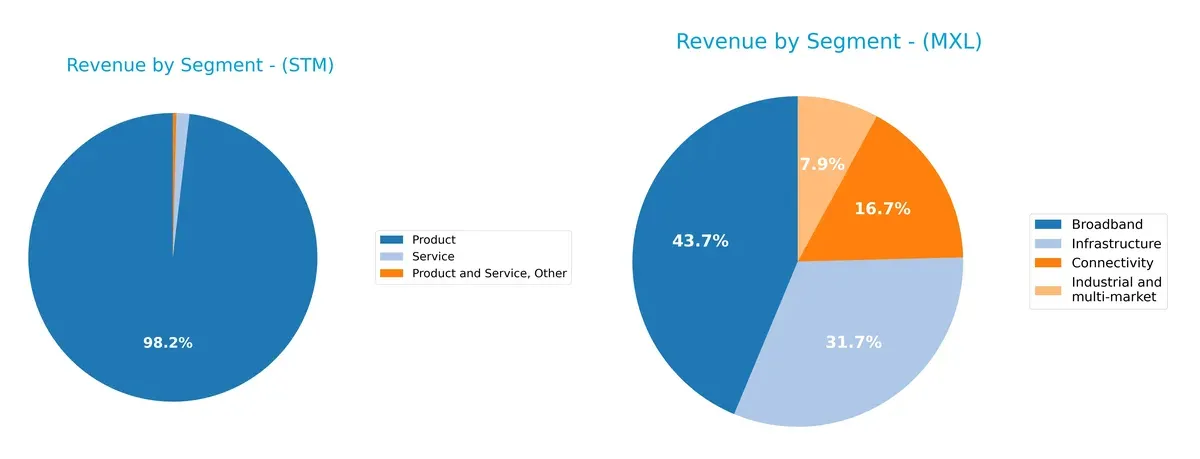
STMicroelectronics anchors its revenue around a dominant product segment, generating $13.2B in 2024, while services and others contribute marginally. MaxLinear shows a more diversified mix across Broadband ($204M), Connectivity ($78M), Industrial and multi-market ($37M), and Infrastructure ($148M). STM’s concentration suggests infrastructure dominance with potential concentration risk. MXL’s balanced portfolio pivots on ecosystem lock-in, reducing vulnerability to single-sector downturns.
Strengths and Weaknesses Comparison
This table compares the Strengths and Weaknesses of STMicroelectronics N.V. (STM) and MaxLinear, Inc. (MXL):
STM Strengths
- High product revenue at $13.2B in 2024
- Diverse geographic revenue with strong Asia Pacific and US presence
- Favorable quick ratio and low debt-to-assets ratio
- Favorable PE and PB ratios indicating valuation appeal
MXL Strengths
- Favorable current and quick ratios reflecting liquidity
- Favorable debt-to-assets ratio supports financial stability
- High fixed asset turnover at 4.65 indicates efficient asset use
- Diverse product segments including Broadband and Infrastructure
STM Weaknesses
- Unfavorable net margin (1.41%) and ROE (0.93%)
- Low ROIC (0.67%) below WACC (9.52%) signals weak capital returns
- Unfavorable asset turnover at 0.48
- No dividend yield limits income appeal
MXL Weaknesses
- Negative net margin (-68.01%) and ROE (-47.49%) indicate losses
- Negative ROIC (-24.31%) and unfavorable WACC (11.46%) warn of poor returns
- Negative interest coverage suggests financial distress
- PB ratio of 3.2 may indicate overvaluation
STM’s strengths lie in significant product revenue and strong global footprint, balancing liquidity and leverage well. However, low profitability metrics and weak asset utilization raise concerns about operational efficiency. MXL shows liquidity and asset efficiency strengths but suffers from severe profitability and financial health issues, highlighting risks in its capital structure and earnings. Both companies face distinct challenges that impact their strategic positioning in competitive markets.
The Moat Duel: Analyzing Competitive Defensibility
A structural moat is the only reliable shield preserving long-term profits from relentless competitive erosion. Let’s dissect how each firm defends its turf:
STMicroelectronics N.V.: Diversified Industrial Moat
STM’s moat roots in broad product diversification and industrial scale. Its stable gross margin near 34% reflects solid cost control despite profit declines. New automotive and sensor markets could deepen its moat if innovation accelerates.
MaxLinear, Inc.: Niche Technology Moat
MXL leverages specialized RF and mixed-signal SoCs, carving a niche unlike STM’s broad scope. Its premium gross margin near 57% underscores pricing power. Rapid revenue growth in 2025 signals potential moat expansion in 5G and data infrastructure.
Verdict: Diversification vs. Specialization in Semiconductor Moats
STM’s wide industrial moat is currently challenged by declining returns. MXL’s narrower niche moat shows stronger margin resilience and growth momentum. I see MXL better positioned to protect and expand its market foothold amid evolving tech demands.
Which stock offers better returns?
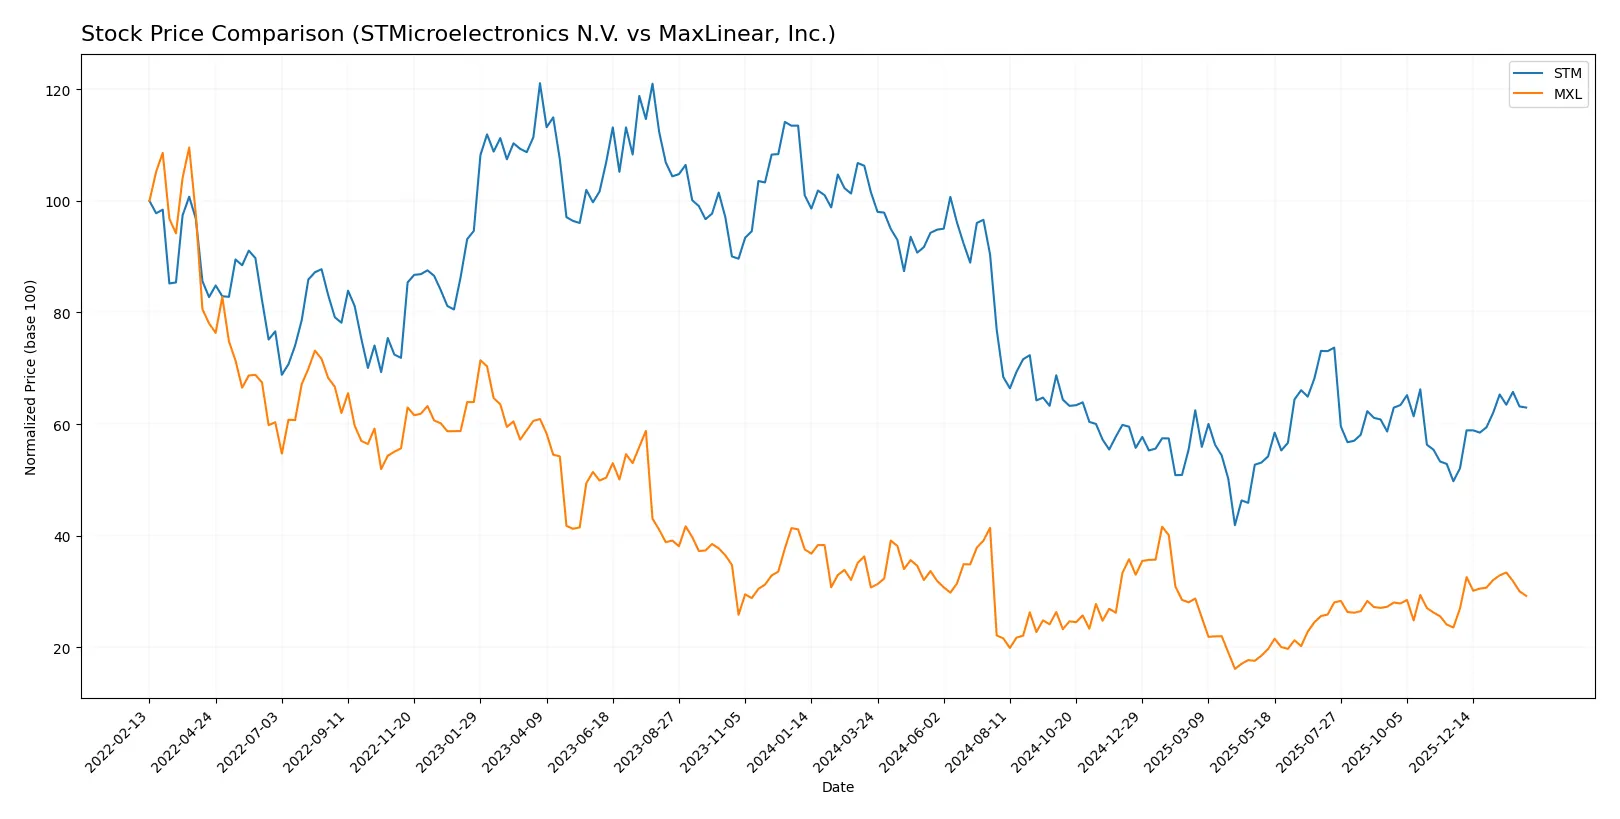
The past year showed contrasting dynamics between STMicroelectronics N.V. and MaxLinear, Inc., with both experiencing significant price shifts and evolving trading volumes.
Trend Comparison
STMicroelectronics N.V. declined 38.0% over 12 months, marking a bearish trend with accelerating losses and high volatility (6.54 std dev). It reached a low of 18.49 and a high of 44.85.
MaxLinear, Inc. fell 4.91% over the same period, also bearish but less severe. Volatility (3.34 std dev) was moderate, with accelerating downward momentum and prices between 9.31 and 24.05.
STMicroelectronics showed a sharper decline than MaxLinear, despite both trending bearish. MaxLinear delivered the relatively better market performance over the last year.
Target Prices
Analysts provide optimistic target price ranges for both STMicroelectronics and MaxLinear, signaling growth potential.
| Company | Target Low | Target High | Consensus |
|---|---|---|---|
| STMicroelectronics N.V. | 28 | 45 | 37.67 |
| MaxLinear, Inc. | 15 | 25 | 21 |
The consensus target for STMicroelectronics stands 36% above its current price of $27.77, reflecting strong upside potential. MaxLinear’s target consensus at $21 sits 24% above its $16.89 market price, indicating moderate analyst confidence.

Don’t Let Luck Decide Your Entry Point
Optimize your entry points with our advanced ProRealTime indicators. You’ll get efficient buy signals with precise price targets for maximum performance. Start outperforming now!
How do institutions grade them?
STMicroelectronics N.V. Grades
The following table summarizes recent grades issued by reputable analysts for STMicroelectronics N.V.:
| Grading Company | Action | New Grade | Date |
|---|---|---|---|
| TD Cowen | Maintain | Buy | 2025-10-24 |
| Susquehanna | Maintain | Positive | 2025-10-22 |
| Susquehanna | Maintain | Positive | 2025-07-25 |
| Baird | Upgrade | Outperform | 2025-07-22 |
| Susquehanna | Maintain | Positive | 2025-07-22 |
| Jefferies | Upgrade | Buy | 2025-02-19 |
| Bernstein | Downgrade | Market Perform | 2025-02-05 |
| Susquehanna | Maintain | Positive | 2025-01-31 |
| Barclays | Downgrade | Underweight | 2025-01-22 |
| JP Morgan | Downgrade | Neutral | 2024-12-09 |
MaxLinear, Inc. Grades
Below is a summary of recent analyst grades for MaxLinear, Inc. from credible sources:
| Grading Company | Action | New Grade | Date |
|---|---|---|---|
| Wells Fargo | Maintain | Equal Weight | 2026-01-30 |
| Benchmark | Maintain | Buy | 2026-01-16 |
| Benchmark | Maintain | Buy | 2025-10-24 |
| Benchmark | Maintain | Buy | 2025-10-17 |
| Benchmark | Maintain | Buy | 2025-09-02 |
| Loop Capital | Maintain | Hold | 2025-08-04 |
| Wells Fargo | Maintain | Equal Weight | 2025-07-24 |
| Benchmark | Maintain | Buy | 2025-07-24 |
| Susquehanna | Maintain | Neutral | 2025-07-24 |
| Susquehanna | Maintain | Neutral | 2025-07-22 |
Which company has the best grades?
STMicroelectronics shows stronger momentum with multiple upgrades and positive ratings, including “Buy” and “Outperform.” MaxLinear holds consistent “Buy” and “Equal Weight” ratings but lacks recent upgrades. Investors may view STMicroelectronics as having more favorable analyst sentiment.
Risks specific to each company
The following categories identify the critical pressure points and systemic threats facing both firms in the 2026 market environment:
1. Market & Competition
STMicroelectronics N.V.
- Large market cap supports scale advantages but faces intense global semiconductor competition.
MaxLinear, Inc.
- Smaller player with niche SoC products vulnerable to rapid technology shifts and dominant competitors.
2. Capital Structure & Debt
STMicroelectronics N.V.
- Low debt-to-equity ratio (0.12) indicates prudent leverage and solid financial stability.
MaxLinear, Inc.
- Higher debt-to-equity (0.29) increases financial risk, compounded by negative interest coverage.
3. Stock Volatility
STMicroelectronics N.V.
- Beta of 1.32 shows moderate market sensitivity, typical for semiconductor industry leaders.
MaxLinear, Inc.
- Beta of 1.71 signals elevated volatility, reflecting higher risk in a smaller market cap stock.
4. Regulatory & Legal
STMicroelectronics N.V.
- Operates globally with exposure to EU and US regulatory regimes; geopolitical tensions could impact compliance costs.
MaxLinear, Inc.
- US-based but reliant on international supply chains; regulatory shifts in tech and communications may increase scrutiny.
5. Supply Chain & Operations
STMicroelectronics N.V.
- Large, diversified manufacturing footprint mitigates supply disruptions but complexity is a risk.
MaxLinear, Inc.
- Smaller scale and focused product lines increase vulnerability to supplier or component shortages.
6. ESG & Climate Transition
STMicroelectronics N.V.
- European base likely enforces stronger ESG compliance; sustainability investments may increase costs short term.
MaxLinear, Inc.
- US firm with less regulatory pressure on ESG; may lag in climate transition efforts affecting investor appeal.
7. Geopolitical Exposure
STMicroelectronics N.V.
- Global presence includes risk from EU-US-China trade tensions and supply chain nationalism.
MaxLinear, Inc.
- Primarily US-focused but dependent on global customers and suppliers, exposing it to trade policy risks.
Which company shows a better risk-adjusted profile?
STMicroelectronics faces its biggest risk in global market competition and geopolitical supply chain pressures. MaxLinear’s most critical risk is its weak profitability and financial distress signals. STM’s strong Altman Z-Score (3.99, safe zone) and Piotroski Score (8, very strong) contrast with MXL’s borderline Z-Score (2.13, grey zone) and weak Piotroski (3). STM offers a better risk-adjusted profile, justified by superior financial stability and lower leverage despite industry headwinds.
Final Verdict: Which stock to choose?
STMicroelectronics N.V. (STM) shines with its unmatched operational resilience and strong liquidity cushion. Its superpower lies in navigating challenging cycles with ample working capital and a very strong Piotroski score. However, its declining profitability and return on invested capital pose a point of vigilance. STM suits portfolios aiming for steady, long-term recovery potential.
MaxLinear, Inc. (MXL) offers a strategic moat in its focused R&D intensity, fueling growth opportunities in niche markets. It commands a more speculative profile given its ongoing value destruction and weaker financial stability compared to STM. MXL fits investors who pursue growth at a reasonable price with tolerance for elevated risk and volatility.
If you prioritize capital preservation and operational strength, STM is the compelling choice due to its solid balance sheet and liquidity advantage. However, if you seek aggressive growth fueled by innovation, MXL offers superior upside potential despite its financial headwinds. Both stocks require close monitoring of profitability trends and capital efficiency to gauge investment viability.
Disclaimer: Investment carries a risk of loss of initial capital. The past performance is not a reliable indicator of future results. Be sure to understand risks before making an investment decision.
Go Further
I encourage you to read the complete analyses of STMicroelectronics N.V. and MaxLinear, Inc. to enhance your investment decisions: