Home > Comparison > Technology > SWKS vs MXL
The strategic rivalry between Skyworks Solutions, Inc. and MaxLinear, Inc. defines the current trajectory of the semiconductor sector. Skyworks operates as a diversified semiconductor powerhouse with a broad product portfolio across multiple end markets. In contrast, MaxLinear focuses on high-performance analog and mixed-signal SoCs targeting communications infrastructure. This analysis will determine which operational model offers the superior risk-adjusted return for a technology-focused, diversified portfolio.

Table of contents
Companies Overview
Skyworks Solutions and MaxLinear both hold critical positions in the semiconductor industry, shaping communication technology globally.
Skyworks Solutions, Inc.: Semiconductor Innovator Powering Connectivity
Skyworks Solutions dominates as a semiconductor designer and manufacturer specializing in proprietary products like amplifiers and front-end modules. Its revenue stems from supplying diverse sectors, including aerospace, automotive, and smartphones. In 2026, Skyworks focuses on expanding its product portfolio and maintaining technological leadership in wireless analog system chips.
MaxLinear, Inc.: Integrated SoC Solutions for Modern Networks
MaxLinear leads in radiofrequency and mixed-signal system-on-chip (SoC) solutions targeting connected homes and infrastructure. It generates revenue by integrating RF, analog, and digital signal processing in broadband modems, routers, and 4G/5G base stations. In 2026, MaxLinear emphasizes high integration and end-to-end platform design to address evolving communication demands.
Strategic Collision: Similarities & Divergences
Skyworks and MaxLinear both pursue innovation in semiconductors but diverge in approach. Skyworks relies on a broad product portfolio across multiple markets, favoring a diversified ecosystem. MaxLinear targets highly integrated SoC platforms, adopting a focused, modular strategy. Their primary battleground lies in wireless infrastructure components. Investors face contrasting risk profiles: Skyworks with scale and diversification, MaxLinear with niche specialization and growth potential.
Income Statement Comparison
The following data dissects the core profitability and scalability of both corporate engines to reveal who dominates the bottom line:
| Metric | Skyworks Solutions, Inc. (SWKS) | MaxLinear, Inc. (MXL) |
|---|---|---|
| Revenue | 4.09B | 468M |
| Cost of Revenue | 2.40B | 202M |
| Operating Expenses | 1.18B | 393M |
| Gross Profit | 1.68B | 266M |
| EBITDA | 1.02B | -131M |
| EBIT | 554M | -131M |
| Interest Expense | 27M | 10M |
| Net Income | 477M | -137M |
| EPS | 3.09 | -1.58 |
| Fiscal Year | 2025 | 2025 |
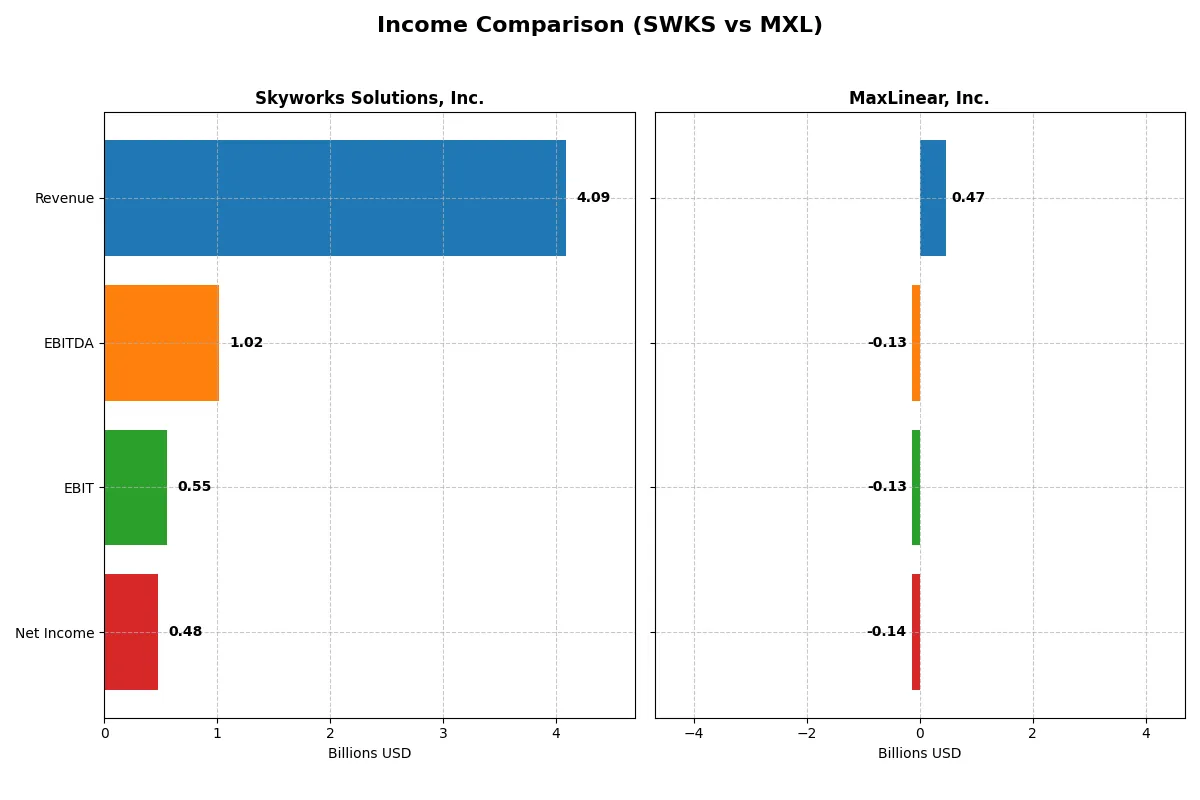
Income Statement Analysis: The Bottom-Line Duel
This income statement comparison reveals how efficiently each company converts sales into profit and manages costs under market pressures.
Skyworks Solutions, Inc. Analysis
Skyworks’ revenue declined 2.2% to $4.09B in 2025, with net income falling 20% to $477M. Despite the top-line softness, it maintains a solid gross margin of 41.2% and a net margin near 11.7%. The drop in EBIT and EPS signals margin compression and waning profitability momentum in the latest fiscal year.
MaxLinear, Inc. Analysis
MaxLinear posted a 30% revenue increase to $468M in 2025, rebounding from prior declines. However, it remains unprofitable with a negative net margin of -29.2% and EBIT loss at -28%. The strong gross margin of 56.8% contrasts with heavy operating expenses, though recent margin improvement indicates early signs of operational leverage.
Margin Stability vs. Growth Potential
Skyworks leads in profitability with favorable margins and positive net income, though its recent decline questions sustainability. MaxLinear shows promising revenue growth and improving margins but still incurs large losses. Skyworks appeals to those valuing margin stability; MaxLinear fits investors focused on turnaround potential despite current risk.
Financial Ratios Comparison
These vital ratios act as a diagnostic tool to expose the underlying fiscal health, valuation premiums, and capital efficiency of the companies compared below:
| Ratios | Skyworks Solutions, Inc. (SWKS) | MaxLinear, Inc. (MXL) |
|---|---|---|
| ROE | 8.3% | -47.5% |
| ROIC | 6.4% | -24.3% |
| P/E | 25.0 | -6.7 |
| P/B | 2.1 | 3.2 |
| Current Ratio | 2.33 | 1.77 |
| Quick Ratio | 1.76 | 1.28 |
| D/E | 0.21 | 0.29 |
| Debt-to-Assets | 15.2% | 17.2% |
| Interest Coverage | 18.5x | -15.5x |
| Asset Turnover | 0.52 | 0.42 |
| Fixed Asset Turnover | 2.95 | 4.65 |
| Payout ratio | 90.7% | 0% |
| Dividend yield | 3.63% | 0% |
| Fiscal Year | 2025 | 2024 |
Efficiency & Valuation Duel: The Vital Signs
Financial ratios serve as a company’s DNA, exposing hidden risks and operational strengths that dictate investment potential.
Skyworks Solutions, Inc.
Skyworks delivers moderate profitability with an 8.29% ROE and an 11.67% net margin, signaling operational efficiency. Its P/E of 24.95 and P/B of 2.07 suggest a fairly valued stock, not stretched by market hype. The firm returns value through a 3.63% dividend yield, balancing shareholder income with steady reinvestment in R&D.
MaxLinear, Inc.
MaxLinear struggles with severe profitability challenges, posting a -47.49% ROE and a -68.01% net margin, reflecting operational distress. Despite a favorable negative P/E, its P/B at 3.2 and negative cash flow metrics indicate valuation risks. The absence of dividends highlights reliance on heavy R&D spending to drive future growth, a high-risk strategy in current conditions.
Robust Profitability vs. High-Risk Turnaround
Skyworks offers a stronger balance of risk and reward, combining decent profitability with disciplined valuation and steady dividends. MaxLinear’s metrics reveal significant operational weaknesses and valuation concerns, fitting investors willing to embrace high risk for potential turnaround gains.
Which one offers the Superior Shareholder Reward?
I observe Skyworks Solutions, Inc. (SWKS) pays a healthy 3.63% dividend yield with a 91% payout ratio, supported by strong free cash flow of 7.16/share. MaxLinear, Inc. (MXL) pays no dividends, reflecting reinvestment in growth amid negative margins. SWKS’s buybacks reduce share count steadily, enhancing total returns. MXL’s buyback activity is minimal due to cash flow constraints. I find SWKS’s distribution model more sustainable and shareholder-friendly in 2026. Skyworks offers a superior total return profile, balancing income and capital appreciation with prudent capital allocation.
Comparative Score Analysis: The Strategic Profile
The radar chart reveals the fundamental DNA and trade-offs of both firms, highlighting their core strengths and strategic balance:
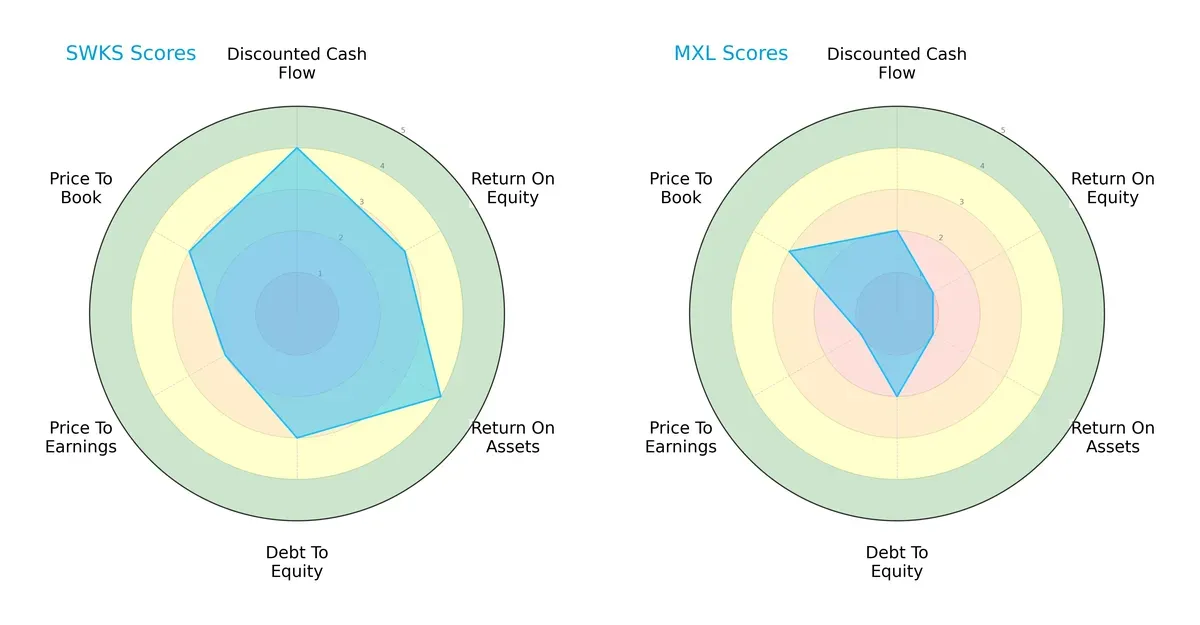
Skyworks Solutions, Inc. (SWKS) displays a more balanced profile with favorable DCF and ROA scores, moderate ROE and debt-to-equity, and reasonable valuation metrics. MaxLinear, Inc. (MXL) relies heavily on a specific edge in price-to-book but falls behind in profitability and cash flow metrics. SWKS demonstrates a stronger all-around financial footing.
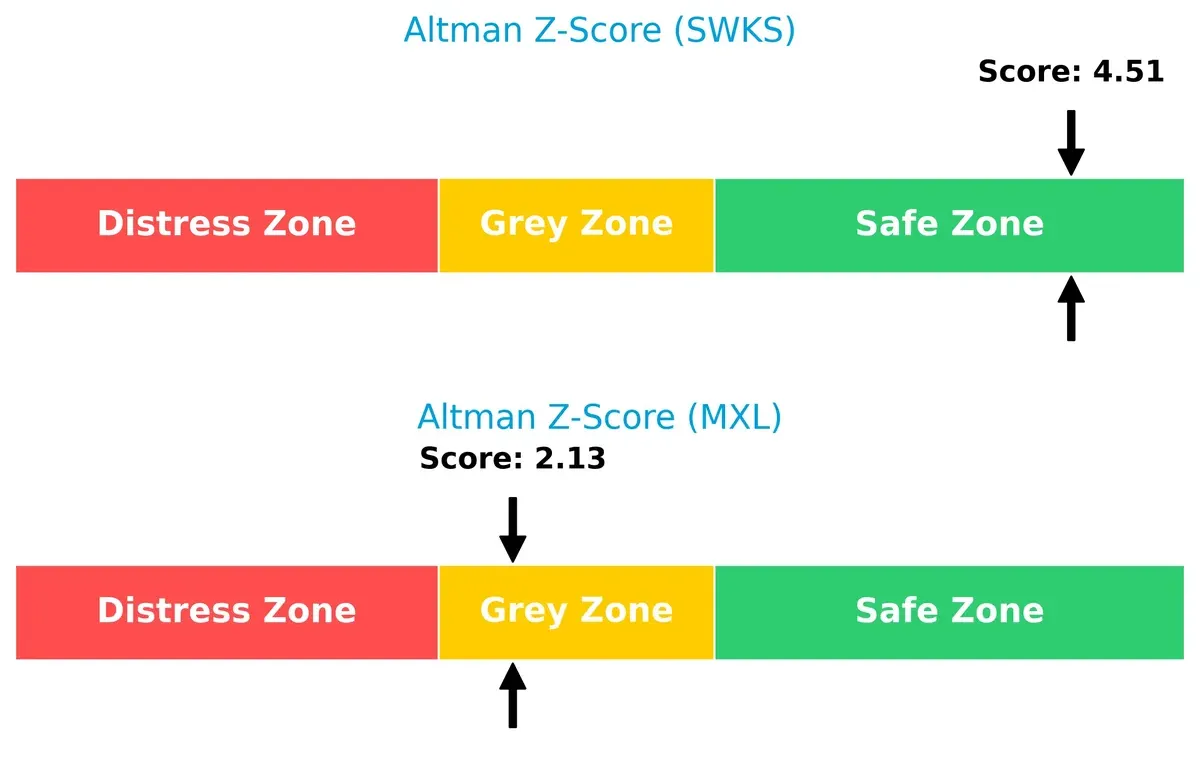
Bankruptcy Risk: Solvency Showdown
Skyworks’ Altman Z-Score of 4.51 signals a robust safety zone, while MaxLinear’s 2.13 places it in a grey zone. This gap indicates SWKS’s superior long-term survival odds:
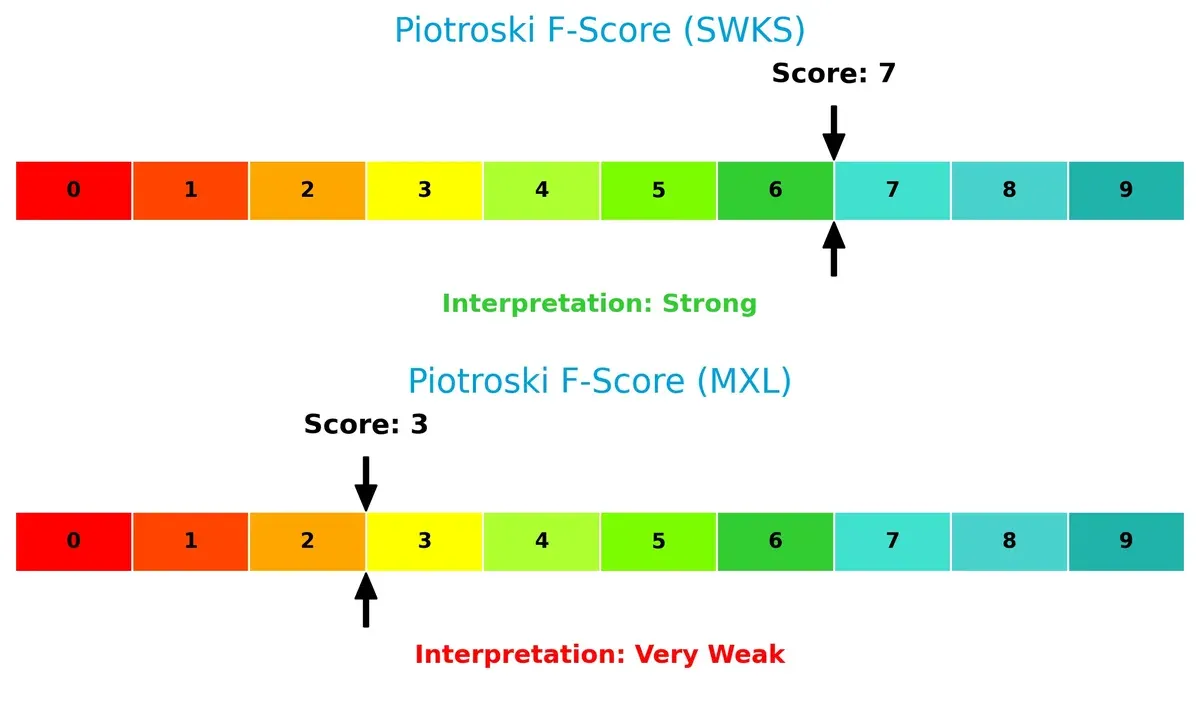
Financial Health: Quality of Operations
Skyworks scores a strong 7 on the Piotroski scale, reflecting solid financial health. MaxLinear’s 3 signals red flags, highlighting weaker operational quality and financial risks:
How are the two companies positioned?
This section dissects the operational DNA of Skyworks Solutions and MaxLinear by comparing their revenue distribution and internal dynamics. The goal is to confront their economic moats and identify which model offers the most resilient competitive advantage today.
Revenue Segmentation: The Strategic Mix
This visual comparison dissects how Skyworks Solutions and MaxLinear diversify their income streams and where their primary sector bets lie:
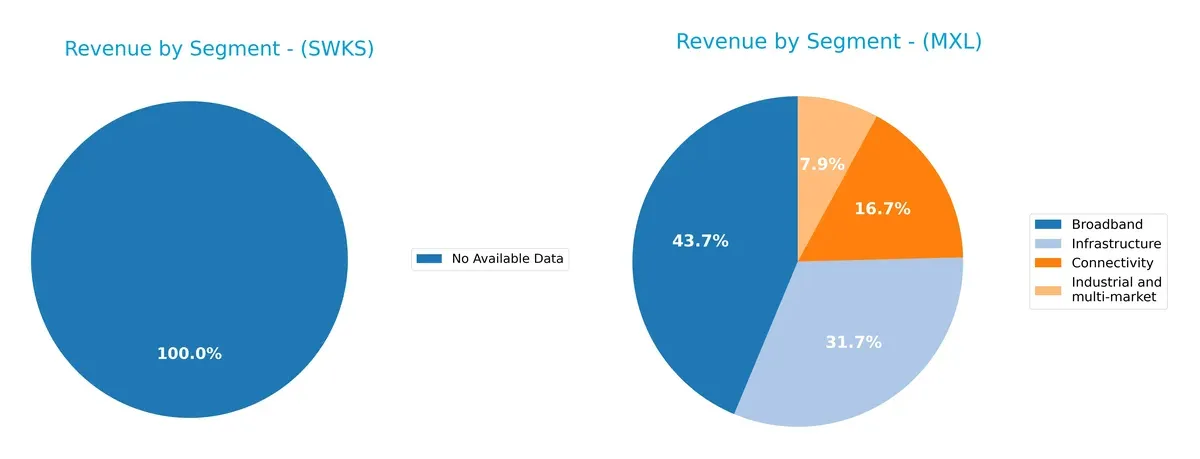
Skyworks Solutions lacks available segmentation data, limiting direct comparison. MaxLinear pivots on Broadband, which dwarfs other segments at $204M in 2025. Infrastructure and Connectivity contribute sizable but smaller shares, showing moderate diversification. This mix suggests MaxLinear leans on broadband’s infrastructure dominance while managing concentration risk through industrial and connectivity sectors. Without Skyworks’ breakdown, MaxLinear’s focused yet diversified profile stands clear.
Strengths and Weaknesses Comparison
This table compares the strengths and weaknesses of Skyworks Solutions, Inc. and MaxLinear, Inc.:
Skyworks Solutions Strengths
- Strong profitability with 11.67% net margin
- Solid liquidity ratios: current 2.33, quick 1.76
- Low debt levels: debt/assets 15.2%
- Attractive dividend yield of 3.63%
- Significant US and Asian market presence
MaxLinear Strengths
- Diversified product segments with broadband and infrastructure revenues
- Favorable current and quick ratios: 1.77 and 1.28
- Controlled leverage: debt/assets 17.23%
- High fixed asset turnover of 4.65 indicates efficiency
Skyworks Solutions Weaknesses
- Return on equity at 8.29% is unfavorable relative to sector norms
- ROIC (6.35%) below WACC (9.25%) signals weak capital returns
- Neutral asset turnover of 0.52 limits operational efficiency
MaxLinear Weaknesses
- Deeply negative profitability: -68.01% net margin, -47.49% ROE, -24.31% ROIC
- Negative interest coverage (-13.01) indicates financial distress
- Unfavorable asset turnover at 0.42
- No dividend yield and high price/book ratio (3.2)
Overall, Skyworks shows solid financial health and income generation but needs to improve returns. MaxLinear faces significant profitability and efficiency challenges despite operational diversification. These factors should shape their strategic focus on capital efficiency and market positioning.
The Moat Duel: Analyzing Competitive Defensibility
A structural moat is the sole barrier protecting long-term profits from relentless competition and market erosion:
Skyworks Solutions, Inc.: Intangible Assets Powerhouse
I see Skyworks relying on proprietary semiconductor designs and intellectual property. This moat shows in its historically stable margins around 41%. Yet, declining revenue signals pressure on this advantage in 2026.
MaxLinear, Inc.: Integration and Innovation Edge
MaxLinear leverages high-performance mixed-signal SoCs differing from Skyworks’ IP focus. Despite recent revenue growth, its negative margins and steep ROIC decline expose fragility. Expansion into 5G infrastructure could deepen competitive leverage.
Verdict: Proprietary IP vs. System Integration Strength
Both firms face deteriorating ROIC and value destruction, but Skyworks’ intangible assets yield steadier margins. I judge Skyworks holds the deeper moat, better suited to defend market share amid semiconductor sector volatility.
Which stock offers better returns?
The past year shows contrasting stock price movements for Skyworks Solutions and MaxLinear, with notable declines and emerging recoveries shaping their trading dynamics.
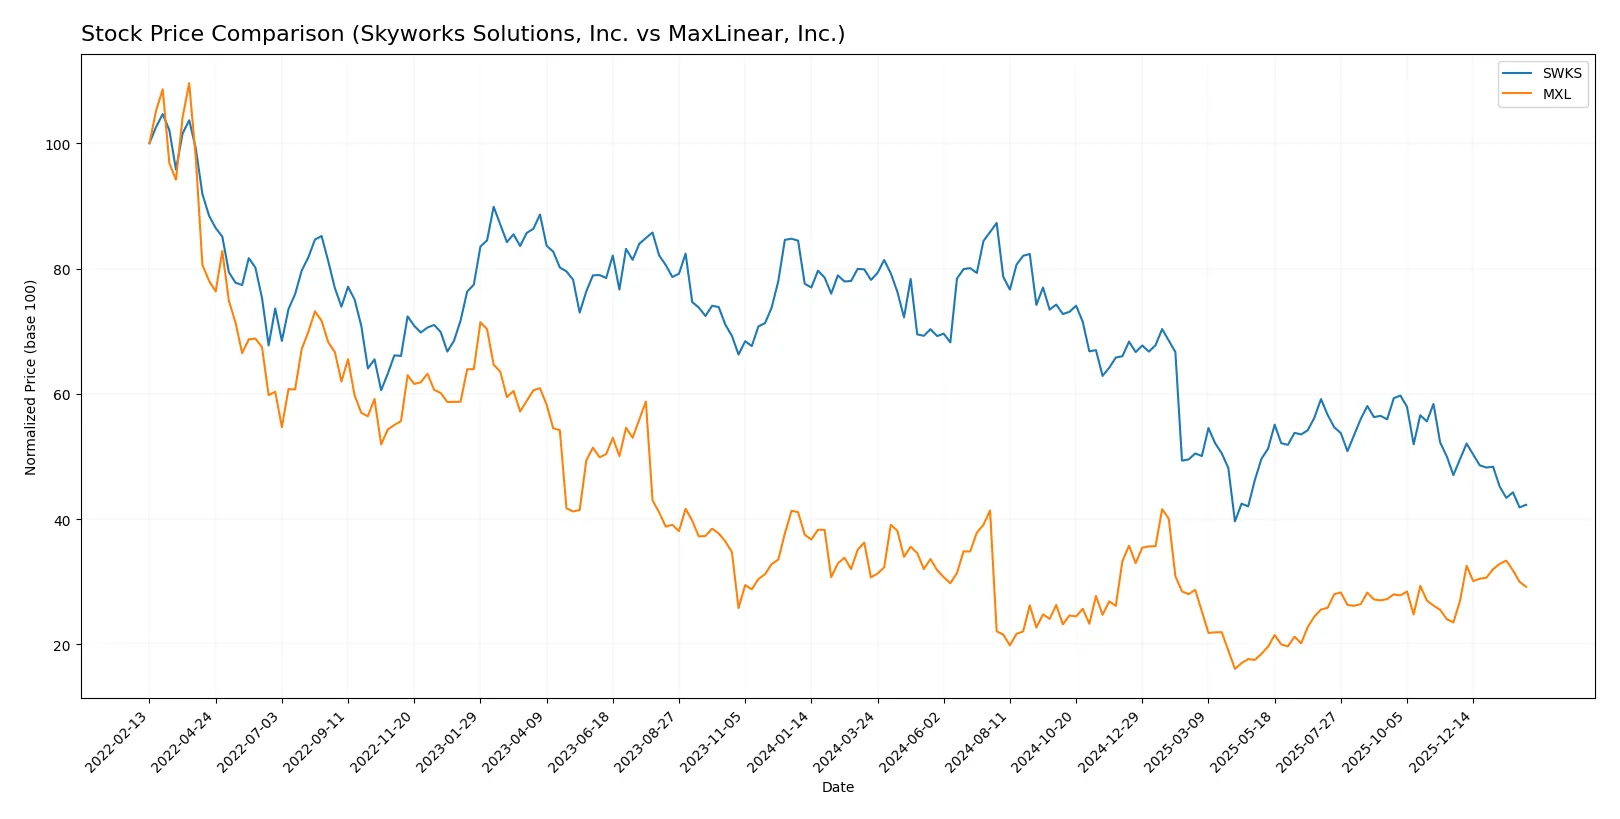
Trend Comparison
Skyworks Solutions (SWKS) experienced a bearish trend over the past 12 months, with a sharp 45.9% price drop and decelerating declines, hitting a low of 52.78 from a high of 116.18.
MaxLinear (MXL) also faced a bearish trend overall, down 4.91%, but showed recent acceleration with a 24.11% gain since late November 2025, reflecting a turnaround from its 9.31 low.
MaxLinear’s stock outperformed Skyworks over the period, delivering a smaller overall loss and a significant recent price rebound.
Target Prices
Analysts present a mixed but optimistic consensus on price targets for Skyworks Solutions and MaxLinear.
| Company | Target Low | Target High | Consensus |
|---|---|---|---|
| Skyworks Solutions, Inc. | 60 | 140 | 78.8 |
| MaxLinear, Inc. | 15 | 25 | 21 |
Skyworks’ consensus target of 78.8 suggests significant upside from the current 56.2 price. MaxLinear’s target of 21 also indicates potential appreciation beyond its 16.8 price.

Don’t Let Luck Decide Your Entry Point
Optimize your entry points with our advanced ProRealTime indicators. You’ll get efficient buy signals with precise price targets for maximum performance. Start outperforming now!
How do institutions grade them?
Institutional grades provide insight into current market sentiment for both companies:
Skyworks Solutions, Inc. Grades
The following table summarizes recent grades from major financial institutions for Skyworks Solutions, Inc.:
| Grading Company | Action | New Grade | Date |
|---|---|---|---|
| Morgan Stanley | Maintain | Equal Weight | 2026-02-02 |
| B. Riley Securities | Maintain | Neutral | 2026-01-26 |
| Mizuho | Maintain | Neutral | 2026-01-26 |
| Susquehanna | Maintain | Neutral | 2026-01-22 |
| UBS | Maintain | Neutral | 2026-01-20 |
| Mizuho | Upgrade | Neutral | 2025-11-11 |
| UBS | Maintain | Neutral | 2025-11-05 |
| JP Morgan | Maintain | Neutral | 2025-11-05 |
| Barclays | Upgrade | Equal Weight | 2025-10-29 |
| Piper Sandler | Upgrade | Overweight | 2025-10-29 |
MaxLinear, Inc. Grades
Here are recent grades issued by reputable institutions for MaxLinear, Inc.:
| Grading Company | Action | New Grade | Date |
|---|---|---|---|
| Wells Fargo | Maintain | Equal Weight | 2026-01-30 |
| Benchmark | Maintain | Buy | 2026-01-16 |
| Benchmark | Maintain | Buy | 2025-10-24 |
| Benchmark | Maintain | Buy | 2025-10-17 |
| Benchmark | Maintain | Buy | 2025-09-02 |
| Loop Capital | Maintain | Hold | 2025-08-04 |
| Wells Fargo | Maintain | Equal Weight | 2025-07-24 |
| Benchmark | Maintain | Buy | 2025-07-24 |
| Susquehanna | Maintain | Neutral | 2025-07-24 |
| Susquehanna | Maintain | Neutral | 2025-07-22 |
Which company has the best grades?
MaxLinear consistently receives Buy ratings from Benchmark, reflecting strong analyst conviction. Skyworks holds mostly Neutral to Equal Weight grades, indicating a more cautious outlook. Investors may interpret MaxLinear’s grades as signaling higher growth expectations relative to Skyworks.
Risks specific to each company
The following categories identify critical pressure points and systemic threats facing Skyworks Solutions, Inc. and MaxLinear, Inc. in the 2026 market environment:
1. Market & Competition
Skyworks Solutions, Inc.
- Established leader with diverse product portfolio in semiconductors, facing intense competition but solid brand moat.
MaxLinear, Inc.
- Smaller player with niche SoC solutions, vulnerable to market share loss amid fierce semiconductor competition.
2. Capital Structure & Debt
Skyworks Solutions, Inc.
- Low debt-to-equity (0.21), strong interest coverage (20.44), indicating a conservative and stable capital structure.
MaxLinear, Inc.
- Moderate leverage (0.29 D/E) but negative interest coverage (-13.01) signals distress and credit risk.
3. Stock Volatility
Skyworks Solutions, Inc.
- Beta of 1.317 suggests moderate stock volatility, consistent with sector norms.
MaxLinear, Inc.
- Higher beta at 1.708, indicating elevated stock price swings and greater investor risk.
4. Regulatory & Legal
Skyworks Solutions, Inc.
- Operates globally with exposure to international semiconductor regulations and trade policies.
MaxLinear, Inc.
- Similar global exposure but smaller scale may limit lobbying power and increase regulatory vulnerabilities.
5. Supply Chain & Operations
Skyworks Solutions, Inc.
- Extensive global supply chain with diversified manufacturing reduces operational risks.
MaxLinear, Inc.
- Reliance on fewer suppliers and specialized components increases supply chain fragility.
6. ESG & Climate Transition
Skyworks Solutions, Inc.
- Stronger ESG focus expected due to larger size; likely better prepared for climate regulation impacts.
MaxLinear, Inc.
- ESG initiatives less mature; risk of lagging behind peers in sustainability compliance.
7. Geopolitical Exposure
Skyworks Solutions, Inc.
- Broad geographic footprint including China and Asia-Pacific, exposing it to trade tensions but also growth markets.
MaxLinear, Inc.
- Also exposed to geopolitical tensions but with less geographic diversification to mitigate risks.
Which company shows a better risk-adjusted profile?
Skyworks Solutions, Inc. faces manageable market and operational risks with a solid balance sheet and stable financial health. MaxLinear, Inc. contends with high financial distress, supply chain vulnerabilities, and greater stock volatility. Skyworks’ Altman Z-score in the safe zone (4.51) versus MaxLinear’s grey zone (2.13) confirms this. The most impactful risk for Skyworks is geopolitical exposure amid global trade tensions, while MaxLinear’s critical risk is its negative profitability and interest coverage, signaling financial instability. Overall, Skyworks offers a superior risk-adjusted profile, supported by its strong credit metrics and diversified operations.
Final Verdict: Which stock to choose?
Skyworks Solutions, Inc. (SWKS) shines as a cash machine with solid liquidity and a strong balance sheet. Its consistent free cash flow generation supports dividends and R&D. However, a declining ROIC warns investors to watch for eroding competitive advantage. It suits portfolios targeting steady income with moderate growth.
MaxLinear, Inc. (MXL) holds a niche moat in high-margin semiconductor R&D, fueling rapid revenue rebound. Its elevated R&D spend signals innovation focus, but weak profitability and negative returns highlight operational risks. Compared to SWKS, it offers less safety but more upside, fitting aggressive growth or turnaround seekers.
If you prioritize financial stability and income, Skyworks outshines due to its robust cash flow and balance sheet strength. However, if you seek growth potential and can tolerate volatility, MaxLinear offers better upside amid its ongoing recovery. Both carry risks, so align choices with your risk tolerance and investment horizon.
Disclaimer: Investment carries a risk of loss of initial capital. The past performance is not a reliable indicator of future results. Be sure to understand risks before making an investment decision.
Go Further
I encourage you to read the complete analyses of Skyworks Solutions, Inc. and MaxLinear, Inc. to enhance your investment decisions: