Home > Comparison > Technology > SLAB vs MXL
The competitive dynamic between Silicon Laboratories Inc. and MaxLinear, Inc. shapes the semiconductor sector’s future trajectory. Silicon Labs operates as a fabless semiconductor innovator specializing in analog-intensive mixed-signal solutions. MaxLinear focuses on high-performance RF, analog, and mixed-signal SoCs for communications infrastructure. This analysis pits Silicon Labs’ diversified IoT approach against MaxLinear’s integrated communications systems strategy to identify which offers superior risk-adjusted returns for a balanced portfolio.
Table of contents
Companies Overview
Silicon Laboratories Inc. and MaxLinear, Inc. are pivotal players shaping the semiconductor industry’s future.
Silicon Laboratories Inc.: Mixed-Signal Innovator
Silicon Laboratories Inc. stands as a fabless semiconductor leader specializing in analog-intensive mixed-signal solutions. It generates revenue primarily through wireless microcontrollers and sensor products serving the Internet of Things (IoT) market. In 2026, its strategic focus centers on expanding applications in industrial automation, smart metering, and connected home devices, leveraging its strong position in IoT ecosystems.
MaxLinear, Inc.: Communications SoC Specialist
MaxLinear, Inc. defines itself as a provider of high-performance analog and mixed-signal communications systems-on-chip (SoCs). The company earns revenue by integrating RF, digital signal processing, and power management into broadband and wireless infrastructure devices. Its 2026 strategy emphasizes innovation in 4G/5G base stations, home networking, and fiber-optic transport, targeting infrastructure upgrades across multiple communication markets.
Strategic Collision: Similarities & Divergences
Both companies compete in mixed-signal semiconductor solutions yet diverge philosophically—Silicon Labs focuses on IoT device integration, while MaxLinear pursues communication infrastructure dominance. Their primary battleground lies in connected home and industrial networks. Investors face distinct profiles: Silicon Labs offers IoT-centric growth, whereas MaxLinear provides exposure to broadband and wireless infrastructure evolution.
Income Statement Comparison
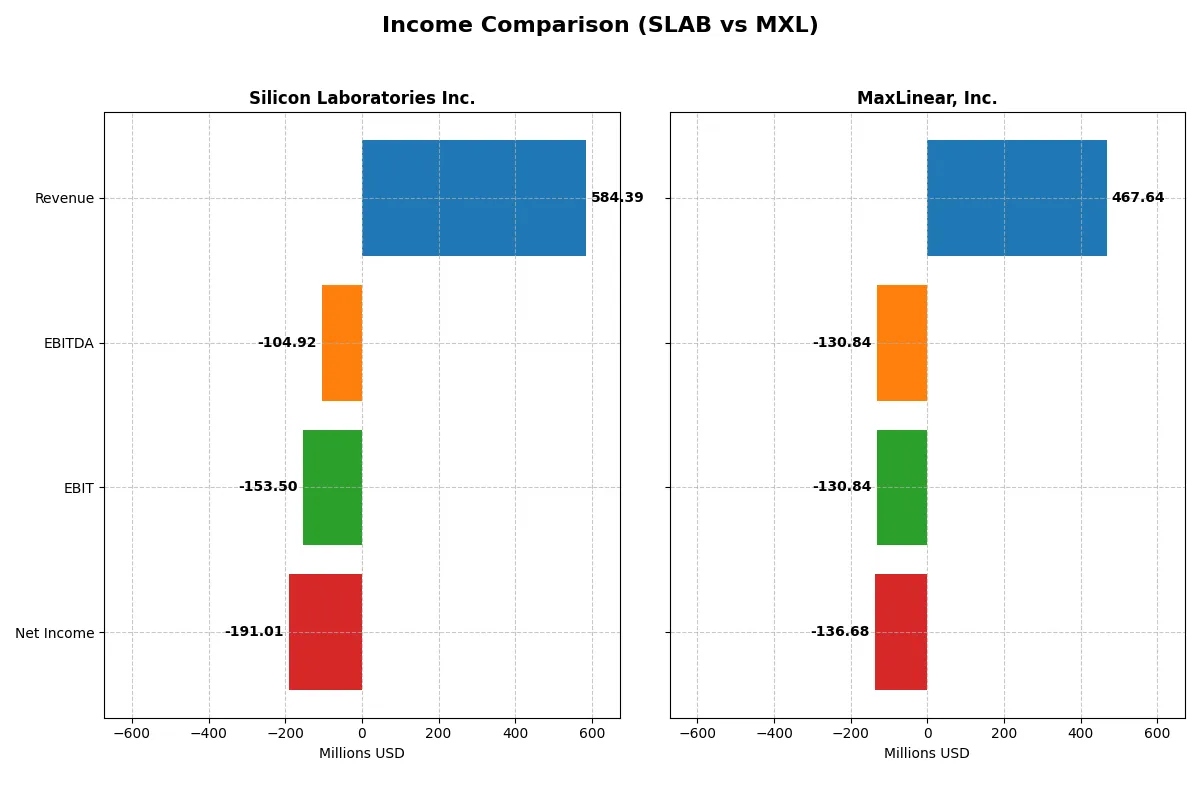
The following data dissects the core profitability and scalability of both corporate engines to reveal who dominates the bottom line:
| Metric | Silicon Laboratories Inc. (SLAB) | MaxLinear, Inc. (MXL) |
|---|---|---|
| Revenue | 584M | 360M |
| Cost of Revenue | 272M | 168M |
| Operating Expenses | 478M | 361M |
| Gross Profit | 312M | 192M |
| EBITDA | -105M | -182M |
| EBIT | -154M | -228M |
| Interest Expense | 1.3M | 10.9M |
| Net Income | -191M | -245M |
| EPS | -5.93 | -2.93 |
| Fiscal Year | 2024 | 2024 |
Income Statement Analysis: The Bottom-Line Duel
This income statement comparison will expose which company operates more efficiently and sustains better profitability under current market conditions.
Silicon Laboratories Inc. Analysis
Silicon Laboratories’ revenue declined notably by 25% from 2023 to 2024, with net income plunging deeper into negative territory at -$191M in 2024. Despite a solid gross margin of 53%, the company’s net margin fell sharply to -33%, reflecting escalating operating expenses and inefficiencies. The deteriorating EBIT margin at -26% signals worsening profitability and operational challenges.
MaxLinear, Inc. Analysis
MaxLinear reversed its revenue decline with a 30% rise in 2025, reaching $468M, and improved gross profit by 38%. However, it still reported a net loss of $137M, though net margin improved slightly to -29%. Its gross margin of 57% leads the peer group, but ongoing negative EBIT margin near -28% underscores persistent profitability hurdles despite recent momentum.
Margin Resilience vs. Revenue Recovery
MaxLinear shows stronger margin resilience and recent revenue growth, while Silicon Labs battles shrinking top-line and expanding losses. MaxLinear’s improving earnings trajectory and higher gross margins position it as the more fundamentally stable operator. Investors seeking a recovery story with margin discipline may find MaxLinear’s profile more attractive at this stage.
Financial Ratios Comparison
These vital ratios act as a diagnostic tool to expose the underlying fiscal health, valuation premiums, and capital efficiency of the companies compared below:
| Ratios | Silicon Laboratories Inc. (SLAB) | MaxLinear, Inc. (MXL) |
|---|---|---|
| ROE | -17.7% | -47.5% |
| ROIC | -14.7% | -24.3% |
| P/E | -21.5 | -6.74 |
| P/B | 3.81 | 3.20 |
| Current Ratio | 6.15 | 1.77 |
| Quick Ratio | 5.07 | 1.28 |
| D/E | 0.014 | 0.29 |
| Debt-to-Assets | 1.27% | 17.23% |
| Interest Coverage | -126.3 | -15.5 |
| Asset Turnover | 0.48 | 0.42 |
| Fixed Asset Turnover | 4.42 | 4.65 |
| Payout ratio | 0 | 0 |
| Dividend yield | 0 | 0 |
| Fiscal Year | 2024 | 2024 |
Efficiency & Valuation Duel: The Vital Signs
Ratios act as a company’s DNA, revealing hidden risks and operational excellence behind headline numbers.
Silicon Laboratories Inc.
Silicon Laboratories shows weak profitability with a -17.7% ROE and negative margins, signaling operational challenges. The valuation appears favorable with a negative P/E, suggesting market skepticism. Despite no dividends, the company invests heavily in R&D, accounting for over 56% of revenue, aiming to fuel long-term growth rather than immediate shareholder returns.
MaxLinear, Inc.
MaxLinear suffers from deeper profitability issues, with a -47.5% ROE and steeper negative margins, indicating more severe operational stress. Its P/E is also negative but less so than Silicon Labs, hinting at relatively less market pessimism. MXL lacks dividends and aggressively allocates over 62% of revenue to R&D, prioritizing product innovation over payouts.
Valuation Edge vs. Profitability Struggles
Silicon Labs offers a more attractive valuation and a stronger balance sheet with a high current ratio, but faces operational inefficiencies. MaxLinear displays worse profitability metrics and longer cash conversion cycles. Investors seeking a valuation discount with growth focus may prefer Silicon Labs; those betting on turnaround potential might consider MaxLinear’s aggressive R&D profile.
Which one offers the Superior Shareholder Reward?
Silicon Laboratories (SLAB) and MaxLinear (MXL) both forgo dividends, focusing on reinvestment and buybacks. SLAB’s dividend yield is 0%, with a negative free cash flow per share (-0.8 in 2024), signaling limited buyback capacity. MXL also yields 0%, but its free cash flow per share is similarly negative (-0.75 in 2024). SLAB maintains a stronger balance sheet with a current ratio above 6, supporting potential future buybacks. MXL’s current ratio around 1.8 suggests tighter liquidity but a more aggressive capital expenditure coverage ratio (around 1.9 vs. SLAB’s negative). Both companies recently lack consistent buyback programs, but SLAB’s superior cash reserves and asset turnover hint at better long-term sustainability. I conclude SLAB offers a more attractive total return profile in 2026 due to stronger financial flexibility, despite both lacking dividend payouts.
Comparative Score Analysis: The Strategic Profile
The radar chart reveals the fundamental DNA and trade-offs of Silicon Laboratories Inc. and MaxLinear, Inc., highlighting their competitive positioning and financial strengths:
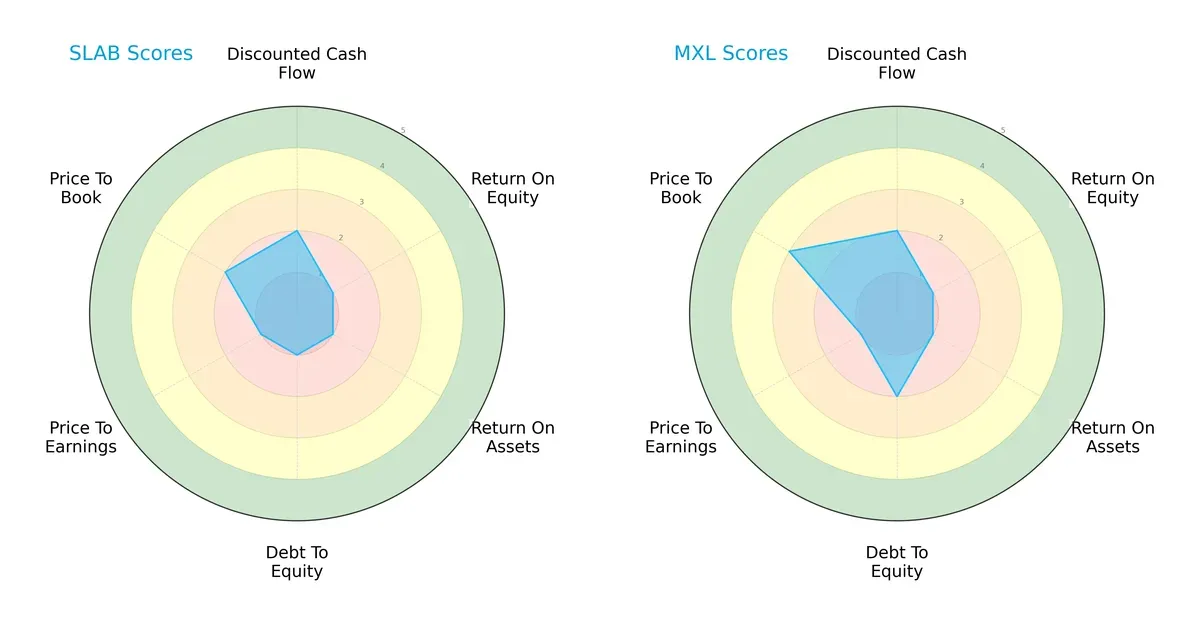
Silicon Laboratories shows a more consistent, though generally weak, profile with very unfavorable scores in ROE, ROA, Debt/Equity, and P/E, but a moderate P/B score. MaxLinear edges ahead with a moderate overall score, stronger Debt/Equity and P/B ratings, but shares similar weaknesses in profitability metrics. MaxLinear relies on a balance sheet advantage, while Silicon Labs struggles across most dimensions.
Bankruptcy Risk: Solvency Showdown
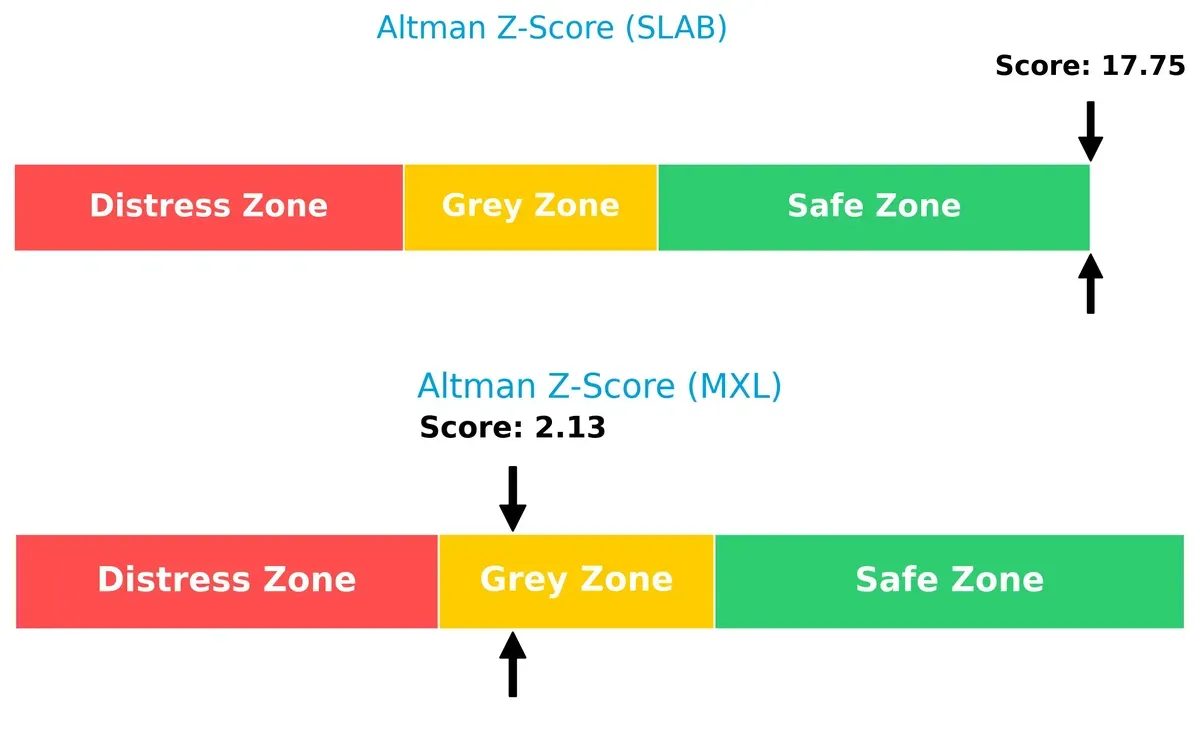
Silicon Labs’ Altman Z-Score at 17.75 places it firmly in the safe zone, signaling robust financial stability. MaxLinear’s 2.13 score situates it in the grey zone, indicating moderate bankruptcy risk in this cycle:
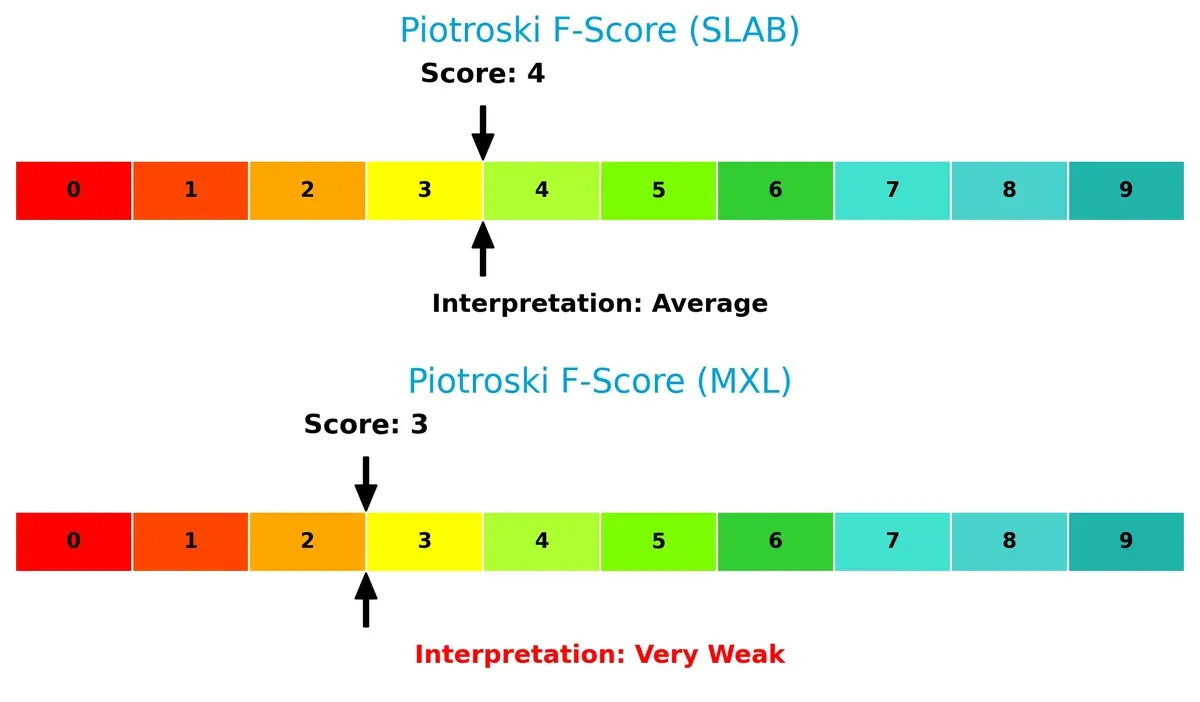
Financial Health: Quality of Operations
Silicon Labs posts a Piotroski F-Score of 4, reflecting average operational health. MaxLinear scores slightly lower at 3, showing signs of red flags and weaker internal financial metrics:
How are the two companies positioned?
This section dissects SLAB and MXL’s operational DNA by comparing their revenue distribution and internal dynamics. The goal is to confront their economic moats and identify which model offers the most resilient competitive advantage today.
Revenue Segmentation: The Strategic Mix
This visual comparison dissects how Silicon Laboratories Inc. and MaxLinear, Inc. diversify their income streams and where their primary sector bets lie:
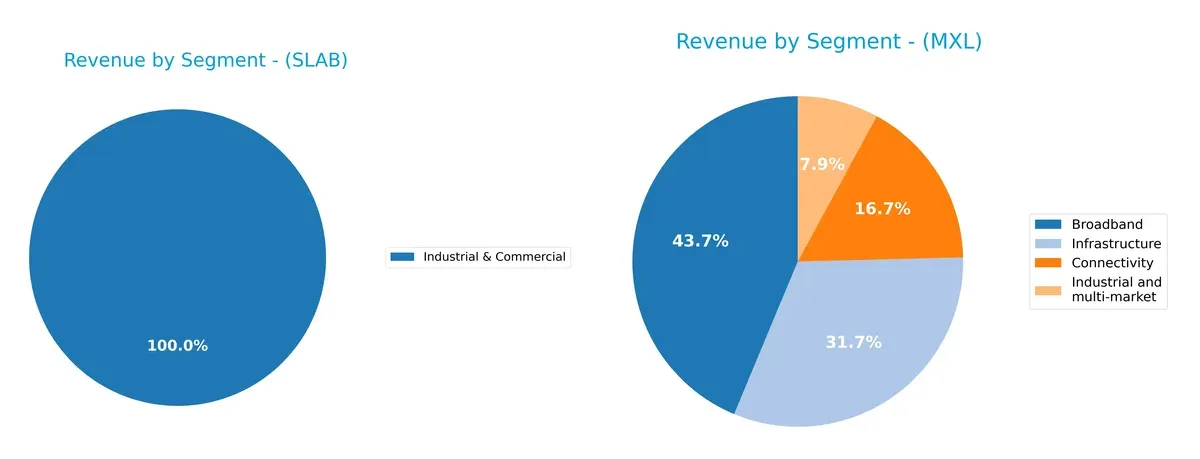
Silicon Laboratories pivots on a concentrated Industrial & Commercial segment with $497M in 2023, showing less diversification recently. MaxLinear spreads revenue across Broadband ($204M), Connectivity ($138M), Industrial & Multi-market ($174M), and Infrastructure ($177M) in 2023, reflecting a balanced portfolio. MaxLinear’s diversification mitigates concentration risk, while Silicon Labs’ focus suggests deeper ecosystem lock-in but higher vulnerability to single-sector downturns.
Strengths and Weaknesses Comparison
This table compares the strengths and weaknesses of Silicon Laboratories Inc. and MaxLinear, Inc.:
Silicon Laboratories Inc. Strengths
- Very high current and quick ratios indicate strong liquidity
- Minimal debt levels with low debt-to-assets ratio
- Efficient fixed asset turnover shows effective asset use
MaxLinear, Inc. Strengths
- Favorable current and quick ratios reflect solid short-term financial health
- Moderate debt levels manageable with favorable debt-to-assets ratio
- Slightly higher fixed asset turnover suggests effective capital utilization
Silicon Laboratories Inc. Weaknesses
- Negative profitability metrics: net margin, ROE, and ROIC
- High weighted average cost of capital exceeding returns
- Negative interest coverage ratio signals financial stress
- Declining industrial & commercial revenues over recent years
MaxLinear, Inc. Weaknesses
- More severe profitability weaknesses with deeper negative margins and ROE
- WACC remains above returns, implying capital inefficiency
- Negative interest coverage highlights financial risk
- Revenue concentration in broadband with less diversification
Both companies exhibit unfavorable profitability and capital efficiency, despite strong liquidity and asset turnover. Silicon Labs shows superior liquidity and lower leverage, while MaxLinear maintains better diversification in product segments. These factors shape their strategic priorities around improving profitability and managing financial risks.
The Moat Duel: Analyzing Competitive Defensibility
A structural moat is the only reliable shield protecting long-term profits from relentless competitive erosion. Let’s examine how these two semiconductor firms defend their turf:
Silicon Laboratories Inc. (SLAB): Intangible Assets Anchoring Innovation
SLAB leverages proprietary analog and mixed-signal technology as its moat. This shows in its historically superior gross margins near 53%, despite recent profit declines. New IoT product lines could deepen this moat if execution improves.
MaxLinear, Inc. (MXL): Integrated Platform Cost Advantage
MXL’s edge lies in highly integrated SoCs combining RF, analog, and digital functions. Its 57% recent revenue growth signals strong operational leverage, contrasting SLAB’s decline. Expansion into 5G infrastructure offers runway for moat expansion.
Verdict: Intangible Assets vs. Platform Integration in Semiconductor Moats
Both firms suffer declining ROIC trends, signaling value erosion. Yet, MXL’s recent revenue and margin growth suggest a more resilient, widening moat. I see MXL better positioned to defend market share amid industry disruption.
Which stock offers better returns?
Over the past 12 months, Silicon Laboratories Inc. surged nearly 7%, showing accelerating gains and a strong peak near 155.33. MaxLinear, Inc. declined roughly 5%, despite recent upticks signaling potential recovery.
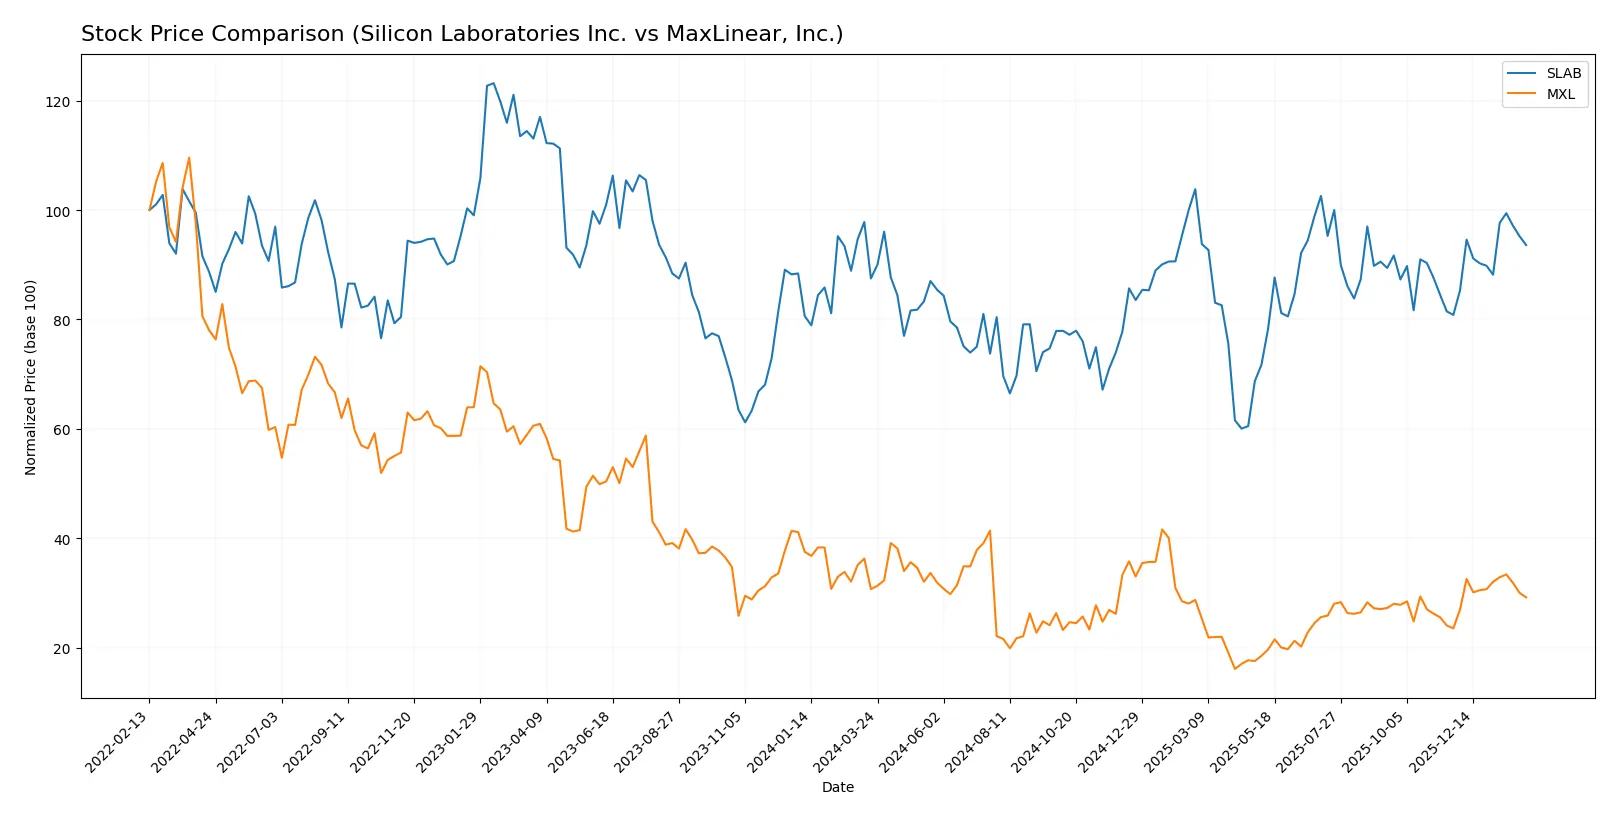
Trend Comparison
Silicon Laboratories Inc. posted a 6.98% rise over the last year, confirming a bullish trend with accelerating momentum and a notable price range between 89.82 and 155.33.
MaxLinear, Inc. recorded a 4.99% drop over the same period, indicating a bearish trend despite acceleration and a recent 24.01% rally in the last two months.
Silicon Laboratories Inc. delivered stronger annual returns, outperforming MaxLinear, Inc. by over 11 percentage points in market price appreciation.
Target Prices
Analysts present a clear target price range for Silicon Laboratories Inc. and MaxLinear, Inc., reflecting moderate upside potential.
| Company | Target Low | Target High | Consensus |
|---|---|---|---|
| Silicon Laboratories Inc. | 130 | 165 | 151.67 |
| MaxLinear, Inc. | 15 | 25 | 21 |
The consensus target for Silicon Laboratories (151.67) suggests a 9% upside from the current 139.42 price. MaxLinear’s 21 consensus target implies a 24% increase from the 16.93 stock price.

Don’t Let Luck Decide Your Entry Point
Optimize your entry points with our advanced ProRealTime indicators. You’ll get efficient buy signals with precise price targets for maximum performance. Start outperforming now!
How do institutions grade them?
Silicon Laboratories Inc. Grades
The following table summarizes recent grades from reputable institutions for Silicon Laboratories Inc.
| Grading Company | Action | New Grade | Date |
|---|---|---|---|
| Morgan Stanley | Maintain | Equal Weight | 2025-08-06 |
| Susquehanna | Maintain | Neutral | 2025-08-06 |
| Barclays | Maintain | Equal Weight | 2025-08-05 |
| Susquehanna | Maintain | Neutral | 2025-07-22 |
| Stifel | Maintain | Buy | 2025-07-18 |
| Keybanc | Maintain | Overweight | 2025-07-08 |
| Benchmark | Maintain | Buy | 2025-05-27 |
| Benchmark | Maintain | Buy | 2025-05-14 |
| Needham | Maintain | Buy | 2025-05-14 |
| Susquehanna | Maintain | Neutral | 2025-05-14 |
MaxLinear, Inc. Grades
Below is a summary of recent grades from established grading companies for MaxLinear, Inc.
| Grading Company | Action | New Grade | Date |
|---|---|---|---|
| Wells Fargo | Maintain | Equal Weight | 2026-01-30 |
| Benchmark | Maintain | Buy | 2026-01-16 |
| Benchmark | Maintain | Buy | 2025-10-24 |
| Benchmark | Maintain | Buy | 2025-10-17 |
| Benchmark | Maintain | Buy | 2025-09-02 |
| Loop Capital | Maintain | Hold | 2025-08-04 |
| Wells Fargo | Maintain | Equal Weight | 2025-07-24 |
| Benchmark | Maintain | Buy | 2025-07-24 |
| Susquehanna | Maintain | Neutral | 2025-07-24 |
| Susquehanna | Maintain | Neutral | 2025-07-22 |
Which company has the best grades?
Silicon Laboratories shows a mix of Buy and Neutral grades, with several Buy ratings from Benchmark and Stifel. MaxLinear holds more consistent Buy ratings from Benchmark but also has Equal Weight and Hold grades. Investors may interpret Silicon Laboratories’ broader rating range as a signal of mixed institutional confidence, whereas MaxLinear’s steady Buy ratings suggest stronger consensus support.
Risks specific to each company
In 2026, both Silicon Laboratories Inc. and MaxLinear, Inc. face critical pressure points and systemic threats across seven key risk categories in the semiconductor market environment:
1. Market & Competition
Silicon Laboratories Inc.
- Faces intense competition in analog/mixed-signal IoT solutions; innovation pace is crucial to maintain market share.
MaxLinear, Inc.
- Operates in high-speed RF and communications SoCs with aggressive competitors; product integration is a key battleground.
2. Capital Structure & Debt
Silicon Laboratories Inc.
- Minimal debt exposure with a 0.01 debt-to-equity; strong liquidity but poor interest coverage signals operational cash flow issues.
MaxLinear, Inc.
- Moderate leverage with 0.29 debt-to-equity; better current ratio but negative interest coverage indicates financial stress.
3. Stock Volatility
Silicon Laboratories Inc.
- Beta of 1.536 implies above-market volatility; share price range $82.82–$160 suggests significant price swings.
MaxLinear, Inc.
- Higher beta at 1.708 indicates greater volatility risk; trading between $8.35–$20.82 reflects wider investor uncertainty.
4. Regulatory & Legal
Silicon Laboratories Inc.
- Exposure to U.S. and China trade policies may disrupt supply and sales; compliance in multiple regions is complex.
MaxLinear, Inc.
- Similar geopolitical regulatory risks due to international markets; must navigate evolving communications and security regulations.
5. Supply Chain & Operations
Silicon Laboratories Inc.
- Fabless model relies on third-party foundries; supply interruptions or cost inflation pose material risks.
MaxLinear, Inc.
- Also fabless with dependency on external suppliers; logistics and component shortages could delay product delivery.
6. ESG & Climate Transition
Silicon Laboratories Inc.
- ESG efforts not prominent; increasing investor and regulatory pressure to improve sustainability practices.
MaxLinear, Inc.
- Faces similar ESG scrutiny; must accelerate climate transition actions to meet stakeholder expectations.
7. Geopolitical Exposure
Silicon Laboratories Inc.
- Significant exposure to U.S.-China tensions impacting manufacturing and sales channels.
MaxLinear, Inc.
- Equally vulnerable to geopolitical conflicts affecting global supply chains and market access.
Which company shows a better risk-adjusted profile?
Silicon Laboratories’ most impactful risk is its weak operational cash flow, reflected in negative interest coverage despite minimal debt. MaxLinear carries higher leverage and volatility, raising financial distress concerns. However, Silicon Labs’ Altman Z-score of 17.75 places it in a safe zone versus MaxLinear’s 2.13 in the grey zone. I see Silicon Labs as having a better risk-adjusted profile, supported by its strong liquidity ratio of 6.15 compared to MaxLinear’s more moderate 1.77. The persistent negative margins highlight operational challenges for both, but MaxLinear’s debt and weaker Piotroski score deepen its risk.
Final Verdict: Which stock to choose?
Silicon Laboratories Inc. (SLAB) stands out for its robust liquidity, showcasing a strong buffer to weather short-term shocks. Its superpower lies in solid asset turnover, hinting at operational efficiency despite profitability challenges. A point of vigilance is its declining ROIC, signaling value erosion. SLAB suits portfolios targeting aggressive growth with tolerance for volatility.
MaxLinear, Inc. (MXL) leverages an intangible asset-heavy base, reflecting a strategic moat in specialized R&D capabilities. Its improving income statement and moderate leverage offer a relatively safer profile than SLAB. MXL fits well in GARP portfolios seeking growth potential balanced with measured risk exposure.
If you prioritize operational efficiency and liquidity as growth levers, SLAB is the compelling choice due to its stronger asset utilization and cash conversion. However, if you seek a more balanced risk-return profile with focus on innovation-driven moat, MXL offers better stability and growth improvement. Both remain value destroyers currently, so risk management is essential in either scenario.
Disclaimer: Investment carries a risk of loss of initial capital. The past performance is not a reliable indicator of future results. Be sure to understand risks before making an investment decision.
Go Further
I encourage you to read the complete analyses of Silicon Laboratories Inc. and MaxLinear, Inc. to enhance your investment decisions: