Home > Comparison > Technology > Q vs MXL
The strategic rivalry between Qnity Electronics, Inc. and MaxLinear, Inc. shapes the semiconductor industry’s future. Qnity operates as a provider of advanced electronic materials essential for chip manufacturing, emphasizing capital-intensive production. MaxLinear delivers integrated, high-performance mixed-signal communication systems-on-chip, focusing on scalable connectivity solutions. This analysis pits Qnity’s manufacturing depth against MaxLinear’s innovation race. I will determine which trajectory offers superior risk-adjusted returns for a diversified technology portfolio.
Table of contents
Companies Overview
Qnity Electronics and MaxLinear both play pivotal roles in the semiconductor industry, shaping the future of electronic communication and manufacturing.
Qnity Electronics, Inc.: Advanced Semiconductor Materials Provider
Qnity Electronics dominates the semiconductor materials niche by supplying essential electronic solutions for chip manufacturing. Its core revenue stems from advanced electronic materials critical to semiconductor fabrication. In 2025, Qnity strategically rebranded to emphasize its commitment to innovation in semiconductor materials, marking a pivotal shift in its market positioning.
MaxLinear, Inc.: Integrated Communications SoC Innovator
MaxLinear excels in designing radiofrequency and mixed-signal systems-on-chip that power connected homes and communications infrastructure. Its revenue engine relies on integrated SoCs used in broadband modems, routers, and 4G/5G infrastructure. The company’s 2026 focus is on enhancing end-to-end communication platform solutions for diverse market applications, emphasizing system integration and power management.
Strategic Collision: Similarities & Divergences
Both companies operate within the semiconductor sector but diverge sharply in their approach. Qnity excels in materials supply, a foundational yet less visible layer, while MaxLinear builds complex, integrated communication chips. Their competition centers on the semiconductor supply chain’s upstream versus downstream segments. This contrast defines their distinct risk profiles and opportunities within the broader technology landscape.
Income Statement Comparison
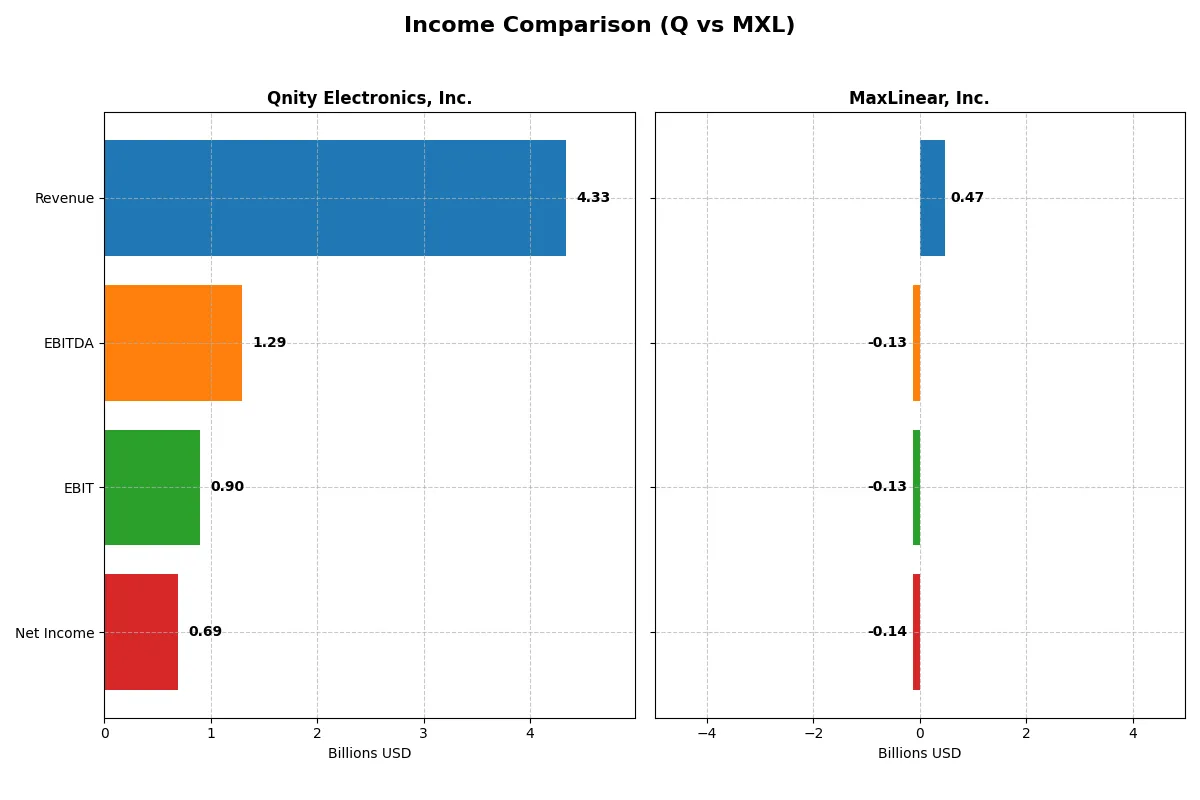
This data dissects the core profitability and scalability of both corporate engines to reveal who dominates the bottom line:
| Metric | Qnity Electronics, Inc. (Q) | MaxLinear, Inc. (MXL) |
|---|---|---|
| Revenue | 4.34B | 468M |
| Cost of Revenue | 2.34B | 202M |
| Operating Expenses | 1.16B | 393M |
| Gross Profit | 2.00B | 266M |
| EBITDA | 1.29B | -131M |
| EBIT | 898M | -131M |
| Interest Expense | 280M | 10M |
| Net Income | 693M | -137M |
| EPS | 3.31 | -1.58 |
| Fiscal Year | 2024 | 2025 |
Income Statement Analysis: The Bottom-Line Duel
This income statement comparison reveals which company runs a more efficient and profitable corporate engine through recent financial trends and margin dynamics.
Qnity Electronics, Inc. Analysis
Qnity’s revenue peaked at 4.75B in 2022 before a moderate 7.4% decline to 4.34B in 2024. Net income followed a similar pattern, falling from 774M in 2022 to 693M in 2024. Gross margin stays strong around 46%, while net margin improves to nearly 16%. In 2024, Qnity accelerates EBIT growth by 36.7%, signaling improving operational efficiency and margin expansion.
MaxLinear, Inc. Analysis
MaxLinear’s revenue shrank sharply from 1.12B in 2022 to 468M in 2025 but gained 29.7% from 2024 to 2025. Despite a favorable gross margin near 57%, MaxLinear’s net margin remains deeply negative at -29%. The firm narrowed its net loss by 57% in the latest year, showing momentum but still battling unprofitability. Operating losses persist, reflecting ongoing structural challenges.
Margin Robustness vs. Recovery Trajectory
Qnity demonstrates stable profitability with consistently healthy margins and improving EBIT, marking it as the fundamentally stronger operator. MaxLinear shows encouraging revenue and margin recovery but continues to report significant net losses, undermining its current financial stability. Investors seeking reliable earnings will find Qnity’s profile more attractive, while MaxLinear’s turnaround story carries elevated risk.
Financial Ratios Comparison
These vital ratios act as a diagnostic tool to expose the underlying fiscal health, valuation premiums, and capital efficiency of the companies analyzed:
| Ratios | Qnity Electronics, Inc. (Q) | MaxLinear, Inc. (MXL) |
|---|---|---|
| ROE | 6.51% | -47.49% |
| ROIC | 5.92% | -24.31% |
| P/E | 28.8 | -6.74 |
| P/B | 1.88 | 3.20 |
| Current Ratio | 1.77 | 1.77 |
| Quick Ratio | 1.06 | 1.28 |
| D/E | 0.02 | 0.29 |
| Debt-to-Assets | 1.56% | 17.23% |
| Interest Coverage | 3.03 | -15.52 |
| Asset Turnover | 0.35 | 0.42 |
| Fixed Asset Turnover | 2.59 | 4.65 |
| Payout ratio | 0 | 0 |
| Dividend yield | 0 | 0 |
| Fiscal Year | 2024 | 2024 |
Efficiency & Valuation Duel: The Vital Signs
Financial ratios serve as a company’s DNA, unveiling hidden risks and operational strengths that shape investment outcomes.
Qnity Electronics, Inc.
Qnity Electronics posts a moderate ROE of 6.5% with a strong net margin near 16%, signaling decent profitability. The valuation is stretched, with a P/E of 28.8, above typical sector averages. The company retains earnings for growth, offering no dividend, reflecting a reinvestment emphasis on R&D at 7.2% of revenue.
MaxLinear, Inc.
MaxLinear suffers negative profitability, with ROE at -47.5% and a net margin of -68%, indicating deep operational struggles. Despite a seemingly attractive negative P/E, its price-to-book ratio at 3.2 flags overvaluation risks. The firm pays no dividends and heavily invests in R&D, dedicating 62.5% of sales to innovation amid losses.
Profitability Edge vs. Growth Gambit
Qnity Electronics balances moderate profitability with elevated valuation, emphasizing steady reinvestment over payouts. MaxLinear’s dire profitability and high valuation signal substantial risk despite aggressive R&D. Investors seeking operational stability may favor Qnity, while those pursuing turnaround potential might consider MaxLinear’s high-risk profile.
Which one offers the Superior Shareholder Reward?
Qnity Electronics (Q) and MaxLinear (MXL) both forgo dividends, focusing on reinvestment and buybacks for shareholder returns. Q maintains a clean balance sheet with minimal debt (1.8% debt-to-equity) and robust free cash flow of 4.1/share in 2024. It aggressively repurchases shares, fueling capital returns sustainably. MXL struggles with negative net margins and operating cash flow, despite moderate buyback programs. Its higher leverage (29% debt-to-equity) and cash burn raise sustainability concerns. I see Q’s prudent buyback-fueled model as superior for total shareholder return in 2026, offering a more durable path to value creation.
Comparative Score Analysis: The Strategic Profile
The radar chart reveals the fundamental DNA and trade-offs of Qnity Electronics, Inc. and MaxLinear, Inc., highlighting their distinct financial strengths and vulnerabilities:
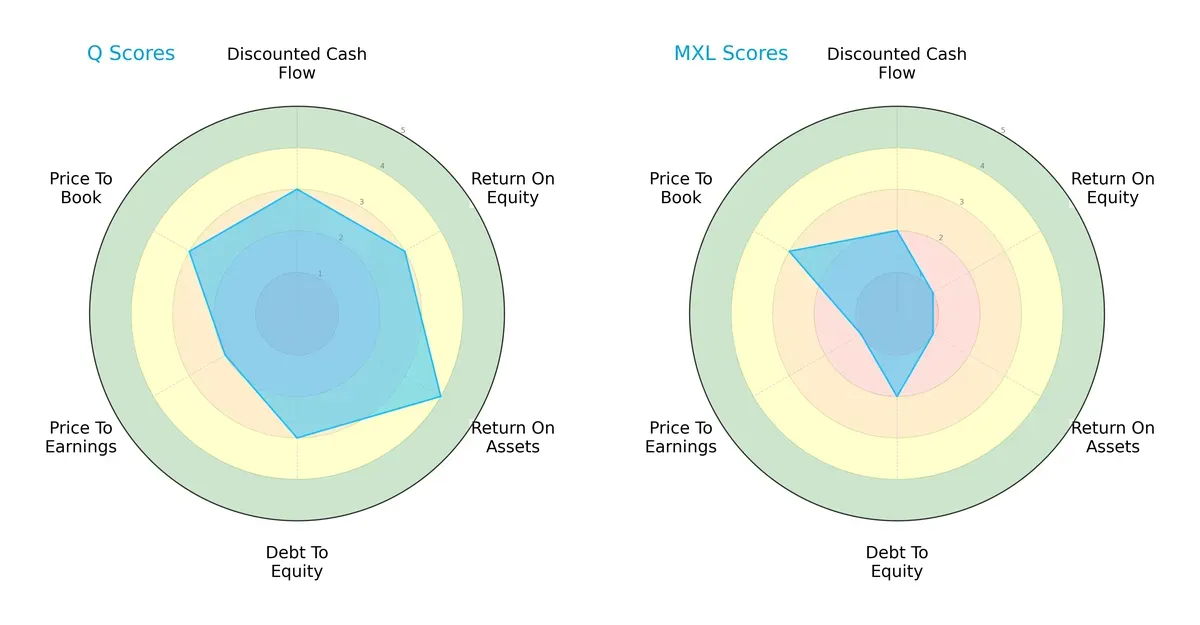
Qnity Electronics shows a more balanced profile, excelling in return on assets (score 4) and maintaining moderate scores in DCF, ROE, and debt/equity. MaxLinear relies heavily on its price-to-book valuation (score 3) but falls short on profitability metrics, with very unfavorable ROE and ROA scores (both 1). Qnity’s diversified strengths provide a sturdier foundation, while MaxLinear depends on valuation appeal amid weaker operational performance.
How are the two companies positioned?
This section dissects the operational DNA of Q and MXL by comparing their revenue distribution and internal dynamics. The goal is to confront their economic moats to reveal which model secures the most resilient competitive advantage today.
Revenue Segmentation: The Strategic Mix
This visual comparison dissects how Qnity Electronics, Inc. and MaxLinear, Inc. diversify their income streams and where their primary sector bets lie:
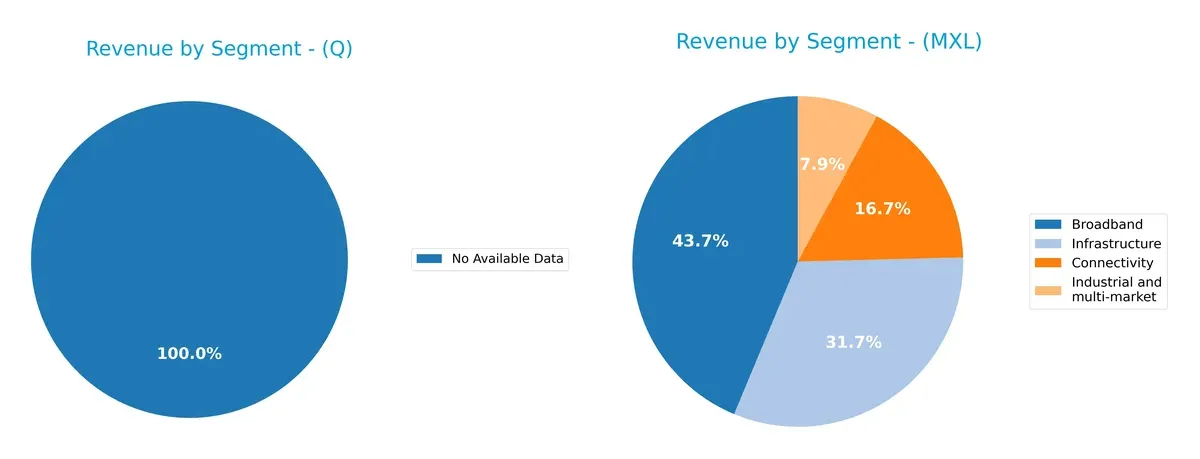
Qnity Electronics lacks available data, preventing segmentation analysis. MaxLinear pivots on Broadband, which dwarfs other segments at $204M in 2025. Infrastructure anchors $148M, while Connectivity and Industrial segments trail at $78M and $37M. MaxLinear’s mix shows moderate diversification but leans heavily on Broadband, exposing it to concentration risk in a competitive tech ecosystem.
Strengths and Weaknesses Comparison
This table compares the Strengths and Weaknesses of Qnity Electronics and MaxLinear:
Q Strengths
- Favorable net margin of 16%
- Low debt-to-assets at 1.56%
- Strong liquidity with current ratio 1.77
- WACC below ROIC supports value creation
MXL Strengths
- Diverse product segments including broadband and infrastructure
- Favorable current and quick ratios indicate liquidity
- Higher fixed asset turnover at 4.65
- Geographic exposure with significant Asia sales
Q Weaknesses
- Unfavorable ROE at 6.5% below benchmark
- Elevated P/E ratio of 28.8 suggests overvaluation
- Low asset turnover at 0.35 limits efficiency
- No dividend yield reduces income appeal
MXL Weaknesses
- Negative net margin and ROE reflect losses
- Unfavorable WACC at 11.45% raises capital costs
- Negative interest coverage signals financial stress
- High P/B ratio at 3.2 may indicate valuation risk
Q shows solid financial health with profitability and liquidity strengths, but efficiency and valuation metrics warrant caution. MXL’s broad diversification and asset utilization are positives, yet significant profitability and financial risks challenge its stability.
The Moat Duel: Analyzing Competitive Defensibility
A true structural moat shields long-term profits from relentless competitive pressure and market disruption. Let’s dissect the moats of these two semiconductor players:
Qnity Electronics, Inc.: Stable Operational Efficiency
Qnity’s moat stems from operational efficiency and stable margin control, reflected in a consistent 20.7% EBIT margin and 16% net margin in 2024. However, its ROIC barely surpasses WACC, signaling no clear value creation yet. Innovation in advanced semiconductor materials could deepen this moat but competitive entry remains a risk.
MaxLinear, Inc.: Innovation-Driven Product Integration
MaxLinear’s competitive edge lies in its integrated SoC solutions blending RF, analog, and digital technology. Despite a strong 57% gross margin, it suffers from negative EBIT and net margins, reflecting profitability challenges. Revenue growth near 30% shows market traction, but its declining ROIC warns of value erosion unless cost structures improve.
Operational Efficiency vs. Product Integration: Who Defends Better?
Qnity’s stable margins and neutral ROIC trend suggest a modest but steady moat. MaxLinear’s innovation fuels growth but its negative returns and shrinking ROIC expose vulnerability. I view Qnity as better poised to defend market share due to consistent profitability, while MaxLinear must address profitability to sustain its moat.
Which stock offers better returns?
Over the past 12 months, Qnity Electronics, Inc. gained 7.39%, showing accelerating bullish momentum. MaxLinear, Inc. declined 3.11%, despite recent positive price moves.
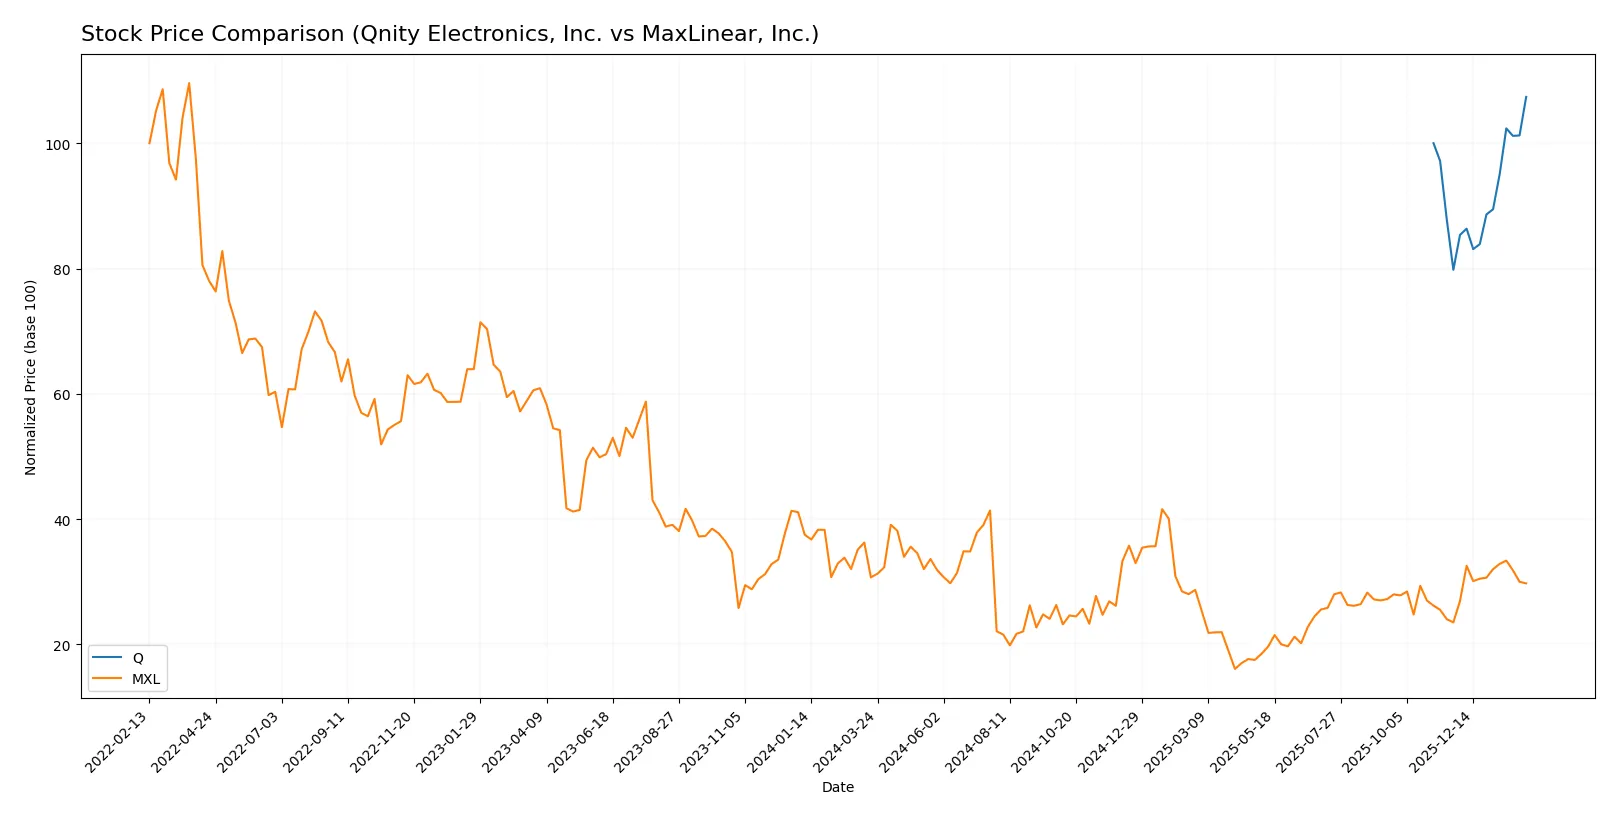
Trend Comparison
Qnity Electronics, Inc. exhibits a 7.39% price increase over 12 months with accelerating bullish momentum and notable volatility at 7.81%. The stock’s recent 34.6% surge confirms strong upward acceleration.
MaxLinear, Inc. shows a 3.11% decline over the same period, marking a bearish trend despite acceleration. Recent gains of 26.45% indicate a possible recovery but with lower volatility (1.53%).
Qnity Electronics leads in overall market performance, combining steady gains and accelerating strength, whereas MaxLinear’s longer-term trend remains negative.
Target Prices
Analysts present a clear target consensus for Qnity Electronics, Inc. and MaxLinear, Inc.
| Company | Target Low | Target High | Consensus |
|---|---|---|---|
| Qnity Electronics | 92 | 118 | 106.78 |
| MaxLinear | 15 | 25 | 21 |
Qnity’s consensus target sits about 5% above its current price of 101.59, signaling moderate upside. MaxLinear’s consensus target nearly doubles its current price of 16.87, indicating strong potential growth expectations.

Don’t Let Luck Decide Your Entry Point
Optimize your entry points with our advanced ProRealTime indicators. You’ll get efficient buy signals with precise price targets for maximum performance. Start outperforming now!
How do institutions grade them?
The following presents the latest official grades assigned to Qnity Electronics, Inc. and MaxLinear, Inc.:
Qnity Electronics, Inc. Grades
This table summarizes recent grade updates from recognized financial institutions:
| Grading Company | Action | New Grade | Date |
|---|---|---|---|
| RBC Capital | Maintain | Outperform | 2025-11-25 |
| Mizuho | Maintain | Outperform | 2025-11-20 |
MaxLinear, Inc. Grades
Recent grades from established grading firms are detailed below:
| Grading Company | Action | New Grade | Date |
|---|---|---|---|
| Wells Fargo | Maintain | Equal Weight | 2026-01-30 |
| Benchmark | Maintain | Buy | 2026-01-16 |
| Benchmark | Maintain | Buy | 2025-10-24 |
| Benchmark | Maintain | Buy | 2025-10-17 |
| Benchmark | Maintain | Buy | 2025-09-02 |
| Loop Capital | Maintain | Hold | 2025-08-04 |
| Wells Fargo | Maintain | Equal Weight | 2025-07-24 |
| Benchmark | Maintain | Buy | 2025-07-24 |
| Susquehanna | Maintain | Neutral | 2025-07-24 |
| Susquehanna | Maintain | Neutral | 2025-07-22 |
Which company has the best grades?
Qnity Electronics consistently earns “Outperform” ratings from RBC Capital and Mizuho, signaling strong institutional confidence. MaxLinear shows a broader range from “Buy” to “Equal Weight” and “Hold,” reflecting mixed views that could introduce more volatility for investors.
Risks specific to each company
The following categories identify the critical pressure points and systemic threats facing both firms in the 2026 market environment:
1. Market & Competition
Qnity Electronics, Inc.
- Recently rebranded, Qnity faces competitive pressure but benefits from a strong market position in semiconductor materials.
MaxLinear, Inc.
- MaxLinear competes in a crowded SoC market with diverse applications but struggles with profitability and market share.
2. Capital Structure & Debt
Qnity Electronics, Inc.
- Extremely low debt levels (D/E 0.02) provide financial stability and flexibility.
MaxLinear, Inc.
- Higher leverage (D/E 0.29) and negative interest coverage signal elevated financial risk.
3. Stock Volatility
Qnity Electronics, Inc.
- Beta of 0 indicates minimal stock volatility, appealing for risk-averse investors.
MaxLinear, Inc.
- Beta of 1.71 shows high volatility, increasing risk in turbulent markets.
4. Regulatory & Legal
Qnity Electronics, Inc.
- Operating in semiconductor materials, Qnity faces standard tech sector regulations; no major current legal concerns.
MaxLinear, Inc.
- MaxLinear’s broad telecom applications expose it to stricter compliance and potential intellectual property disputes.
5. Supply Chain & Operations
Qnity Electronics, Inc.
- Focused supply chain on advanced materials may face disruptions but benefits from specialization.
MaxLinear, Inc.
- Diverse product lines require complex supply chains, increasing operational risk amid global shortages.
6. ESG & Climate Transition
Qnity Electronics, Inc.
- Limited data but semiconductor materials sector increasingly pressured on environmental footprint.
MaxLinear, Inc.
- Greater exposure to energy-intensive manufacturing raises ESG transition risks.
7. Geopolitical Exposure
Qnity Electronics, Inc.
- Based in Delaware with a U.S. focus, geopolitical risks are moderate but include trade tensions.
MaxLinear, Inc.
- Global telecom markets heighten exposure to geopolitical instability and trade policy shifts.
Which company shows a better risk-adjusted profile?
Qnity Electronics faces its most significant risk in competitive market dynamics post-rebranding but maintains a rock-solid balance sheet. MaxLinear’s severe profitability issues and high leverage constitute its largest risk. Qnity’s near-zero beta and favorable debt metrics create a safer risk-adjusted profile. MaxLinear’s negative margins and high volatility justify caution despite niche product strengths.
Final Verdict: Which stock to choose?
Qnity Electronics, Inc. leverages a robust cash generation engine with consistent free cash flow. Its cautious capital allocation maintains financial stability, yet modest returns on equity signal a point of vigilance. This stock suits portfolios targeting steady, moderate growth with a margin of safety.
MaxLinear, Inc. boasts a strategic moat anchored in high gross margins and significant R&D investment, aiming to capture future innovation-led growth. However, its current value destruction and volatile earnings profile suggest higher risk. It fits investors with appetite for turnaround plays and long-term growth potential.
If you prioritize disciplined capital efficiency and financial resilience, Qnity Electronics outshines due to stable cash flows and conservative leverage. However, if you seek aggressive growth from innovation with acceptance of elevated risk, MaxLinear offers superior upside potential despite its troubled profitability.
Disclaimer: Investment carries a risk of loss of initial capital. The past performance is not a reliable indicator of future results. Be sure to understand risks before making an investment decision.
Go Further
I encourage you to read the complete analyses of Qnity Electronics, Inc. and MaxLinear, Inc. to enhance your investment decisions: