Home > Comparison > Technology > ONTO vs MXL
The strategic rivalry between Onto Innovation Inc. and MaxLinear, Inc. defines the current trajectory of the semiconductor sector. Onto Innovation operates as a capital-intensive industrial leader in process control and metrology tools, while MaxLinear focuses on high-performance mixed-signal communication SoCs. This head-to-head pits manufacturing precision against integrated system innovation. This analysis seeks to identify which corporate model delivers superior risk-adjusted returns for a diversified technology portfolio.
Table of contents
Companies Overview
Onto Innovation and MaxLinear stand as pivotal players in the semiconductor industry, each shaping distinct niches.
Onto Innovation Inc.: Precision Process Control Leader
Onto Innovation dominates the semiconductor process control tools market, generating revenue through advanced inspection systems and process control software. Its 2026 strategy emphasizes enhancing yield management solutions and expanding device packaging and test facilities. The company’s products serve diverse applications, from silicon wafers to micro-electromechanical systems, underlining its critical role in semiconductor manufacturing precision.
MaxLinear, Inc.: Integrated Communications SoC Specialist
MaxLinear focuses on radiofrequency and mixed-signal SoCs for connected homes and infrastructure. Its revenue stems from highly integrated communication platforms, including broadband transceivers and data converters. In 2026, the company prioritizes advancing end-to-end communication solutions for wired and wireless networks, targeting applications in 4G/5G base stations and fiber-optic data transport, reflecting its core strength in high-performance analog integration.
Strategic Collision: Similarities & Divergences
Both companies operate in semiconductors but diverge sharply: Onto Innovation champions process control precision, while MaxLinear pursues integrated communication systems. Their primary battleground is technological innovation in semiconductor components, yet their business philosophies differ—Onto offers specialized inspection tools, whereas MaxLinear provides broad SoC platforms. These distinctions create unique investment profiles, with Onto focusing on manufacturing quality and MaxLinear on connectivity integration.
Income Statement Comparison
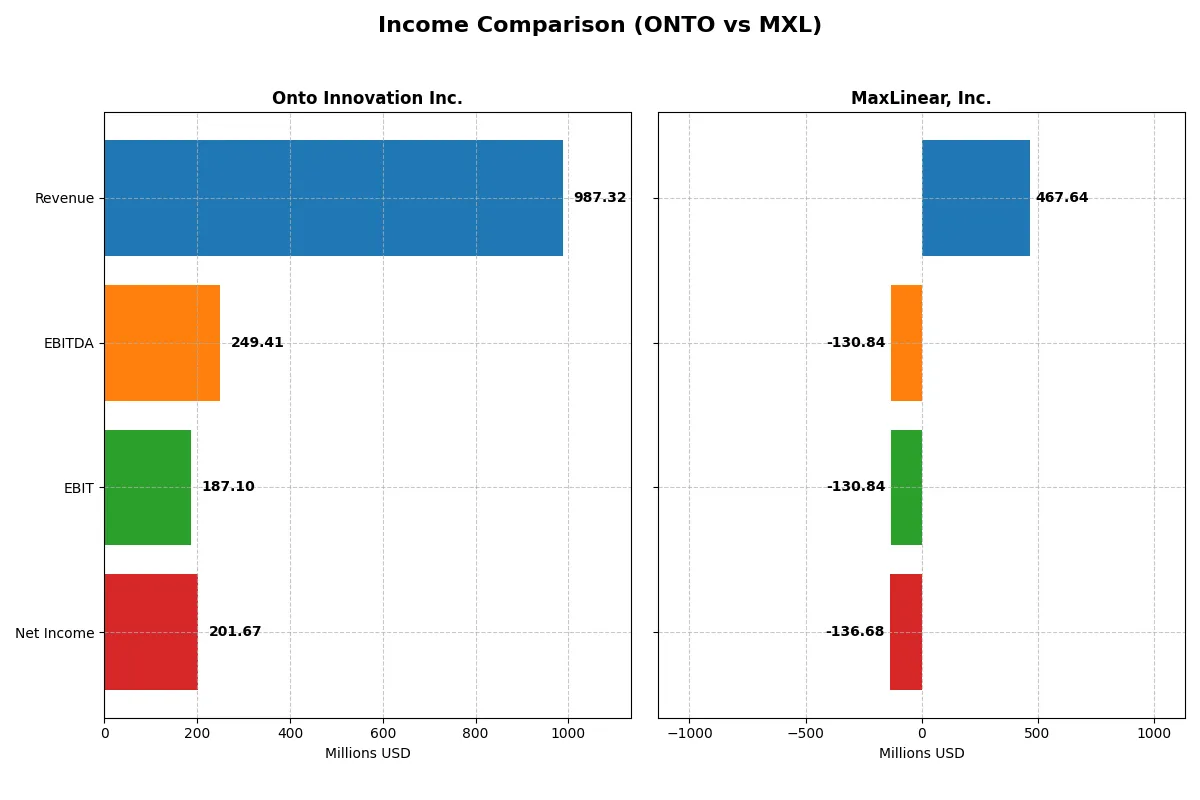
This data dissects the core profitability and scalability of both corporate engines to reveal who dominates the bottom line:
| Metric | Onto Innovation Inc. (ONTO) | MaxLinear, Inc. (MXL) |
|---|---|---|
| Revenue | 987M | 468M |
| Cost of Revenue | 472M | 202M |
| Operating Expenses | 328M | 393M |
| Gross Profit | 515M | 266M |
| EBITDA | 249M | -131M |
| EBIT | 187M | -131M |
| Interest Expense | 0 | 10M |
| Net Income | 202M | -137M |
| EPS | 4.09 | -1.58 |
| Fiscal Year | 2024 | 2025 |
Income Statement Analysis: The Bottom-Line Duel
The upcoming income statement comparison reveals which company converts sales into profit more efficiently, exposing the true strength of their business models.
Onto Innovation Inc. Analysis
Onto Innovation’s revenue grew from 556M in 2020 to 987M in 2024, with net income surging 550% over the period. Its gross margin holds steady above 52%, while net margin expanded to 20.4% in 2024. The latest year shows strong momentum with a 21% revenue rise and a 37.5% jump in net margin, signaling operational efficiency.
MaxLinear, Inc. Analysis
MaxLinear’s revenue peaked at 1.12B in 2022 but declined nearly 48% over five years, falling to 468M in 2025. Despite a healthy gross margin near 57%, the company suffers persistent net losses, with a negative net margin of -29% in 2025. While recent year-on-year growth is positive, the overall period shows deteriorating profitability and margin contraction.
Growth and Profitability Contrast
Onto Innovation dominates with consistent revenue and profit growth, maintaining solid margins and improving earnings power. MaxLinear, despite a strong gross margin, struggles with sustained net losses and shrinking scale. Onto’s profile appeals more to investors seeking reliable profit expansion and operational resilience.
Financial Ratios Comparison
These vital ratios act as a diagnostic tool to expose the underlying fiscal health, valuation premiums, and capital efficiency of the companies compared below:
| Ratios | Onto Innovation Inc. (ONTO) | MaxLinear, Inc. (MXL) |
|---|---|---|
| ROE | 10.47% | -47.49% |
| ROIC | 8.77% | -24.31% |
| P/E | 41.76 | -6.74 |
| P/B | 4.37 | 3.20 |
| Current Ratio | 8.69 | 1.77 |
| Quick Ratio | 7.00 | 1.28 |
| D/E | 0.008 | 0.29 |
| Debt-to-Assets | 0.72% | 17.23% |
| Interest Coverage | 0 | -15.52 |
| Asset Turnover | 0.47 | 0.42 |
| Fixed Asset Turnover | 7.16 | 4.65 |
| Payout ratio | 0 | 0 |
| Dividend yield | 0 | 0 |
| Fiscal Year | 2024 | 2024 |
Efficiency & Valuation Duel: The Vital Signs
Financial ratios serve as a company’s DNA, unveiling hidden risks and operational strengths beyond headline figures.
Onto Innovation Inc.
Onto Innovation shows solid profitability with a 10.47% ROE and a strong 20.43% net margin, reflecting operational efficiency. Its valuation appears stretched, with a high 41.76 P/E and 4.37 P/B, signaling growth expectations. The firm retains earnings for R&D rather than paying dividends, investing heavily in future innovation.
MaxLinear, Inc.
MaxLinear struggles with deeply negative profitability: a -47.49% ROE and a -68.01% net margin highlight ongoing losses. Despite this, its P/E is negative but flagged favorable due to the accounting of losses. MaxLinear maintains a conservative balance sheet with a 1.77 current ratio but generates no shareholder returns, focusing resources on aggressive R&D spending.
Premium Valuation vs. Operational Safety
Onto Innovation balances profitability and a premium valuation, suggesting risk from stretched multiples but operational strength. MaxLinear presents a riskier profile with negative returns and cash flow, despite lower leverage and a modest valuation. Onto suits investors prioritizing stability; MaxLinear fits those seeking high-risk growth opportunities.
Which one offers the Superior Shareholder Reward?
I observe Onto Innovation Inc. (ONTO) and MaxLinear, Inc. (MXL) both pay no dividends, focusing instead on reinvestment and buybacks. ONTO maintains a robust free cash flow of $4.33/share in 2024 and a very low debt ratio (~0.7%), enabling sustainable buybacks. MXL, by contrast, posts negative net margins and negative free cash flow (-$0.75/share), coupled with higher leverage (debt to assets ~17%). ONTO’s steady operating cash flow coverage ratio (16.2x) versus MXL’s negative cash flow signals stronger capital allocation capacity. MXL’s weaker balance sheet and cash flow restrict buyback scope, impairing shareholder reward. Given ONTO’s disciplined capital allocation and sustainable buyback potential, I conclude ONTO offers the more attractive total return profile for 2026 investors.
Comparative Score Analysis: The Strategic Profile
The radar chart reveals the fundamental DNA and trade-offs of Onto Innovation and MaxLinear, mapping their financial strengths and vulnerabilities:
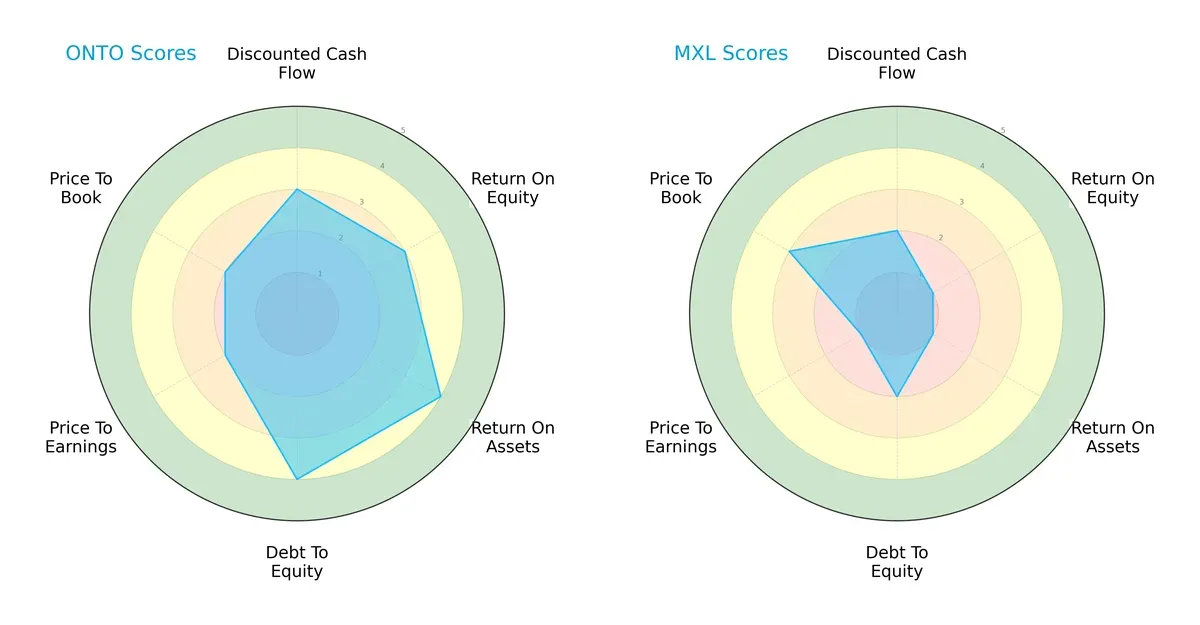
Onto Innovation demonstrates a more balanced profile with moderate scores in DCF, ROE, and valuation metrics, coupled with favorable asset utilization and low financial risk. MaxLinear relies heavily on a moderate price-to-book advantage but struggles with weak profitability and higher leverage. Onto’s diversified strengths better position it against sector cyclicality.
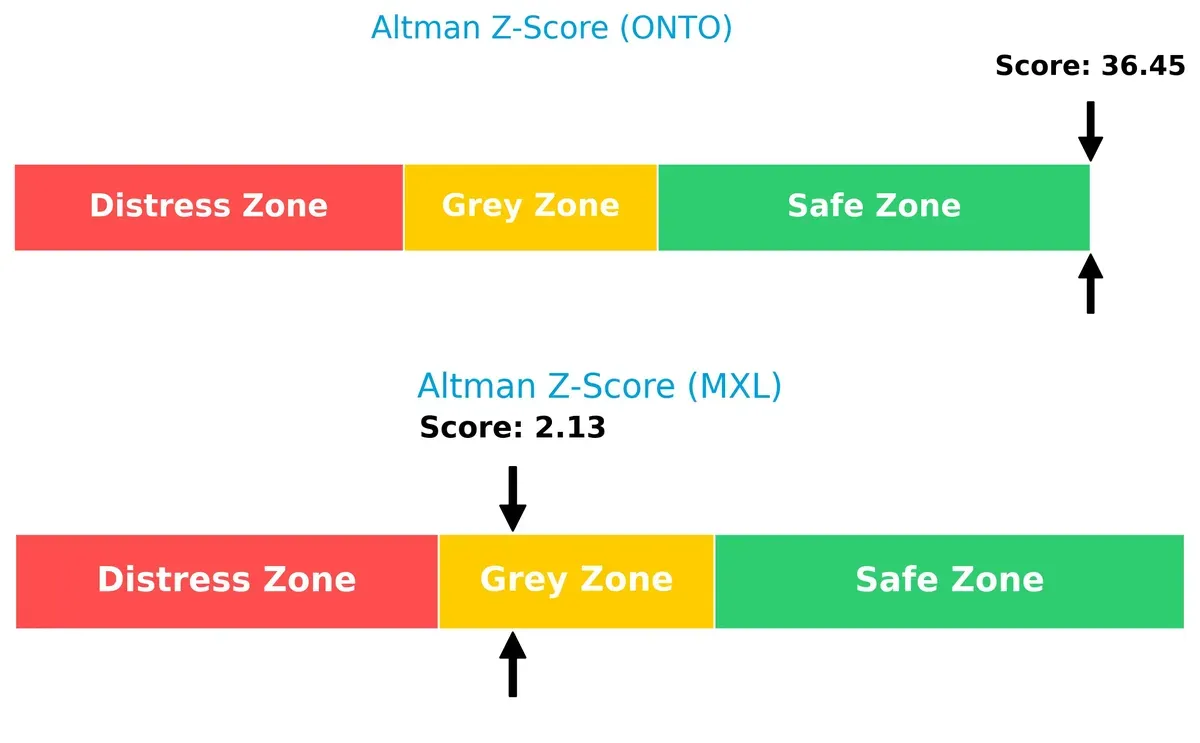
Bankruptcy Risk: Solvency Showdown
Onto Innovation’s Altman Z-Score of 36.45 places it firmly in the safe zone, signaling robust solvency. MaxLinear’s score of 2.13 lands it in the grey zone, indicating moderate bankruptcy risk. This gap highlights Onto’s superior financial resilience in the current economic cycle:
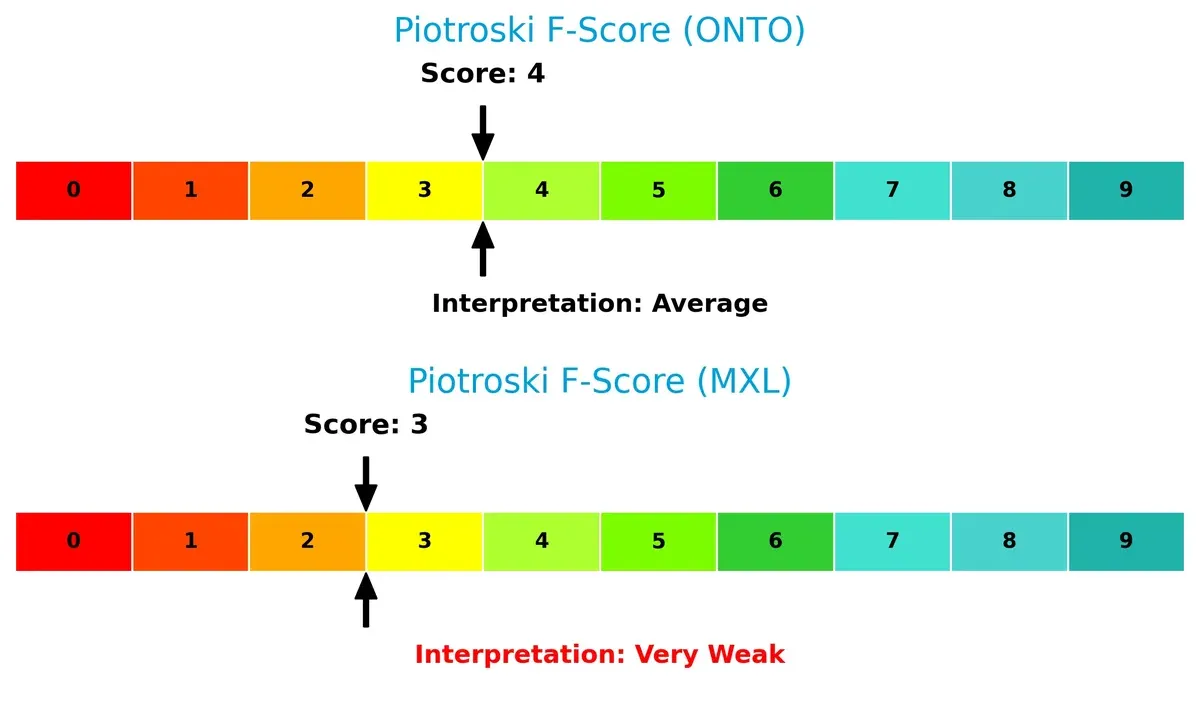
Financial Health: Quality of Operations
Onto Innovation’s Piotroski F-Score of 4 suggests average financial health but no immediate red flags. MaxLinear’s lower score of 3 raises caution about operational weaknesses and internal inefficiencies compared to Onto:
How are the two companies positioned?
This section dissects the operational DNA of Onto Innovation and MaxLinear by comparing their revenue distribution and internal strengths and weaknesses. The goal is to confront their economic moats and identify which model offers the most resilient competitive advantage today.
Revenue Segmentation: The Strategic Mix
The following visual comparison dissects how Onto Innovation Inc. and MaxLinear, Inc. diversify their income streams and where their primary sector bets lie:
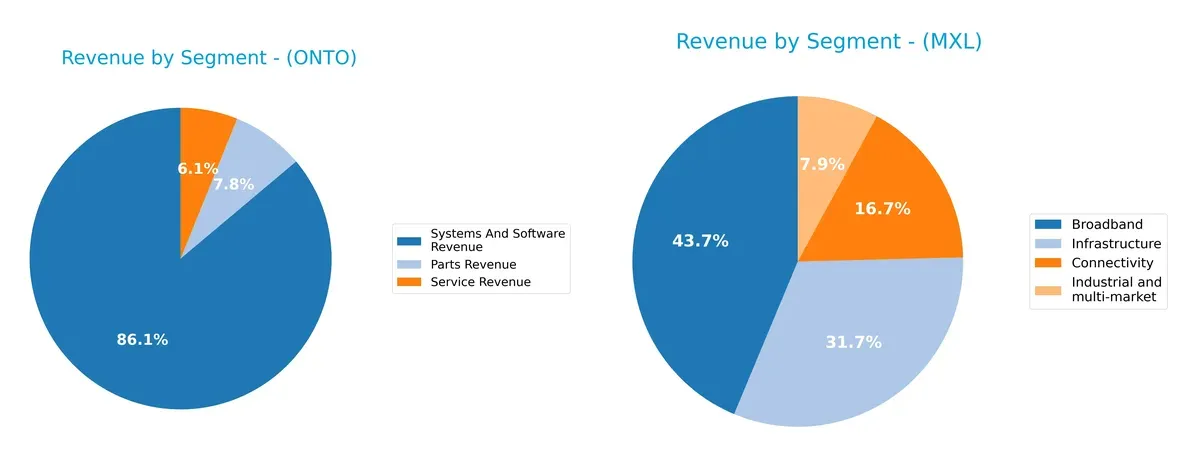
Onto Innovation anchors its revenue on Systems And Software, generating $850M in 2024, dwarfing Parts ($77M) and Service ($60M). This creates a tech-heavy focus with potential concentration risk. MaxLinear displays a more balanced mix, with Broadband ($117M), Infrastructure ($114M), Connectivity ($56M), and Industrial & Multi-market ($74M). MaxLinear’s diversification supports resilience, while Onto’s dominance in Systems reflects an ecosystem lock-in strategy.
Strengths and Weaknesses Comparison
This table compares the strengths and weaknesses of Onto Innovation Inc. and MaxLinear, Inc.:
ONTO Strengths
- High net margin of 20.43%
- Extremely low debt-to-equity at 0.01
- Strong quick ratio of 7.0 indicating liquidity
- Favorable fixed asset turnover at 7.16
- Diverse revenue streams across parts, services, and software
- Wide global presence including Korea, Taiwan, and the US
MXL Strengths
- Favorable PE ratio despite negative earnings
- Reasonable current ratio at 1.77 supports short-term obligations
- Moderate debt-to-equity of 0.29
- Favorable fixed asset turnover of 4.65
- Revenue diversification across broadband, connectivity, infrastructure
- Geographic sales primarily in Asia and US
ONTO Weaknesses
- WACC (10.8%) exceeds ROIC (8.77%), indicating value destruction
- High PE (41.76) and PB (4.37) ratios suggest overvaluation
- Unusually high current ratio at 8.69 may indicate inefficient asset use
- Asset turnover at 0.47 is low, pointing to underutilized assets
- No dividend yield limits income appeal
MXL Weaknesses
- Negative net margin (-68.01%) and ROE (-47.49%) reflect poor profitability
- Negative ROIC (-24.31%) and interest coverage (-13.01) signal financial distress
- PB ratio at 3.2 is unfavorable
- Asset turnover at 0.42 is weak, showing inefficient sales generation
- No dividend yield limits shareholder returns
Onto Innovation demonstrates robust profitability and liquidity but faces challenges with capital efficiency and valuation. MaxLinear struggles with profitability and financial health despite good liquidity and asset turnover, posing significant risks to its strategic positioning.
The Moat Duel: Analyzing Competitive Defensibility
A structural moat protects a company’s long-term profits from relentless competition erosion. Let’s dissect the economic moats of Onto Innovation and MaxLinear:
Onto Innovation Inc.: Intangible Assets and Process Expertise
Onto Innovation’s competitive advantage stems from proprietary process control technology and software. This moat shows in its stable 20%+ net margins and 65% EPS growth in 2024. Expanding into new semiconductor process nodes should deepen its defensibility in 2026.
MaxLinear, Inc.: Integrated System-on-Chip Solutions
MaxLinear relies on integration of RF and mixed-signal SoCs, differentiating it from Onto’s software-driven edge. However, MaxLinear’s negative EBIT and net margins reveal operational challenges. Growth in 5G infrastructure may offer a turnaround opportunity if profitability improves.
Moat Battle: Process Control Mastery vs. System Integration Challenges
Onto Innovation’s moat is wider and more durable, supported by strong margin expansion and consistent value creation. MaxLinear’s declining ROIC and profitability indicate a fragile moat. Onto is better positioned to defend and grow its market share in 2026.
Which stock offers better returns?
Over the past year, Onto Innovation Inc. showed a strong upward trajectory, while MaxLinear, Inc. experienced a modest decline, illustrating contrasting market dynamics.
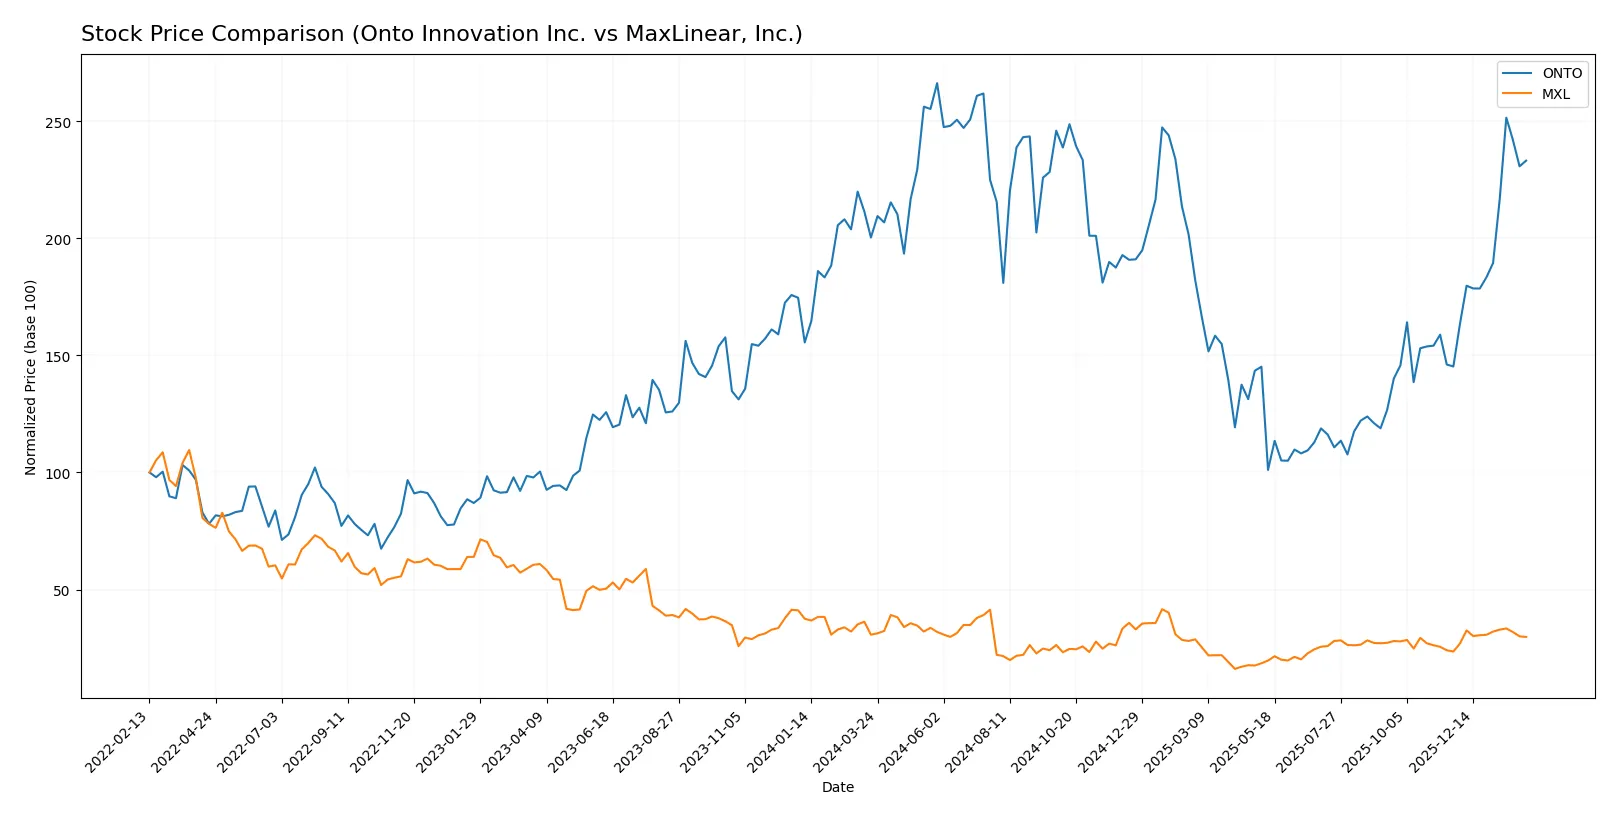
Trend Comparison
Onto Innovation Inc. posted a 16.39% gain over the past year, marking a bullish trend with accelerating momentum and a high volatility level (std dev 43.13). Its price ranged from 88.5 to 233.14.
MaxLinear, Inc. recorded a -3.11% decline, reflecting a bearish trend despite recent acceleration. Its volatility remained low (std dev 3.34), with prices between 9.31 and 24.05.
Comparing both, Onto Innovation delivered superior market performance, outperforming MaxLinear by a wide margin during the same period.
Target Prices
Analysts present a measured target consensus for both Onto Innovation Inc. and MaxLinear, Inc.
| Company | Target Low | Target High | Consensus |
|---|---|---|---|
| Onto Innovation Inc. | 160 | 260 | 191.67 |
| MaxLinear, Inc. | 15 | 25 | 21 |
Onto Innovation’s consensus target of $191.67 sits slightly below its current price of $203.34, indicating cautious optimism. MaxLinear’s consensus target of $21 exceeds its current $17.04, suggesting upside potential amid recent weakness.

Don’t Let Luck Decide Your Entry Point
Optimize your entry points with our advanced ProRealTime indicators. You’ll get efficient buy signals with precise price targets for maximum performance. Start outperforming now!
How do institutions grade them?
The following tables summarize recent institutional grades for Onto Innovation Inc. and MaxLinear, Inc.:
Onto Innovation Inc. Grades
This table shows recent grades and actions from leading financial institutions for Onto Innovation Inc.
| Grading Company | Action | New Grade | Date |
|---|---|---|---|
| Needham | Maintain | Buy | 2026-01-20 |
| B. Riley Securities | Maintain | Buy | 2026-01-15 |
| Stifel | Maintain | Hold | 2026-01-14 |
| Needham | Maintain | Buy | 2026-01-06 |
| Jefferies | Maintain | Buy | 2025-12-15 |
| Needham | Maintain | Buy | 2025-11-18 |
| B. Riley Securities | Maintain | Buy | 2025-11-18 |
| Evercore ISI Group | Maintain | Outperform | 2025-11-05 |
| Oppenheimer | Maintain | Outperform | 2025-10-14 |
| Stifel | Maintain | Hold | 2025-10-13 |
MaxLinear, Inc. Grades
Below are recent institutional grades and actions for MaxLinear, Inc.
| Grading Company | Action | New Grade | Date |
|---|---|---|---|
| Wells Fargo | Maintain | Equal Weight | 2026-01-30 |
| Benchmark | Maintain | Buy | 2026-01-16 |
| Benchmark | Maintain | Buy | 2025-10-24 |
| Benchmark | Maintain | Buy | 2025-10-17 |
| Benchmark | Maintain | Buy | 2025-09-02 |
| Loop Capital | Maintain | Hold | 2025-08-04 |
| Wells Fargo | Maintain | Equal Weight | 2025-07-24 |
| Benchmark | Maintain | Buy | 2025-07-24 |
| Susquehanna | Maintain | Neutral | 2025-07-24 |
| Susquehanna | Maintain | Neutral | 2025-07-22 |
Which company has the best grades?
Onto Innovation Inc. holds predominantly Buy and Outperform grades from multiple firms, showing stronger institutional confidence. MaxLinear, Inc. shows a mix of Buy and Equal Weight ratings, suggesting more cautious sentiment. Investors may view Onto Innovation’s higher grades as a sign of greater expected performance.
Risks specific to each company
The following categories identify critical pressure points and systemic threats facing Onto Innovation Inc. and MaxLinear, Inc. in the 2026 market environment:
1. Market & Competition
Onto Innovation Inc.
- Operates in advanced semiconductor process control, benefiting from high barriers and specialized tech.
MaxLinear, Inc.
- Focuses on RF and mixed-signal SoCs in competitive, fast-evolving communications markets.
2. Capital Structure & Debt
Onto Innovation Inc.
- Near-zero debt (D/E = 0.01) with strong interest coverage signals solid financial stability.
MaxLinear, Inc.
- Moderate debt (D/E = 0.29) but negative interest coverage raises concerns over debt servicing capacity.
3. Stock Volatility
Onto Innovation Inc.
- Beta 1.48 indicates moderate sensitivity to market swings, typical for tech sector.
MaxLinear, Inc.
- Higher beta at 1.71 suggests elevated stock price volatility and market risk.
4. Regulatory & Legal
Onto Innovation Inc.
- Semiconductor manufacturing tools face compliance demands but limited direct regulatory headwinds.
MaxLinear, Inc.
- Communications SoCs must navigate complex telecom regulations, adding legal risk complexity.
5. Supply Chain & Operations
Onto Innovation Inc.
- Relies on global supply chains for precision components; disruption could impact production.
MaxLinear, Inc.
- Exposure to semiconductor supply shortages and logistics risks in high-demand connectivity products.
6. ESG & Climate Transition
Onto Innovation Inc.
- Moderate ESG risk; product niche supports efficiency but manufacturing footprint demands scrutiny.
MaxLinear, Inc.
- Faces pressure to reduce emissions and energy use in chip production and product lifecycle.
7. Geopolitical Exposure
Onto Innovation Inc.
- US-based with global customers; vulnerable to trade tensions impacting semiconductor equipment exports.
MaxLinear, Inc.
- Also US-based but more exposed to international telecom infrastructure markets sensitive to geopolitical shifts.
Which company shows a better risk-adjusted profile?
Onto Innovation faces its biggest threat from a high weighted average cost of capital that outpaces ROIC, signaling capital allocation inefficiency. MaxLinear’s critical risk lies in severe profitability weakness and negative interest coverage, undermining financial health. Onto’s strong balance sheet and solid Altman Z-score position it with a better risk-adjusted profile despite valuation concerns. Recent data confirm MaxLinear’s distress-zone Z-score and negative returns, warranting caution.
Final Verdict: Which stock to choose?
Onto Innovation Inc. excels as a cash-generating powerhouse with a robust margin profile and accelerating profitability. Its looming challenge lies in a current ratio that signals excess liquidity, which could weigh on capital efficiency. Onto fits well in an Aggressive Growth portfolio aiming to capitalize on operational leverage and innovation momentum.
MaxLinear, Inc. leverages a strategic moat rooted in heavy R&D investment and a resilient gross margin, underpinning potential product breakthroughs. It offers a safer balance sheet relative to Onto but suffers from declining returns and negative free cash flow, positioning it better for a GARP portfolio focused on turnaround opportunities with controlled risk.
If you prioritize strong profitability and growth momentum, Onto Innovation outshines with its expanding income quality and improving ROIC trend despite value creation challenges. However, if you seek a risk-moderated venture in a tech-driven turnaround, MaxLinear offers better stability in liquidity and a moat built on R&D intensity, albeit with profitability headwinds. Each scenario demands careful risk calibration aligned with your investment horizon.
Disclaimer: Investment carries a risk of loss of initial capital. The past performance is not a reliable indicator of future results. Be sure to understand risks before making an investment decision.
Go Further
I encourage you to read the complete analyses of Onto Innovation Inc. and MaxLinear, Inc. to enhance your investment decisions: