Home > Comparison > Technology > ON vs MXL
The strategic rivalry between ON Semiconductor Corporation and MaxLinear, Inc. shapes the semiconductor industry’s evolution. ON Semiconductor operates as a capital-intensive leader in intelligent sensing and power solutions, while MaxLinear specializes in high-performance analog and mixed-signal communications SoCs. This head-to-head pits broad industrial scale against niche technological integration. This analysis will clarify which company’s trajectory offers superior risk-adjusted returns for a diversified portfolio in the dynamic tech sector.
Table of contents
Companies Overview
ON Semiconductor and MaxLinear stand as key players shaping semiconductor innovation in 2026.
ON Semiconductor Corporation: Powering Intelligent Electrification
ON Semiconductor dominates the power solutions market with intelligent sensing and power technologies. Its revenue stems from analog, discrete, and integrated semiconductor products enabling automotive electrification, fast-charging, and sustainable energy systems. The firm’s 2026 strategy centers on expanding its electrification footprint and advancing power conversion technologies across automotive and industrial sectors.
MaxLinear, Inc.: Integrating High-Performance Connectivity
MaxLinear leads in RF and mixed-signal SoCs for connected home and infrastructure markets. It generates revenue by delivering integrated communication chips supporting broadband modems, 4G/5G base stations, and data center networking. In 2026, MaxLinear focuses on enhancing end-to-end communication platforms and expanding its footprint in wireless and fiber-optic infrastructure applications.
Strategic Collision: Similarities & Divergences
Both companies operate in semiconductors but pursue distinct philosophies: ON Semiconductor emphasizes power efficiency and electrification, while MaxLinear prioritizes integrated communication solutions. Their primary battleground lies in the expanding IoT and infrastructure markets. ON offers a broad product mix aimed at sustainability, whereas MaxLinear targets niche connectivity technology, creating divergent risk and growth profiles for investors.
Income Statement Comparison
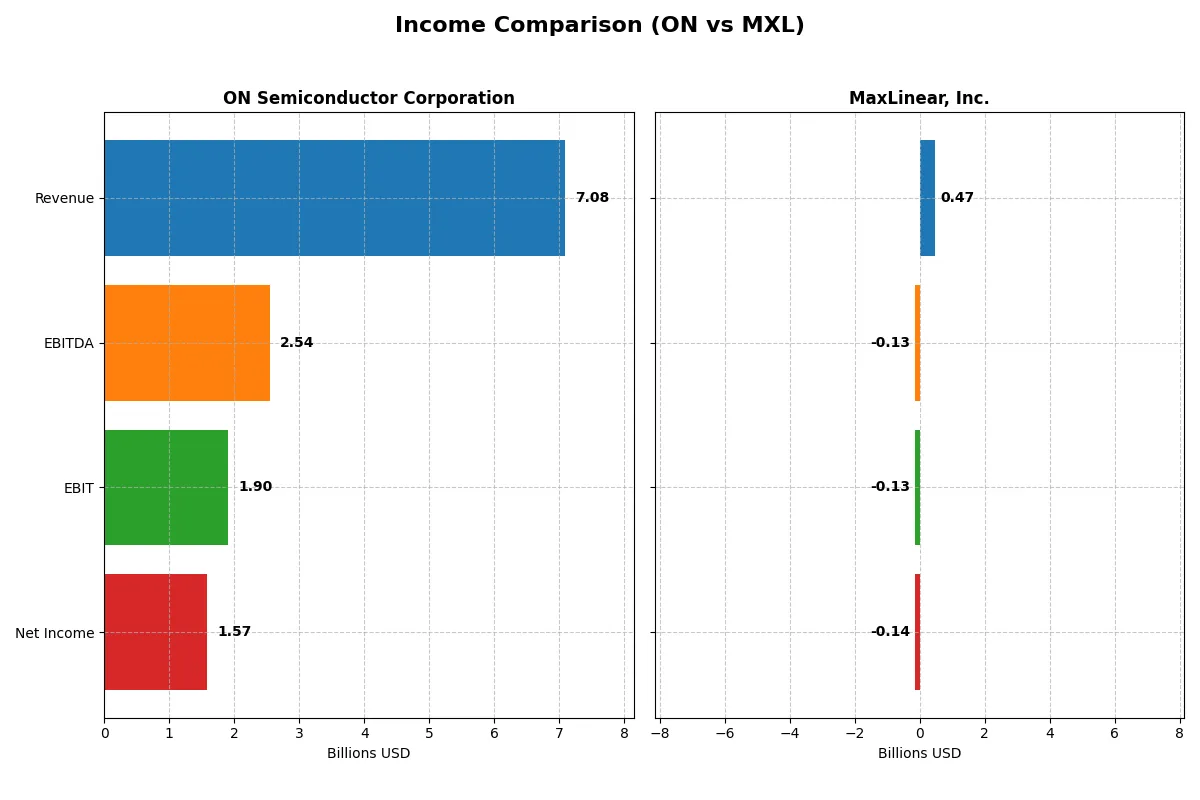
The following data dissects the core profitability and scalability of both corporate engines to reveal who dominates the bottom line:
| Metric | ON Semiconductor Corporation (ON) | MaxLinear, Inc. (MXL) |
|---|---|---|
| Revenue | 7.1B | 468M |
| Cost of Revenue | 3.9B | 202M |
| Operating Expenses | 1.4B | 393M |
| Gross Profit | 3.2B | 266M |
| EBITDA | 2.5B | -131M |
| EBIT | 1.9B | -131M |
| Interest Expense | 62M | 10M |
| Net Income | 1.6B | -137M |
| EPS | 3.68 | -1.58 |
| Fiscal Year | 2024 | 2025 |
Income Statement Analysis: The Bottom-Line Duel
This income statement comparison reveals which company runs a more efficient and profitable corporate engine through recent financial performance.
ON Semiconductor Corporation Analysis
ON Semiconductor’s revenue rose 35% from 2020 to 2024, peaking at $7.1B in 2024, despite a 14% dip in the last year. Its net income surged over 570% across five years but dropped 16% in 2024 to $1.57B. The company sustains strong margins with a 45.4% gross margin and a 22.2% net margin, demonstrating robust cost control and profitability amid challenging market conditions.
MaxLinear, Inc. Analysis
MaxLinear’s revenue declined nearly 48% from 2021 to 2025 but rebounded 30% last year to $468M. Despite this momentum, it recorded a net loss of $137M in 2025, improving from a $245M loss in 2024. The firm boasts a high 56.8% gross margin but struggles with a negative net margin of -29.2%, reflecting operational inefficiencies and persistent losses despite recent top-line growth.
Margin Strength vs. Revenue Scale
ON Semiconductor dominates with scale and strong, consistent profitability, delivering superior margins and positive net income growth over time. MaxLinear shows encouraging revenue recovery but remains unprofitable with negative net margins. For investors prioritizing profitability and sustainable margins, ON’s profile offers a more compelling foundation in 2026.
Financial Ratios Comparison
These vital ratios act as a diagnostic tool to expose the underlying fiscal health, valuation premiums, and capital efficiency of the companies analyzed:
| Ratios | ON Semiconductor Corporation (ON) | MaxLinear, Inc. (MXL) |
|---|---|---|
| ROE | 17.9% | -47.5% |
| ROIC | 11.9% | -24.3% |
| P/E | 17.1 | -6.7 |
| P/B | 3.06 | 3.20 |
| Current Ratio | 5.06 | 1.77 |
| Quick Ratio | 3.38 | 1.28 |
| D/E (Debt-to-Equity) | 0.38 | 0.29 |
| Debt-to-Assets | 23.9% | 17.2% |
| Interest Coverage | 28.4 | -15.5 |
| Asset Turnover | 0.50 | 0.42 |
| Fixed Asset Turnover | 1.61 | 4.65 |
| Payout Ratio | 0% | 0% |
| Dividend Yield | 0% | 0% |
| Fiscal Year | 2024 | 2024 |
Efficiency & Valuation Duel: The Vital Signs
Financial ratios serve as a company’s DNA, uncovering hidden risks and operational strengths that raw numbers alone cannot reveal.
ON Semiconductor Corporation
ON Semiconductor posts a robust 17.9% ROE and a strong 22.2% net margin, signaling efficient profitability. Its P/E ratio at 17.1 signals a fairly valued stock, neither stretched nor cheap. ON retains earnings for growth and R&D, foregoing dividends, which supports long-term innovation and shareholder value.
MaxLinear, Inc.
MaxLinear suffers from a deeply negative ROE of -47.5% and a -68.0% net margin, indicating operational inefficiency. The negative P/E ratio reflects losses, though its P/B of 3.2 suggests a relatively high valuation. The company invests heavily in R&D, but its lack of profitability and poor cash flow raise concerns.
Operational Efficiency vs. Profitability Struggles
ON Semiconductor offers a balanced profile with solid returns and sensible valuation, while MaxLinear grapples with heavy losses and weak profitability metrics. Investors favoring operational stability and moderate risk will find ON’s profile more suitable, whereas MaxLinear presents a high-risk growth scenario.
Which one offers the Superior Shareholder Reward?
ON Semiconductor and MaxLinear both forgo dividends, focusing on reinvestment and buybacks. ON boasts robust free cash flow with a 0 payout ratio, funding steady buybacks. MaxLinear struggles with negative margins and free cash flow, limiting buybacks. ON’s efficient capital allocation and consistent cash generation offer a more sustainable, attractive total return profile for 2026 investors.
Comparative Score Analysis: The Strategic Profile
The radar chart reveals the fundamental DNA and trade-offs of ON Semiconductor and MaxLinear, exposing their core strengths and vulnerabilities:
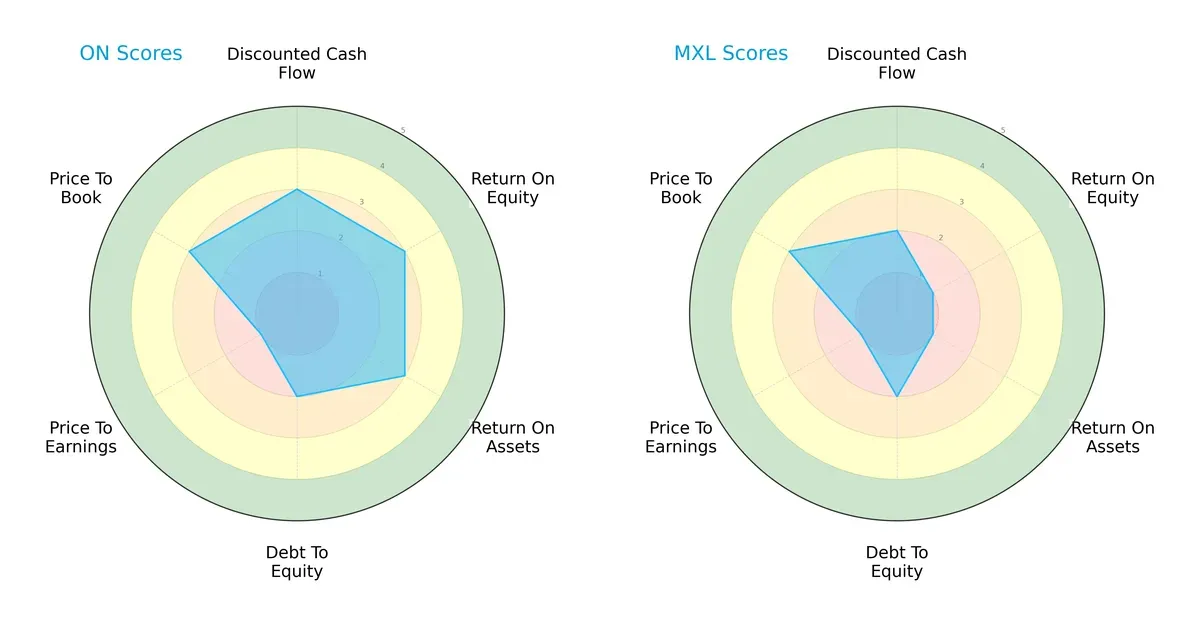
ON Semiconductor shows a more balanced profile, scoring moderately across DCF, ROE, ROA, and Price-to-Book metrics. MaxLinear relies heavily on its moderate debt-to-equity and price-to-book scores but lags significantly on profitability metrics. ON’s stronger return measures indicate operational efficiency, while MaxLinear’s weaker ROE and ROA highlight challenges in asset utilization.
Bankruptcy Risk: Solvency Showdown
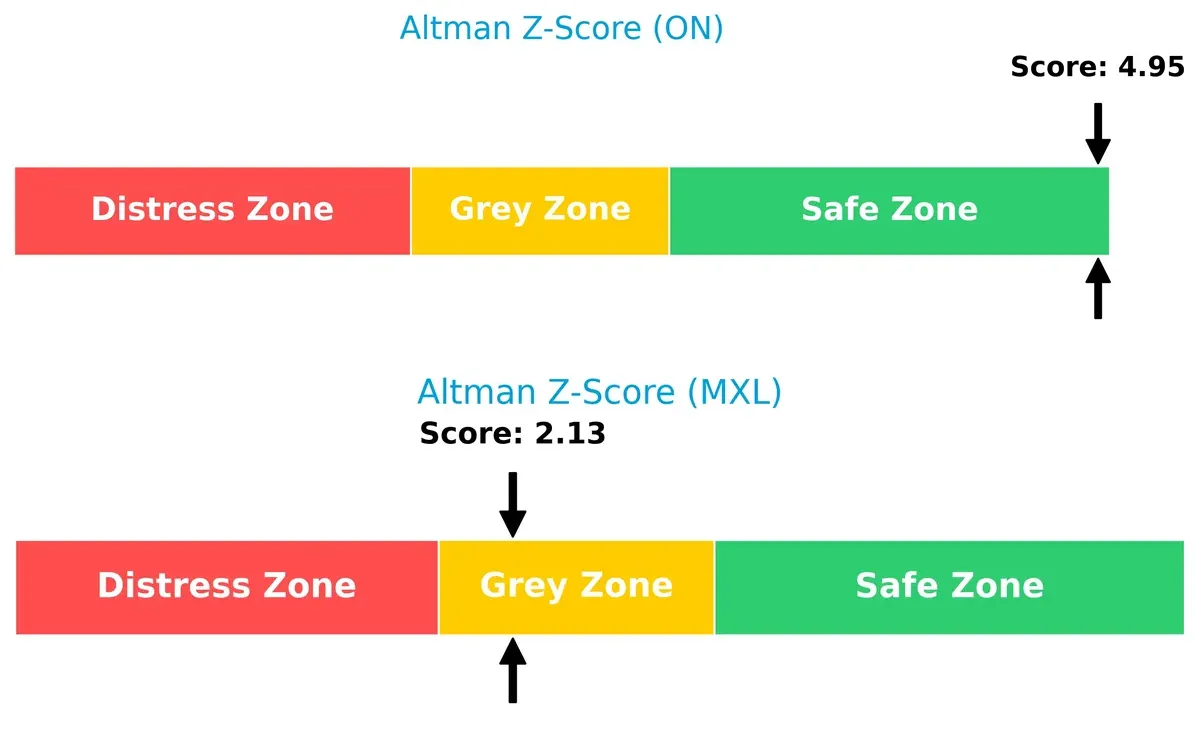
ON Semiconductor’s Altman Z-Score of 4.95 firmly places it in the safe zone, signaling strong solvency and low bankruptcy risk. MaxLinear’s 2.13 score lands in the grey zone, indicating moderate financial distress risk in this economic cycle:
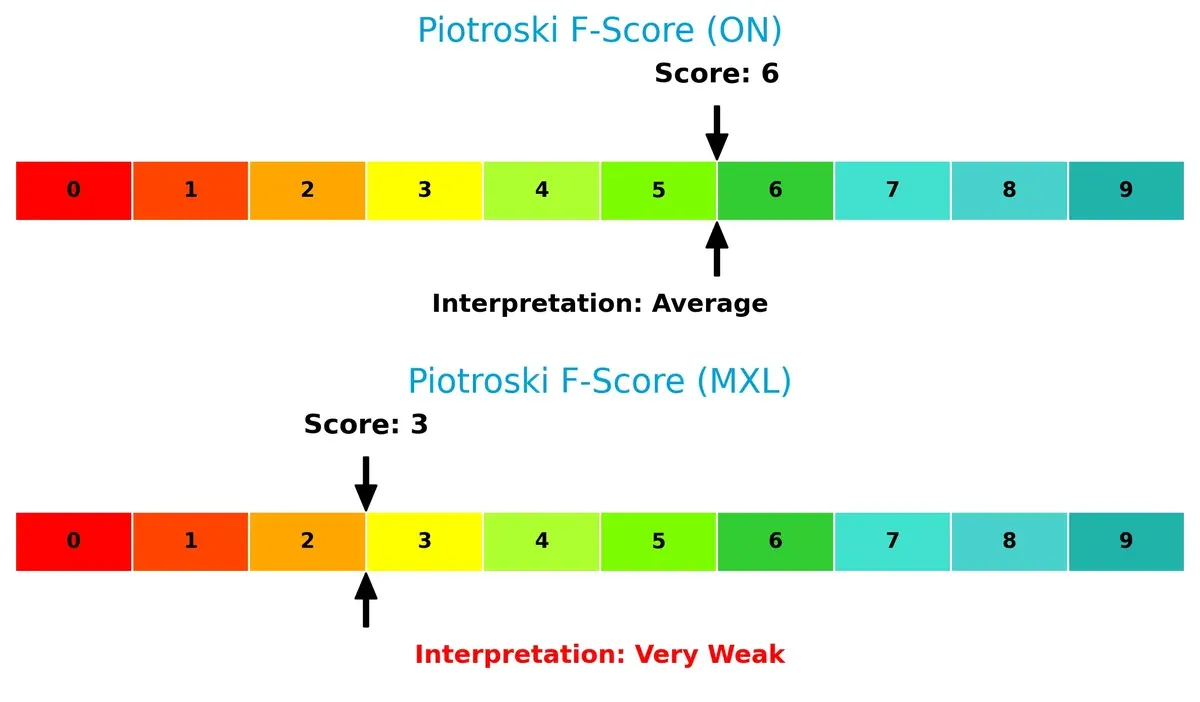
Financial Health: Quality of Operations
ON Semiconductor’s Piotroski F-Score of 6 reflects average financial health, suggesting consistent operational quality without major red flags. MaxLinear’s weak score of 3 signals internal weaknesses and potential distress compared to ON:
How are the two companies positioned?
This section dissects ON and MXL’s operational DNA by comparing their revenue distribution and internal dynamics. The goal is to confront their economic moats and reveal which model delivers the most resilient, sustainable competitive advantage today.
Revenue Segmentation: The Strategic Mix
This comparison dissects how ON Semiconductor and MaxLinear diversify their income streams and where their primary sector bets lie:
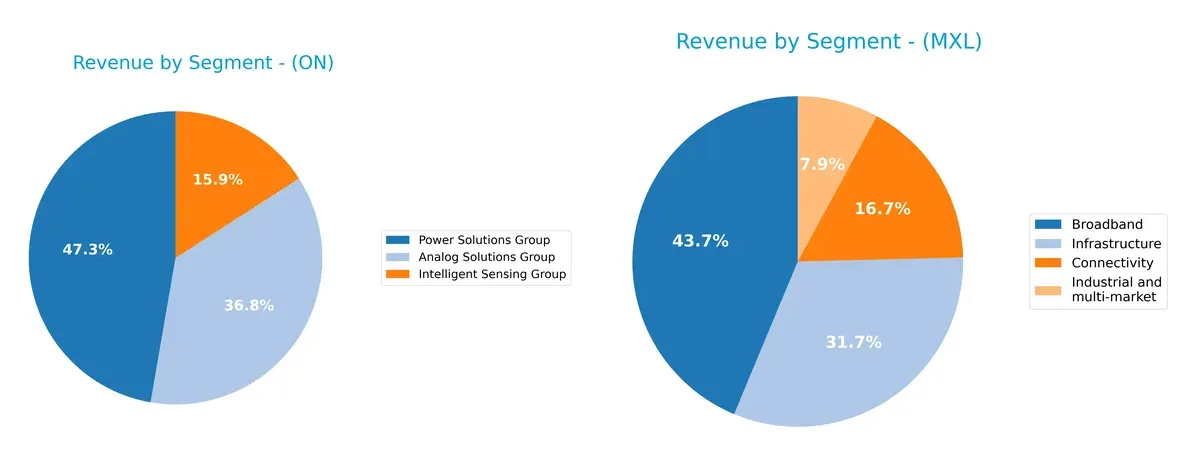
ON Semiconductor anchors its revenue in Power Solutions ($3.35B) and Analog Solutions ($2.61B), showing moderate diversification with a strong infrastructure and industrial focus. MaxLinear’s Broadband segment dominates ($204M), but it also spreads revenue across Connectivity, Industrial, and Infrastructure, reflecting a balanced approach. ON’s heavy reliance on power electronics signals potential concentration risk, while MaxLinear’s mix suggests strategic flexibility in multi-market connectivity.
Strengths and Weaknesses Comparison
This table compares the strengths and weaknesses of ON Semiconductor Corporation and MaxLinear, Inc.:
ON Strengths
- Diverse product groups with over 6B USD revenue in three main segments
- Strong profitability metrics: net margin 22%, ROE 18%, ROIC 12%
- Favorable debt management and interest coverage
- High current and quick ratios indicate liquidity
- Significant global presence including Hong Kong, Singapore, UK, US
MXL Strengths
- Multiple product segments with growing revenues in Broadband and Connectivity
- Favorable liquidity ratios: current ratio 1.77, quick ratio 1.28
- Low debt-to-equity and debt-to-assets ratios
- High fixed asset turnover 4.65 indicates efficient use of fixed assets
ON Weaknesses
- Unfavorable WACC and price-to-book ratio
- Overly high current ratio of 5.06 may indicate inefficient asset use
- No dividend yield
- Neutral asset turnover metrics
- Slightly unfavorable global ratios opinion
MXL Weaknesses
- Poor profitability: negative net margin (-68%), ROE (-47%), ROIC (-24%)
- Negative interest coverage ratio (-13) signals financial distress
- Price-to-book ratio elevated at 3.2
- No dividend yield
- Overall unfavorable global ratios opinion
ON demonstrates robust profitability and diversified revenue streams but shows some inefficiencies in asset utilization and valuation metrics. MXL struggles with profitability and interest coverage despite operational efficiency in fixed assets and sound liquidity, signaling potential financial risks.
The Moat Duel: Analyzing Competitive Defensibility
A structural moat is the only protection long-term profits have against relentless competitive erosion:
ON Semiconductor Corporation: Expanding Power Solutions Moat
I see ON Semiconductor’s primary moat in its cost advantage and broad product portfolio. Its 26.8% EBIT margin signals operational efficiency. Growth in electric vehicle markets in 2026 could deepen this advantage.
MaxLinear, Inc.: Specialized Communications SoC Moat
MaxLinear’s moat lies in its niche RF and mixed-signal SoCs, differing from ON’s scale focus. Despite a 56.8% gross margin, declining ROIC indicates eroding profitability. New infrastructure demands offer growth potential but also heightened competition.
Cost Leadership vs. Niche Specialization: Evaluating Moat Depth
ON Semiconductor shows a wider moat with improving ROIC and stable margins. MaxLinear’s shrinking returns reveal a fragile competitive position. ON is better equipped to defend and grow its market share in 2026.
Which stock offers better returns?
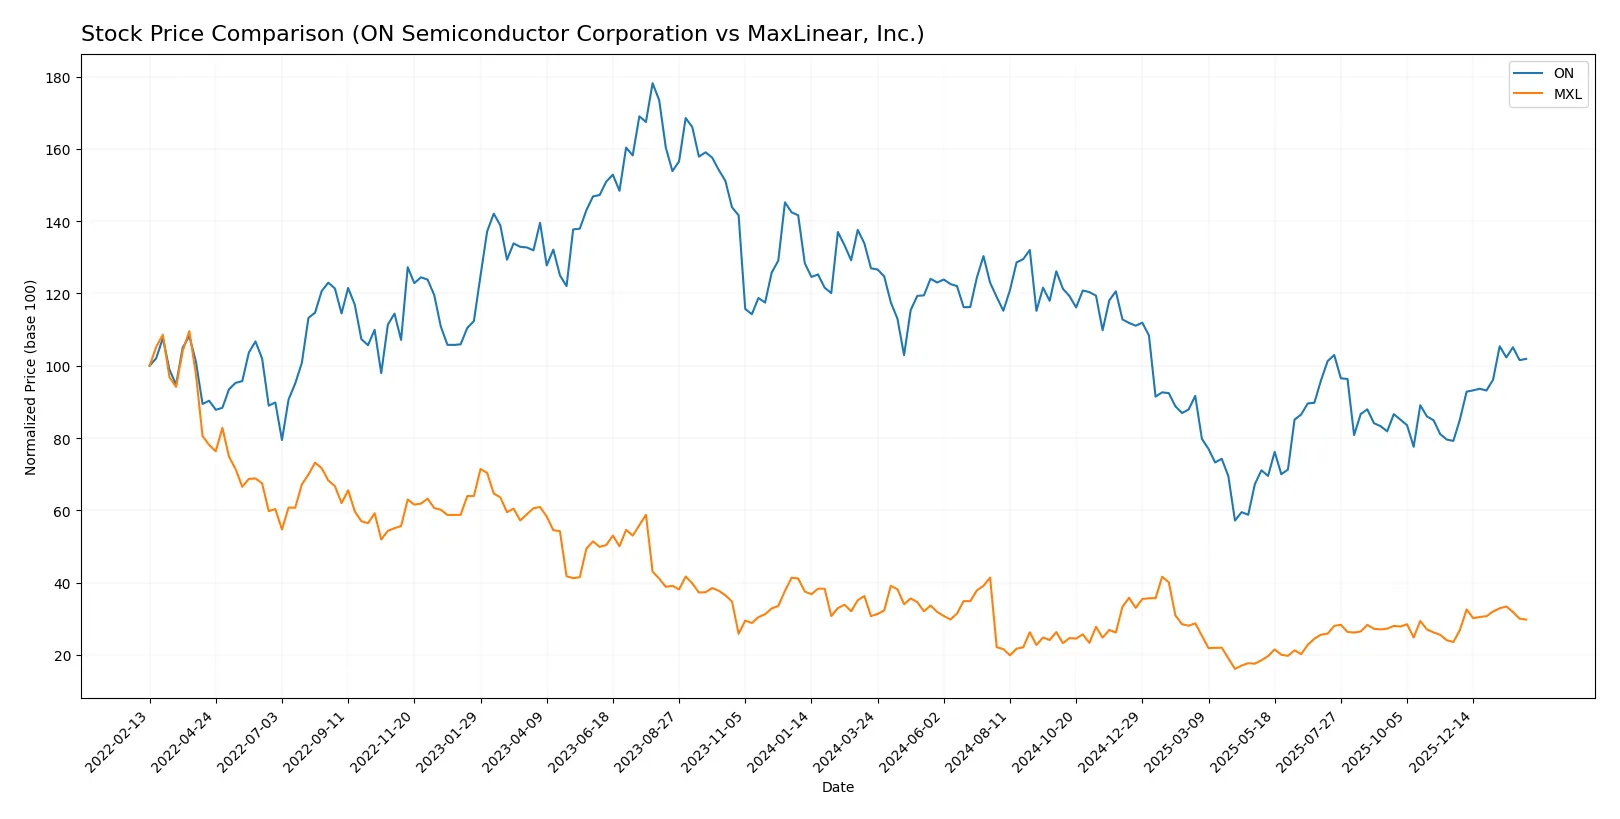
Over the past 12 months, both ON Semiconductor Corporation and MaxLinear, Inc. experienced bearish trends with accelerating price declines, followed by strong recent rallies since November 2025.
Trend Comparison
ON Semiconductor’s stock fell 19.74% over the past year, marking a bearish trend with accelerating losses and high volatility, hitting a low of 33.7 before a recent 28.67% rebound.
MaxLinear’s stock declined 3.11% over the same period, also bearish but with lower volatility and an accelerating downtrend, recently recovering 26.45% in a milder upward slope.
Comparing trends, ON recorded the largest negative return but stronger recent gains, while MaxLinear showed less severe losses and steadier recovery, delivering the highest overall market performance.
Target Prices
Analysts present a mixed but generally positive target consensus for ON Semiconductor and MaxLinear.
| Company | Target Low | Target High | Consensus |
|---|---|---|---|
| ON Semiconductor Corporation | 51 | 64 | 59.25 |
| MaxLinear, Inc. | 15 | 25 | 21 |
ON Semiconductor’s target consensus of 59.25 is slightly below its current price of 60.16, suggesting moderate upside risk. MaxLinear’s consensus of 21 indicates potential for a 22% gain from its 17.20 price, reflecting analyst optimism in this smaller-cap semiconductor.

Don’t Let Luck Decide Your Entry Point
Optimize your entry points with our advanced ProRealTime indicators. You’ll get efficient buy signals with precise price targets for maximum performance. Start outperforming now!
How do institutions grade them?
ON Semiconductor Corporation Grades
The following table summarizes recent grades from reputable grading companies on ON Semiconductor Corporation:
| Grading Company | Action | New Grade | Date |
|---|---|---|---|
| B of A Securities | Maintain | Neutral | 2026-01-21 |
| B. Riley Securities | Maintain | Neutral | 2026-01-20 |
| Stifel | Maintain | Hold | 2026-01-16 |
| Citigroup | Maintain | Neutral | 2026-01-15 |
| Wells Fargo | Maintain | Overweight | 2026-01-15 |
| Piper Sandler | Maintain | Overweight | 2026-01-07 |
| Truist Securities | Maintain | Hold | 2025-12-19 |
| Morgan Stanley | Maintain | Equal Weight | 2025-11-24 |
| Truist Securities | Maintain | Hold | 2025-11-04 |
| Morgan Stanley | Maintain | Equal Weight | 2025-11-04 |
MaxLinear, Inc. Grades
This table displays recent grades from credible grading companies on MaxLinear, Inc.:
| Grading Company | Action | New Grade | Date |
|---|---|---|---|
| Wells Fargo | Maintain | Equal Weight | 2026-01-30 |
| Benchmark | Maintain | Buy | 2026-01-16 |
| Benchmark | Maintain | Buy | 2025-10-24 |
| Benchmark | Maintain | Buy | 2025-10-17 |
| Benchmark | Maintain | Buy | 2025-09-02 |
| Loop Capital | Maintain | Hold | 2025-08-04 |
| Wells Fargo | Maintain | Equal Weight | 2025-07-24 |
| Benchmark | Maintain | Buy | 2025-07-24 |
| Susquehanna | Maintain | Neutral | 2025-07-24 |
| Susquehanna | Maintain | Neutral | 2025-07-22 |
Which company has the best grades?
MaxLinear, Inc. consistently earns “Buy” ratings from Benchmark, signaling stronger institutional confidence. ON Semiconductor mainly receives “Neutral” to “Hold” grades, with some “Overweight” from Wells Fargo and Piper Sandler. This divergence may influence investors seeking growth versus stability.
Risks specific to each company
The following categories identify the critical pressure points and systemic threats facing both firms in the 2026 market environment:
1. Market & Competition
ON Semiconductor Corporation
- Large market cap supports competitive resilience but faces intense semiconductor rivalry.
MaxLinear, Inc.
- Smaller market cap limits scale; niche RF and mixed-signal focus faces aggressive competition.
2. Capital Structure & Debt
ON Semiconductor Corporation
- Moderate debt-to-assets at 23.9% with strong interest coverage of 30.5x signals financial stability.
MaxLinear, Inc.
- Lower debt-to-assets at 17.2% but negative interest coverage (-13x) raises refinancing and solvency concerns.
3. Stock Volatility
ON Semiconductor Corporation
- Beta of 1.54 indicates above-market volatility but manageable for a tech leader.
MaxLinear, Inc.
- Higher beta of 1.71 suggests greater stock price swings, increasing investment risk.
4. Regulatory & Legal
ON Semiconductor Corporation
- Operates globally with typical semiconductor regulatory compliance risks.
MaxLinear, Inc.
- Similar global semiconductor exposure; additional risks from communications and data infrastructure regulations.
5. Supply Chain & Operations
ON Semiconductor Corporation
- Larger scale and diversified segments reduce supply chain disruption risks.
MaxLinear, Inc.
- Smaller scale and dependency on specific communication platforms increase operational vulnerability.
6. ESG & Climate Transition
ON Semiconductor Corporation
- Focus on electrification and sustainable energy aligns with strong ESG positioning.
MaxLinear, Inc.
- Less clear ESG leadership; potentially lagging in climate transition initiatives.
7. Geopolitical Exposure
ON Semiconductor Corporation
- US-based but with global operations exposes it to trade tensions and export controls risks.
MaxLinear, Inc.
- Also US-headquartered with global sales; similar geopolitical trade risks but smaller footprint may limit impact.
Which company shows a better risk-adjusted profile?
ON Semiconductor’s strongest risk is market competition but is mitigated by its scale and diversified product lines. MaxLinear struggles most with capital structure risks, notably negative interest coverage and weak profitability. ON’s Altman Z-score of 4.95 places it in a safe zone, while MaxLinear’s 2.13 score signals moderate financial distress. ON’s larger scale and stronger balance sheet deliver a superior risk-adjusted profile. The recent negative interest coverage for MaxLinear highlights urgent financial stress, reinforcing my concern about its solvency risk in 2026.
Final Verdict: Which stock to choose?
ON Semiconductor’s superpower lies in its steadily improving profitability and efficient use of capital. Its growing ROIC signals emerging competitive strength. A point of vigilance is its stretched current ratio, which may indicate excess liquidity tied up inefficiently. It suits investors targeting aggressive growth with a tolerance for operational shifts.
MaxLinear’s strategic moat is its strong focus on niche R&D-driven innovation, aiming to build future product leadership. It offers a comparatively safer balance sheet and healthier liquidity than ON but struggles with persistent profitability challenges. This profile aligns better with investors seeking GARP strategies, balancing growth hopes with risk control.
If you prioritize emerging value creation and operational momentum, ON Semiconductor outshines with its improving returns and scale. However, if you seek a steadier risk profile in a specialized tech niche, MaxLinear offers better stability despite its current earnings drag. Each presents an analytical scenario tailored to distinct investor risk appetites and strategic goals.
Disclaimer: Investment carries a risk of loss of initial capital. The past performance is not a reliable indicator of future results. Be sure to understand risks before making an investment decision.
Go Further
I encourage you to read the complete analyses of ON Semiconductor Corporation and MaxLinear, Inc. to enhance your investment decisions: