Home > Comparison > Technology > NXPI vs MXL
The strategic rivalry between NXP Semiconductors N.V. and MaxLinear, Inc. shapes the semiconductor sector’s innovation frontier. NXP operates as a global technology powerhouse specializing in diverse microcontrollers and wireless solutions. MaxLinear contrasts as a focused innovator in high-performance analog and mixed-signal SoCs for communication infrastructure. This analysis pits scale against specialization to identify which trajectory delivers superior risk-adjusted returns for a diversified portfolio in 2026.
Table of contents
Companies Overview
NXP Semiconductors and MaxLinear stand as pivotal players shaping the semiconductor industry’s evolving landscape.
NXP Semiconductors N.V.: Global Semiconductor Leader
NXP Semiconductors dominates in automotive and IoT semiconductor solutions. It generates revenue through diverse products like microcontrollers, application processors, wireless connectivity, and sensors. In 2026, NXP strategically focused on expanding its footprint across automotive, industrial, and communication infrastructure markets. Its broad product portfolio and global reach underpin its competitive advantage.
MaxLinear, Inc.: High-Performance Communications SoC Specialist
MaxLinear excels in RF and mixed-signal system-on-chip solutions for wired and wireless communications. It earns revenue by integrating high-speed communication components like broadband transceivers, modems, and power management into end-to-end platforms. The company’s 2026 strategy emphasized innovation in 4G/5G infrastructure and home networking, serving OEMs and distributors with specialized communication technology.
Strategic Collision: Similarities & Divergences
Both companies operate in semiconductors but diverge in their business philosophy: NXP pursues a broad, diversified product ecosystem, while MaxLinear targets niche, high-performance SoC solutions. Their primary battleground lies in communication infrastructure and IoT connectivity. NXP’s scale and product diversity contrast with MaxLinear’s focused specialization, defining distinct risk-reward profiles for investors.
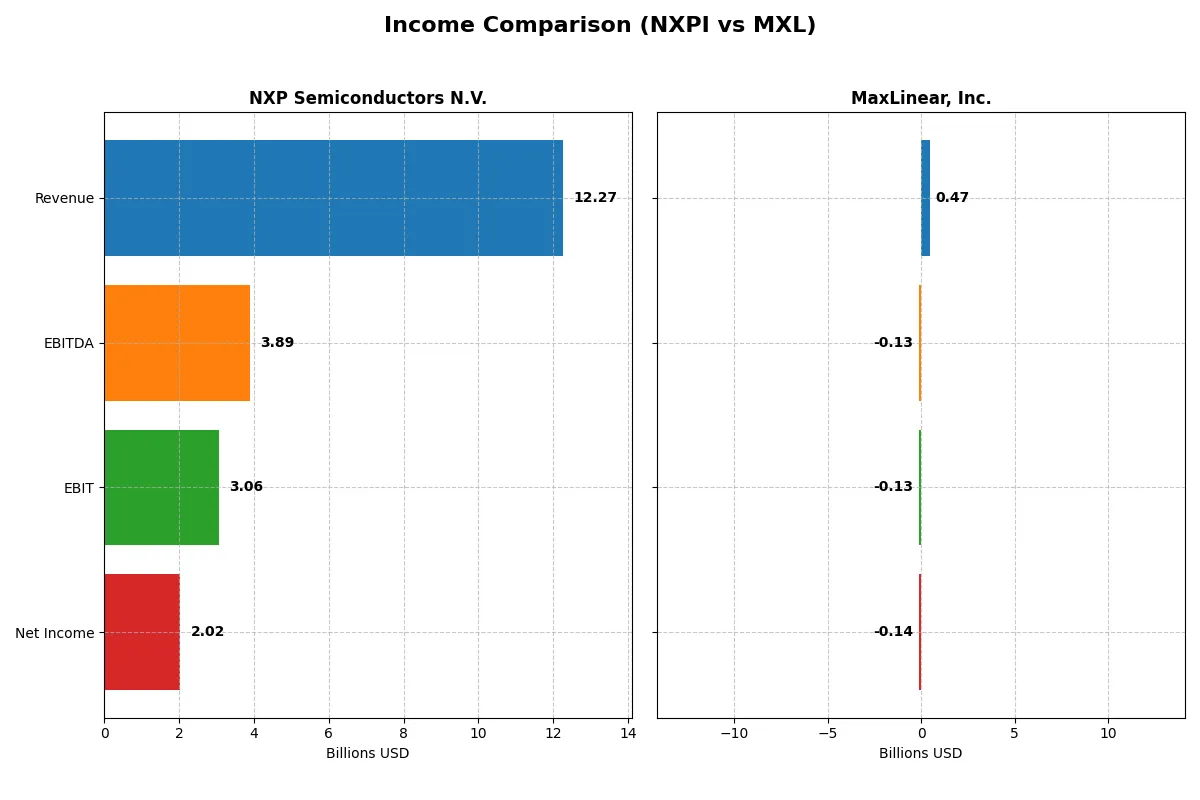
Income Statement Comparison
This data dissects the core profitability and scalability of both corporate engines to reveal who dominates the bottom line:
| Metric | NXP Semiconductors N.V. (NXPI) | MaxLinear, Inc. (MXL) |
|---|---|---|
| Revenue | 12.3B | 468M |
| Cost of Revenue | 5.59B | 202M |
| Operating Expenses | 3.37B | 393M |
| Gross Profit | 6.68B | 266M |
| EBITDA | 3.89B | -131M |
| EBIT | 3.06B | -131M |
| Interest Expense | 384M | 10.1M |
| Net Income | 2.02B | -137M |
| EPS | 8.00 | -1.58 |
| Fiscal Year | 2025 | 2025 |
Income Statement Analysis: The Bottom-Line Duel
The income statement comparison will expose which company operates its business more efficiently and generates stronger bottom-line results.
NXP Semiconductors N.V. Analysis
NXP’s revenue dipped slightly to 12.3B in 2025 from 12.6B in 2024, with net income falling to 2B from 2.51B. Gross and net margins remain robust at 54.4% and 16.5%, respectively. Despite a 2.7% revenue decline, NXP sustains solid profitability, reflecting operational discipline and a favorable capital structure.
MaxLinear, Inc. Analysis
MaxLinear’s 2025 revenue surged 29.7% to 468M, and gross profit expanded 38.2% to 266M. However, it posted a net loss of 137M, though improved from a 245M loss in 2024. Margins remain challenged, with a negative EBIT margin of -28% and net margin at -29%. The company shows improving momentum but struggles to convert growth into profits.
Margin Strength vs. Revenue Momentum
NXP leads in scale and margin strength, delivering consistent profitability despite a recent revenue dip. MaxLinear demonstrates impressive top-line growth and margin improvement but remains unprofitable. For investors, NXP’s stable earnings and efficient cost management present a fundamentally stronger profile compared to MaxLinear’s high-growth yet loss-making trajectory.
Financial Ratios Comparison
These vital ratios act as a diagnostic tool to expose the underlying fiscal health, valuation premiums, and capital efficiency for NXP Semiconductors N.V. (NXPI) and MaxLinear, Inc. (MXL):
| Ratios | NXP Semiconductors N.V. (NXPI) | MaxLinear, Inc. (MXL) |
|---|---|---|
| ROE | 27.33% | -47.49% |
| ROIC | 12.91% | -24.31% |
| P/E | 21.13 | Negative (Loss) |
| P/B | 5.78 | 3.20 |
| Current Ratio | 2.36 | 1.77 |
| Quick Ratio | 1.60 | 1.28 |
| D/E | 1.18 | 0.29 |
| Debt-to-Assets | 44.51% | 17.23% |
| Interest Coverage | 8.59 | Negative (Loss) |
| Asset Turnover | 0.52 | 0.42 |
| Fixed Asset Turnover | 3.86 | 4.65 |
| Payout Ratio | 41.35% | 0% |
| Dividend Yield | 1.96% | 0% |
| Fiscal Year | 2024 | 2024 |
Efficiency & Valuation Duel: The Vital Signs
Financial ratios serve as a company’s DNA, unveiling hidden risks and operational excellence that shape investment decisions.
NXP Semiconductors N.V.
NXP Semiconductors posts a strong 27.3% ROE and a healthy 19.9% net margin, signaling robust profitability. The stock trades at a neutral P/E of 21.13 but a stretched P/B of 5.78, reflecting mixed valuation signals. Shareholders receive a modest 1.96% dividend yield, balancing returns with steady reinvestment in R&D (18.6% of revenue).
MaxLinear, Inc.
MaxLinear exhibits deeply negative profitability metrics, with a -47.5% ROE and -68% net margin, underscoring operational challenges. Despite an unusual negative P/E, the valuation appears favorable on that metric. The company pays no dividend and aggressively reinvests over 62% of revenue into R&D, aiming for growth amid high leverage and weak cash flow.
Profitability Strength vs. Turnaround Risk
NXP Semiconductors offers superior profitability and a balanced payout, with a slightly stretched valuation. MaxLinear faces significant losses, relying on heavy R&D reinvestment and a lower debt profile. Investors prioritizing stability may prefer NXP’s profile, while those seeking turnaround potential might consider MaxLinear’s high-risk, growth-focused stance.
Which one offers the Superior Shareholder Reward?
NXP Semiconductors (NXPI) offers a more attractive shareholder reward than MaxLinear (MXL) in 2026. NXPI yields ~1.96% with a moderate 41% payout ratio, covered comfortably by strong free cash flow (FCF) of 8B per share. NXPI also pursues steady buybacks, enhancing total return sustainably. MXL pays no dividend, reflecting ongoing losses and negative margins, and its buyback activity is negligible. MXL focuses on reinvestment to recover profitability, but lacks immediate shareholder rewards. Given NXPI’s consistent cash generation, prudent capital allocation, and shareholder distributions, its model is more sustainable and rewarding long-term. I favor NXP for total return in 2026.
Comparative Score Analysis: The Strategic Profile
The radar chart reveals the fundamental DNA and trade-offs of NXP Semiconductors N.V. and MaxLinear, Inc., highlighting their financial strengths and vulnerabilities:
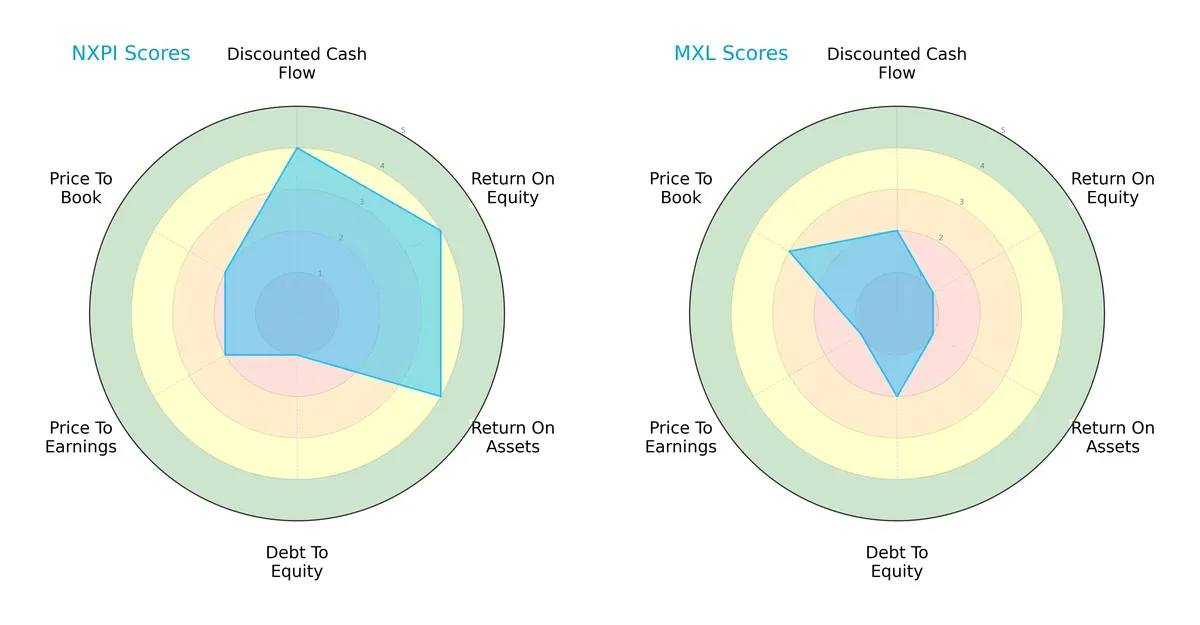
NXP Semiconductors demonstrates a balanced profile with strong DCF, ROE, and ROA scores, signaling efficient capital use and profitability. However, its very unfavorable debt-to-equity score signals heightened financial risk. MaxLinear leans on moderate valuation metrics but suffers from very unfavorable returns and weaker cash flow, indicating reliance on valuation rather than operational strength.
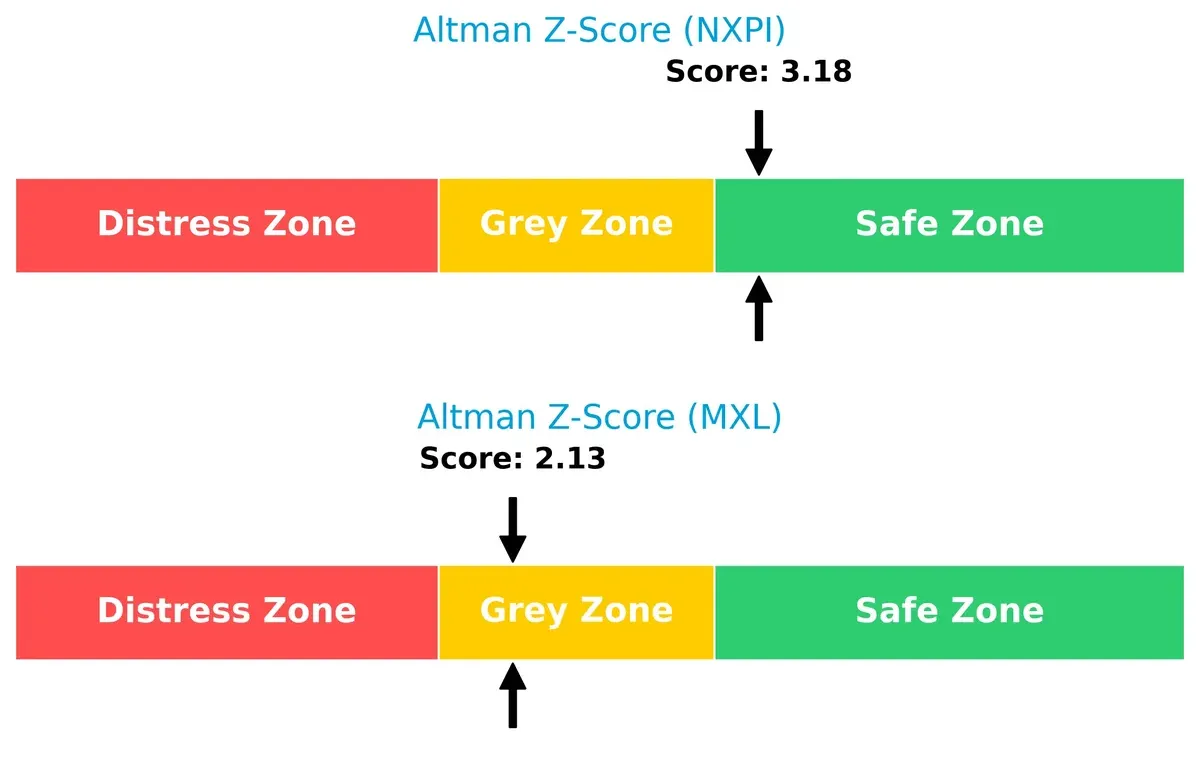
Bankruptcy Risk: Solvency Showdown
NXP’s Altman Z-Score of 3.18 places it safely above bankruptcy risk, while MaxLinear’s 2.13 suggests moderate distress. This gap highlights NXP’s superior resilience in the current economic cycle:
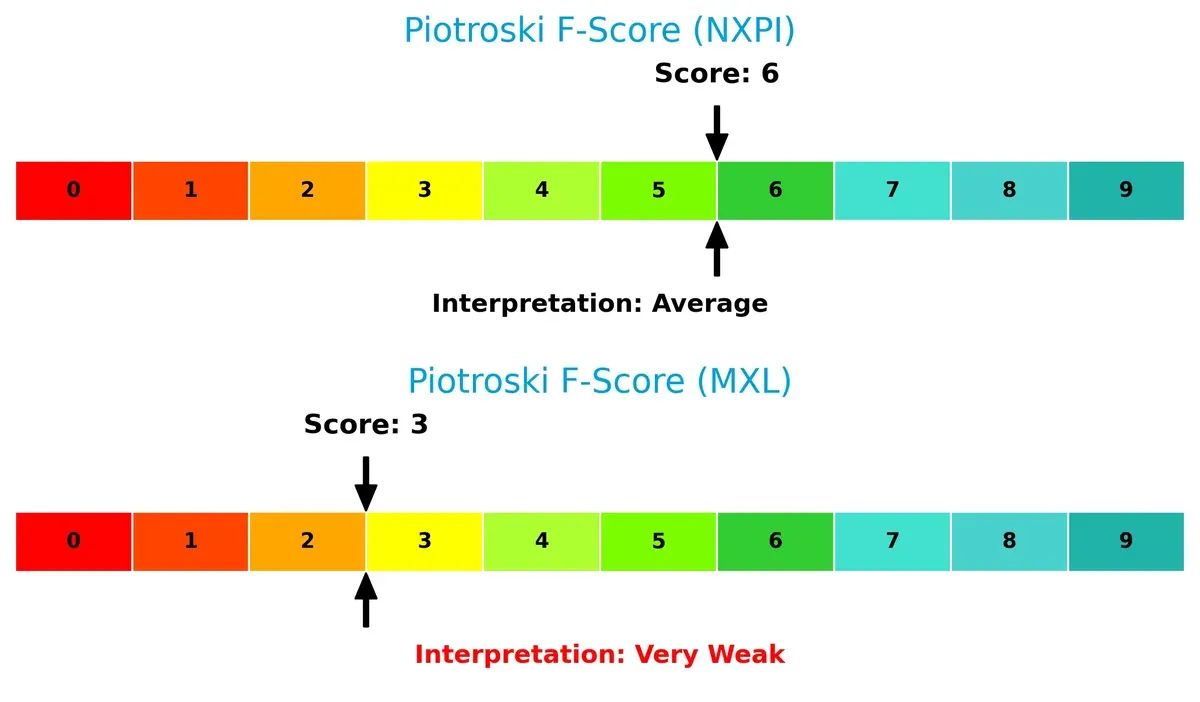
Financial Health: Quality of Operations
NXP scores a solid 6 on the Piotroski F-Score, reflecting decent operational health. MaxLinear’s score of 3 flags serious red flags in internal financial metrics, signaling caution for investors:
How are the two companies positioned?
This section dissects the operational DNA of NXPI and MXL by comparing their revenue distribution and internal dynamics. The goal is to confront their economic moats and identify the more resilient competitive advantage in today’s market.
Revenue Segmentation: The Strategic Mix
The following comparison dissects how NXP Semiconductors and MaxLinear diversify their income streams and where their primary sector bets lie:
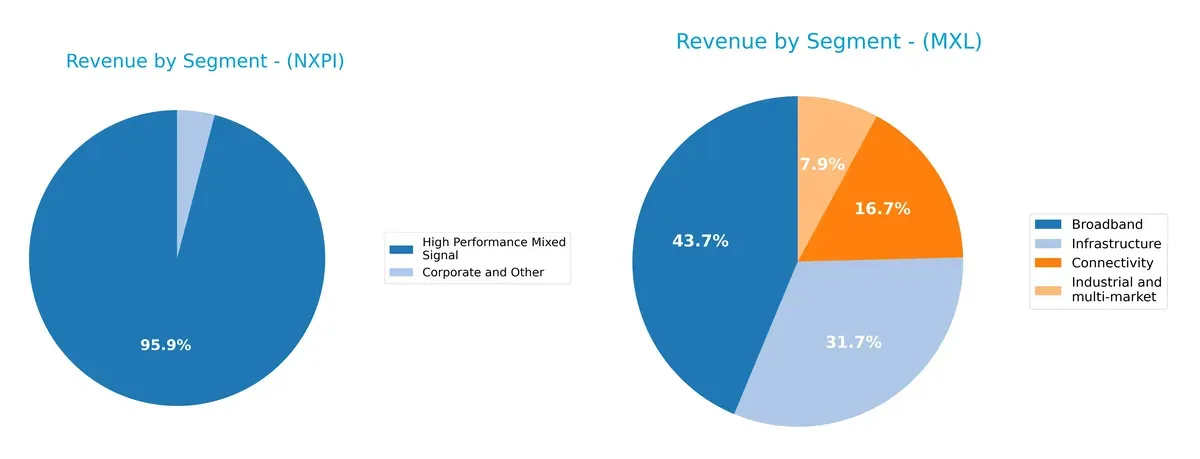
NXP Semiconductors anchors nearly all revenue in High Performance Mixed Signal, with $9B in 2018, dwarfing its Corporate and Other segment at $385M. This signals a focused semiconductor moat but exposes concentration risk. MaxLinear shows a more diversified profile, with Broadband ($204M), Infrastructure ($148M), Connectivity ($78M), and Industrial ($37M) revenues in 2025. This mix suggests resilience through multiple market exposures and less dependency on any single segment.
Strengths and Weaknesses Comparison
This table compares the Strengths and Weaknesses of NXP Semiconductors N.V. and MaxLinear, Inc.:
NXP Semiconductors Strengths
- Favorable net margin and ROE reflect strong profitability
- High current and quick ratios indicate solid liquidity
- Diversified global presence with strong revenue from China and US
MaxLinear Strengths
- Favorable current and quick ratios demonstrate adequate liquidity
- Low debt-to-equity signals conservative leverage
- Positive fixed asset turnover shows efficient asset use
NXP Semiconductors Weaknesses
- Unfavorable price-to-book and high debt-to-equity ratios imply valuation and leverage concerns
- Neutral asset turnover suggests average operational efficiency
MaxLinear Weaknesses
- Negative profitability ratios indicate sustained losses
- Unfavorable interest coverage signals risk in debt servicing
- Zero dividend yield reflects no income return for investors
NXP Semiconductors shows solid profitability and global diversification but faces leverage and valuation challenges. MaxLinear has liquidity and asset efficiency strengths but struggles with profitability and debt coverage, impacting its financial stability.
The Moat Duel: Analyzing Competitive Defensibility
A structural moat is the only true barrier protecting long-term profits from relentless competitive erosion. Let’s dissect how two semiconductor firms defend their turf:
NXP Semiconductors N.V.: Robust Innovation & Scale-Driven Moat
NXP leverages advanced microcontrollers and connectivity solutions, creating high switching costs and a broad market moat. It sustains strong ROIC above WACC, reflecting efficient capital use. Its expanding automotive and IoT markets in 2026 should deepen this advantage.
MaxLinear, Inc.: Emerging Niche with Cost Pressure
MaxLinear relies primarily on cost advantages in RF and mixed-signal SoCs, but its shrinking ROIC and negative margins show a fragile moat. Despite recent revenue growth, the company faces intense competition that may cap moat expansion in 2026.
Scale & Innovation vs. Cost Efficiency: The Semiconductor Moat Battle
NXP commands a wider, more durable moat with growing ROIC and diversified products. MaxLinear’s declining profitability signals a weakening moat. NXP is clearly better positioned to defend and grow its market share.
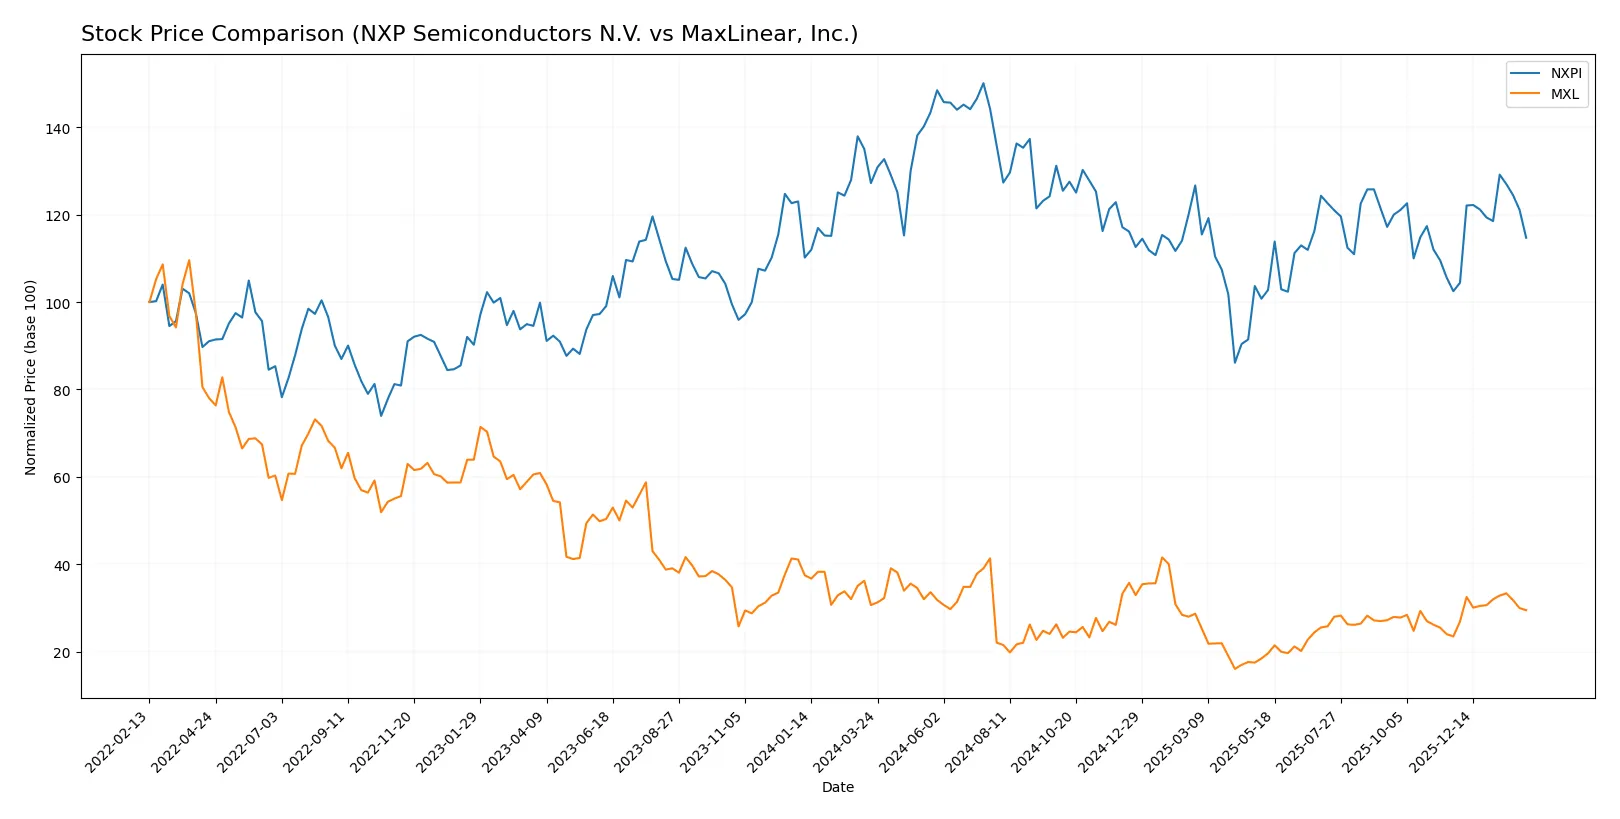
Which stock offers better returns?
Over the past year, both NXP Semiconductors N.V. and MaxLinear, Inc. experienced notable price shifts, with distinct bearish trends and recent rebounds shaping their trading dynamics.
Trend Comparison
NXP Semiconductors N.V. shows a 9.83% price decline over the past 12 months, marking a bearish trend with accelerating downward momentum and a high price volatility of 24.13%.
MaxLinear, Inc. recorded a 3.83% price drop over the same period, also bearish but with lower volatility at 3.34%, and an accelerating negative trend.
MaxLinear’s recent 25.51% price surge outpaces NXP’s 11.93% rebound, delivering superior short-term market performance.
Target Prices
Analysts present a cautiously optimistic consensus on target prices for NXP Semiconductors and MaxLinear.
| Company | Target Low | Target High | Consensus |
|---|---|---|---|
| NXP Semiconductors N.V. | 215 | 280 | 242.5 |
| MaxLinear, Inc. | 15 | 25 | 21 |
The consensus targets for both companies exceed current prices, signaling moderate upside potential. NXP’s target consensus is about 13% above its $214 price, while MaxLinear’s stands roughly 22% above $17.16.

Don’t Let Luck Decide Your Entry Point
Optimize your entry points with our advanced ProRealTime indicators. You’ll get efficient buy signals with precise price targets for maximum performance. Start outperforming now!
How do institutions grade them?
Below is a comparison of the latest institutional grades for NXP Semiconductors N.V. and MaxLinear, Inc.:
NXP Semiconductors N.V. Grades
The following table summarizes recent grades from recognized financial institutions for NXP Semiconductors N.V.:
| Grading Company | Action | New Grade | Date |
|---|---|---|---|
| Wells Fargo | Maintain | Overweight | 2026-01-15 |
| Citigroup | Maintain | Buy | 2026-01-15 |
| Truist Securities | Maintain | Buy | 2025-12-19 |
| Truist Securities | Maintain | Buy | 2025-10-29 |
| JP Morgan | Maintain | Neutral | 2025-10-29 |
| Susquehanna | Maintain | Neutral | 2025-07-23 |
| JP Morgan | Maintain | Neutral | 2025-07-23 |
| Truist Securities | Maintain | Buy | 2025-07-23 |
| Wells Fargo | Maintain | Overweight | 2025-07-23 |
| Barclays | Maintain | Overweight | 2025-07-22 |
MaxLinear, Inc. Grades
The following table details recent grades from reputable financial institutions for MaxLinear, Inc.:
| Grading Company | Action | New Grade | Date |
|---|---|---|---|
| Wells Fargo | Maintain | Equal Weight | 2026-01-30 |
| Benchmark | Maintain | Buy | 2026-01-16 |
| Benchmark | Maintain | Buy | 2025-10-24 |
| Benchmark | Maintain | Buy | 2025-10-17 |
| Benchmark | Maintain | Buy | 2025-09-02 |
| Loop Capital | Maintain | Hold | 2025-08-04 |
| Wells Fargo | Maintain | Equal Weight | 2025-07-24 |
| Benchmark | Maintain | Buy | 2025-07-24 |
| Susquehanna | Maintain | Neutral | 2025-07-24 |
| Susquehanna | Maintain | Neutral | 2025-07-22 |
Which company has the best grades?
NXP Semiconductors N.V. holds generally stronger grades, with multiple Buy and Overweight ratings from top firms. MaxLinear, Inc. has more mixed ratings, including Equal Weight and Neutral. This disparity may influence investor confidence and portfolio positioning.
Risks specific to each company
The following categories identify critical pressure points and systemic threats facing both firms in the 2026 market environment:
1. Market & Competition
NXP Semiconductors N.V.
- Strong market position in automotive and IoT semiconductors; faces intense global competition and cyclical demand risks.
MaxLinear, Inc.
- Smaller scale and niche focus with less market power; vulnerable to rapid technology shifts and aggressive competitors.
2. Capital Structure & Debt
NXP Semiconductors N.V.
- Debt-to-equity ratio at 1.18 signals leverage risk; interest coverage is solid at 7.97x but warrants monitoring.
MaxLinear, Inc.
- Low leverage with a debt-to-equity ratio of 0.29 reduces financial risk; however, negative interest coverage is a significant red flag.
3. Stock Volatility
NXP Semiconductors N.V.
- Beta of 1.46 indicates moderate volatility aligned with semiconductor sector swings.
MaxLinear, Inc.
- Higher beta at 1.71 reveals greater stock price sensitivity to market moves, increasing investment risk.
4. Regulatory & Legal
NXP Semiconductors N.V.
- Exposure to international trade regulations, especially in China and Europe, could impact operations and supply chains.
MaxLinear, Inc.
- Primarily US-based but faces compliance costs and potential export restrictions in the communications sector.
5. Supply Chain & Operations
NXP Semiconductors N.V.
- Complex global supply chain with exposure to semiconductor shortages and logistics disruptions.
MaxLinear, Inc.
- Smaller scale supply chain but vulnerable to component scarcity and supplier concentration risks.
6. ESG & Climate Transition
NXP Semiconductors N.V.
- Increasing pressure to meet stringent ESG standards; well-resourced to invest in sustainable technologies.
MaxLinear, Inc.
- ESG compliance is less advanced; risks of regulatory penalties and investor scrutiny rising.
7. Geopolitical Exposure
NXP Semiconductors N.V.
- Significant exposure to geopolitical tensions in Asia and Europe; potential disruptions in key markets.
MaxLinear, Inc.
- Mainly US-focused but indirectly affected by global supply chain and trade policy shifts.
Which company shows a better risk-adjusted profile?
NXP’s dominant market presence and strong Altman Z-score (3.18) place it in a safer financial zone despite leverage concerns. MaxLinear suffers from severe profitability and financial distress risks, reflected in its negative margins and a grey-zone Altman Z-score (2.13). I see NXP as the better risk-adjusted option. MaxLinear’s negative interest coverage and weak Piotroski score intensify my caution.
Final Verdict: Which stock to choose?
NXP Semiconductors N.V. (NXPI) excels as a value creator with a durable competitive advantage. Its superpower lies in a consistently growing ROIC well above its cost of capital, signaling efficient capital use and strong profitability. A point of vigilance is its relatively high debt-to-equity ratio, which could pressure financial flexibility. NXPI suits portfolios seeking aggressive growth with a focus on quality and durable economic moats.
MaxLinear, Inc. (MXL) offers a strategic moat centered on niche innovation and a lean capital structure, reflected in its low debt and solid current ratios. However, its declining ROIC and negative profitability metrics signal ongoing value erosion, marking it a riskier proposition than NXPI. MXL fits investors with a growth-at-a-reasonable-price (GARP) appetite willing to tolerate operational challenges for potential turnaround gains.
If you prioritize durable capital efficiency and stable profitability, NXPI outshines as the compelling choice due to its strong economic moat and value creation. However, if you seek a speculative growth play with a lean balance sheet and are willing to accept higher volatility and operational risks, MXL offers an analytical scenario worth considering for a GARP-focused portfolio.
Disclaimer: Investment carries a risk of loss of initial capital. The past performance is not a reliable indicator of future results. Be sure to understand risks before making an investment decision.
Go Further
I encourage you to read the complete analyses of NXP Semiconductors N.V. and MaxLinear, Inc. to enhance your investment decisions: