Home > Comparison > Technology > NVDA vs MXL
The strategic rivalry between NVIDIA Corporation and MaxLinear, Inc. shapes the semiconductor industry’s evolution. NVIDIA operates as a diversified technology powerhouse, delivering advanced GPUs and AI solutions globally. In contrast, MaxLinear focuses on high-performance analog and mixed-signal SoCs for communication infrastructure. This head-to-head pits NVIDIA’s scale and innovation against MaxLinear’s niche specialization. This analysis aims to identify which company offers superior risk-adjusted returns for a balanced, forward-looking portfolio.
Table of contents
Companies Overview
NVIDIA and MaxLinear stand as key players in the semiconductor industry, each shaping distinct technology niches.
NVIDIA Corporation: Leader in Graphics and AI Computing
NVIDIA dominates the graphics processing market with GeForce GPUs powering gaming and professional visualization. Its core revenue stems from GPUs, AI data center platforms, and automotive AI systems. In 2026, NVIDIA emphasizes expanding AI and accelerated computing solutions, leveraging software like Omniverse to build virtual worlds and enhance cloud computing capabilities.
MaxLinear, Inc.: Specialist in High-Performance Communications SoCs
MaxLinear focuses on radiofrequency and mixed-signal SoCs for connected homes and infrastructure. Its revenue relies on broadband radio transceivers, data converters, and communication platform solutions for 4G/5G networks and fiber optics. The company’s 2026 strategy centers on integrating advanced communication technologies to serve OEMs and industrial markets with high-speed connectivity products.
Strategic Collision: Similarities & Divergences
Both operate within semiconductors but diverge sharply: NVIDIA pursues a closed ecosystem focused on AI and visual computing, while MaxLinear adopts an open architecture for communication infrastructure. Their primary battleground is technology innovation—NVIDIA in AI acceleration, MaxLinear in connectivity integration. Investors face distinct profiles: NVIDIA embodies high growth and scale, MaxLinear offers niche specialization with steady market demand.
Income Statement Comparison
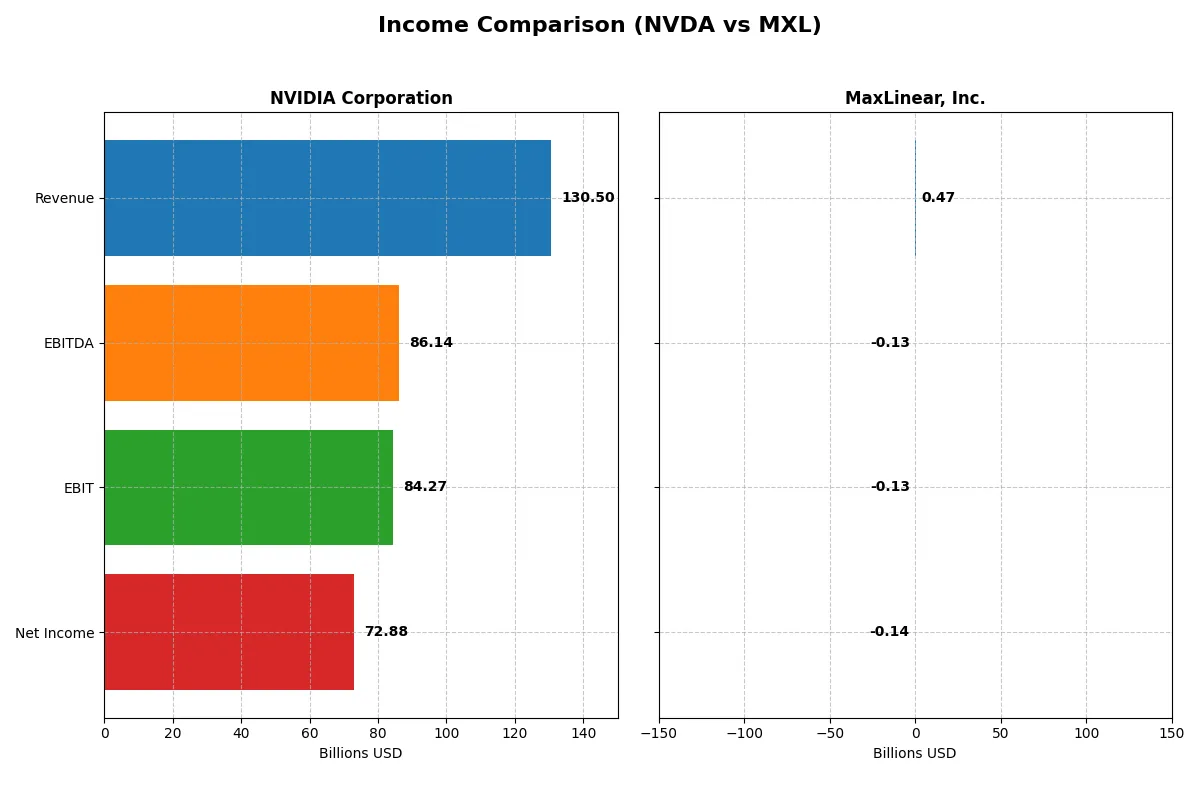
This data dissects the core profitability and scalability of both corporate engines to reveal who dominates the bottom line:
| Metric | NVIDIA Corporation (NVDA) | MaxLinear, Inc. (MXL) |
|---|---|---|
| Revenue | 130.5B | 468M |
| Cost of Revenue | 32.6B | 202M |
| Operating Expenses | 16.4B | 393M |
| Gross Profit | 97.9B | 266M |
| EBITDA | 86.1B | -131M |
| EBIT | 84.3B | -131M |
| Interest Expense | 247M | 10M |
| Net Income | 72.9B | -137M |
| EPS | 2.97 | -1.58 |
| Fiscal Year | 2025 | 2025 |
Income Statement Analysis: The Bottom-Line Duel
This income statement comparison reveals which company runs a more efficient and profitable corporate engine in a dynamic market environment.
NVIDIA Corporation Analysis
NVIDIA’s revenue surged from 27B in 2021 to 130B in 2025, with net income exploding from 4.3B to 72.9B. Gross margin remains robust near 75%, while net margin impressively climbs to 55.9%. The latest fiscal year shows exceptional operational leverage and accelerating profitability, highlighting NVIDIA’s dominant market execution and scale efficiency.
MaxLinear, Inc. Analysis
MaxLinear’s revenue peaked at 1.1B in 2022 but declined to 468M in 2025, with net losses worsening from 42M net income in 2021 to -137M net loss in 2025. The gross margin stays moderate at 56.8%, but negative EBIT and net margins indicate operational struggles. Despite recent growth improvements, the company faces ongoing profitability headwinds and margin compression.
Scale and Profitability: NVIDIA’s Dominance vs. MaxLinear’s Recovery Struggle
NVIDIA clearly outperforms MaxLinear in scale, margin quality, and bottom-line profitability. NVIDIA’s sustained revenue and income growth create a commanding moat, while MaxLinear battles a shrinking top line and negative earnings. Investors seeking reliable earnings and margin strength will find NVIDIA’s profile significantly more attractive.
Financial Ratios Comparison
These vital ratios act as a diagnostic tool to expose the underlying fiscal health, valuation premiums, and capital efficiency of the companies compared below:
| Ratios | NVIDIA Corporation (NVDA) | MaxLinear, Inc. (MXL) |
|---|---|---|
| ROE | 91.9% | -47.5% |
| ROIC | 75.3% | -24.3% |
| P/E | 39.9 | -6.74 |
| P/B | 36.7 | 3.20 |
| Current Ratio | 4.44 | 1.77 |
| Quick Ratio | 3.88 | 1.28 |
| D/E | 0.13 | 0.29 |
| Debt-to-Assets | 9.2% | 17.2% |
| Interest Coverage | 330 | -15.5 |
| Asset Turnover | 1.17 | 0.42 |
| Fixed Asset Turnover | 16.2 | 4.65 |
| Payout Ratio | 1.1% | 0% |
| Dividend Yield | 0.029% | 0% |
| Fiscal Year | 2025 | 2024 |
Efficiency & Valuation Duel: The Vital Signs
Financial ratios act as a company’s DNA, exposing hidden risks and operational strengths crucial for investment decisions.
NVIDIA Corporation
NVIDIA dominates with a stellar 91.9% ROE and 55.9% net margin, showcasing exceptional profitability. Its P/E of 39.9 signals a stretched valuation relative to earnings, while a P/S ratio above 22 confirms premium pricing. Shareholders see minimal dividends, as NVIDIA reinvests heavily in R&D (about 10% of revenue) to fuel growth and innovation.
MaxLinear, Inc.
MaxLinear struggles with a negative 47.5% ROE and a steep -68.0% net margin, reflecting deep operational challenges. Despite a low P/E ratio, this stems from losses rather than value, while a moderate P/B of 3.2 suggests some asset backing. The company pays no dividend, instead focusing capital on high R&D spending (over 60% of revenue) attempting to reverse its fortunes.
Premium Valuation vs. Operational Struggles
NVIDIA offers a compelling mix of operational efficiency and growth reinvestment despite a stretched valuation. MaxLinear’s metrics reveal high risk with negative returns and cash flow strain. Investors seeking stability and proven profitability align better with NVIDIA; those chasing turnaround potential face greater uncertainty with MaxLinear.
Which one offers the Superior Shareholder Reward?
I observe NVIDIA pays a minuscule 0.03% dividend yield with a 1.1% payout ratio, signaling a strong preference for reinvestment and buybacks. Its buyback program is robust, enhancing shareholder value through capital return. MaxLinear pays no dividend and struggles with negative margins and cash flow. MXL’s lack of dividend and negative free cash flow highlight a riskier, growth-at-any-cost approach. NVIDIA’s capital allocation balances growth with shareholder returns, sustaining long-term value better than MXL’s distressed model. I conclude NVIDIA offers the superior total shareholder reward in 2026.
Comparative Score Analysis: The Strategic Profile
The radar chart exposes the fundamental DNA and trade-offs of NVIDIA Corporation and MaxLinear, Inc., highlighting their core financial strengths and weaknesses:
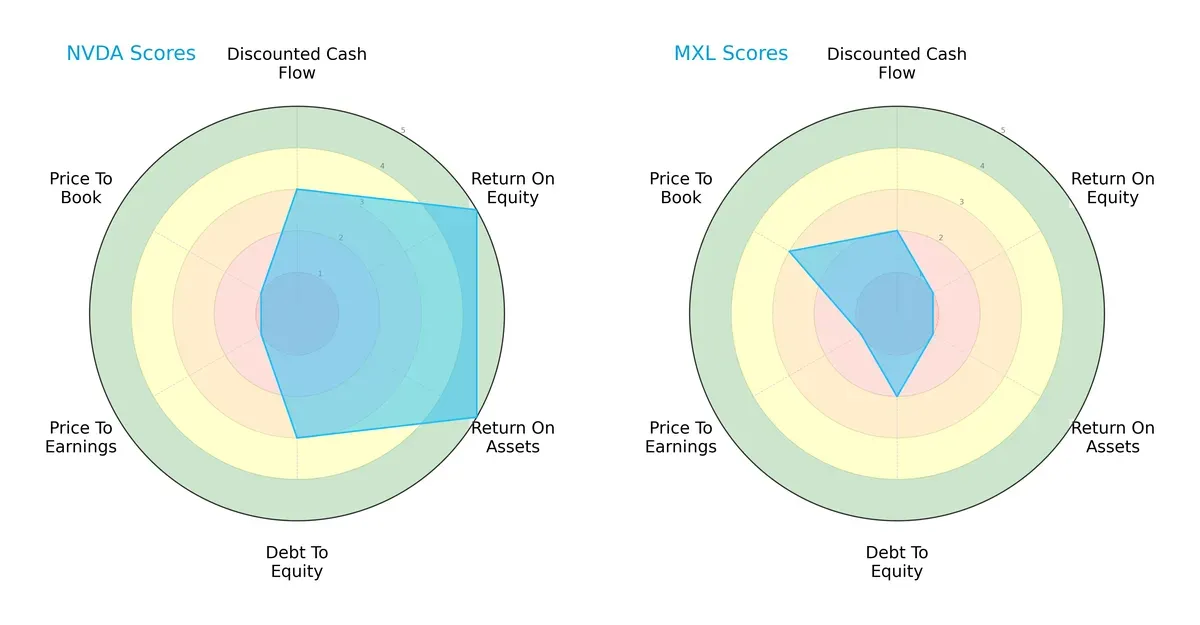
NVIDIA dominates with very favorable ROE and ROA scores (5 each), showing superior profitability and asset efficiency. MaxLinear lags significantly with low scores of 1 in these areas, signaling operational challenges. NVIDIA’s moderate debt-to-equity score (3) balances risk better than MaxLinear’s (2). Both struggle on valuation metrics, but MaxLinear shows a slight edge in price-to-book (3 vs. 1). Overall, NVIDIA presents a more balanced and robust profile, while MaxLinear relies heavily on valuation potential amid weaker fundamentals.
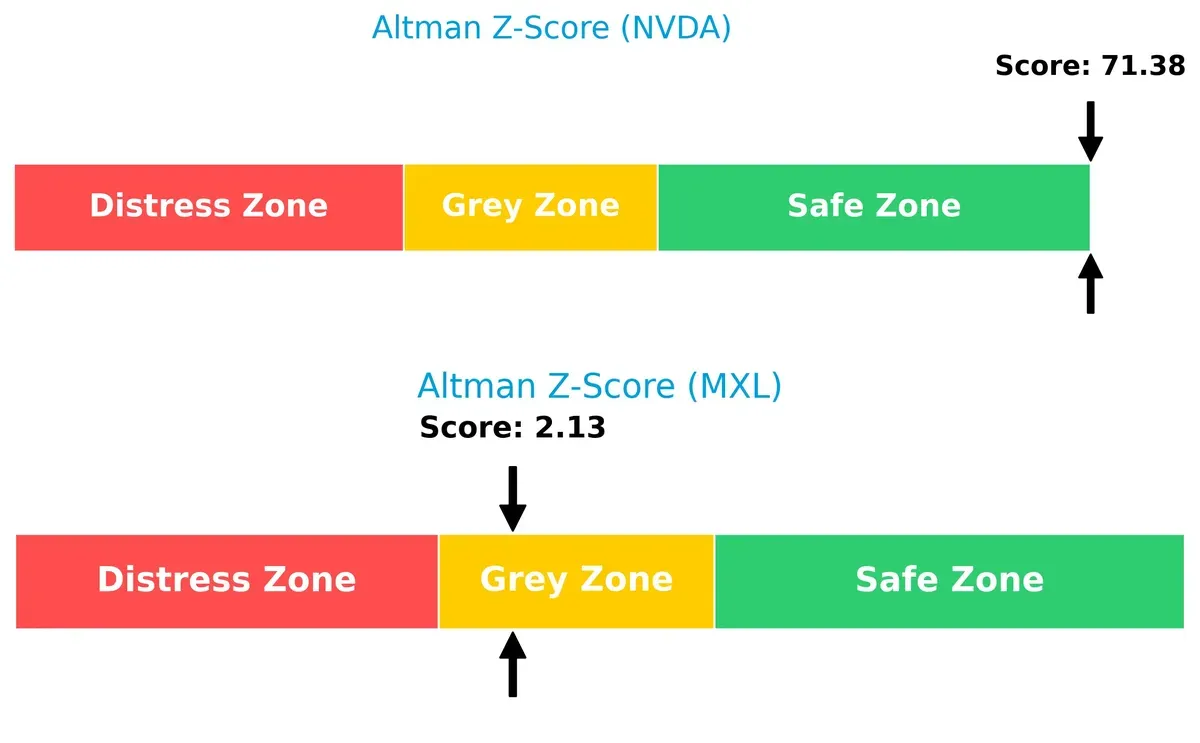
Bankruptcy Risk: Solvency Showdown
NVIDIA’s Altman Z-Score of 71.4 places it firmly in the safe zone, signaling exceptional financial stability. MaxLinear’s 2.13 score situates it in the grey zone, indicating moderate bankruptcy risk in this market cycle:
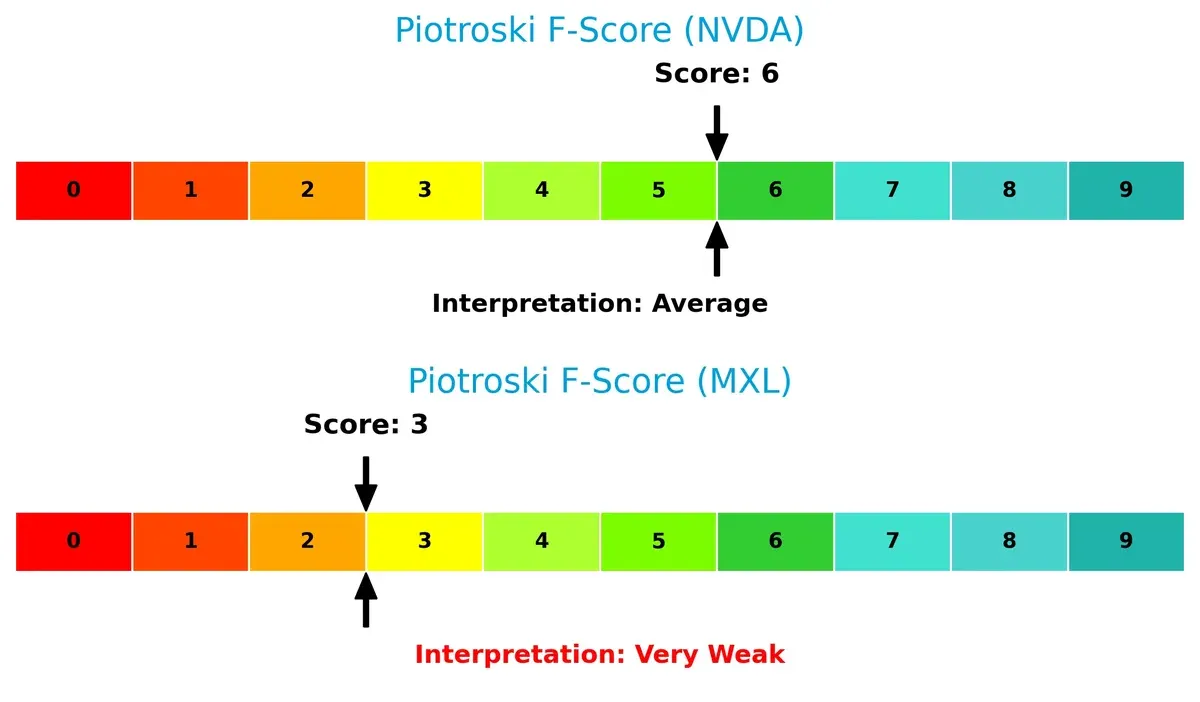
Financial Health: Quality of Operations
NVIDIA’s Piotroski F-Score of 6 reflects solid financial health and operational quality. MaxLinear’s score of 3 raises red flags, suggesting weaker internal metrics and financial distress signals relative to its peer:
How are the two companies positioned?
This section dissects the operational DNA of NVIDIA and MaxLinear by comparing their revenue distribution and internal strengths and weaknesses. The goal is to confront their economic moats to reveal which model delivers the most resilient competitive advantage today.
Revenue Segmentation: The Strategic Mix
This visual comparison dissects how NVIDIA Corporation and MaxLinear, Inc. diversify their income streams and highlights their primary sector bets:
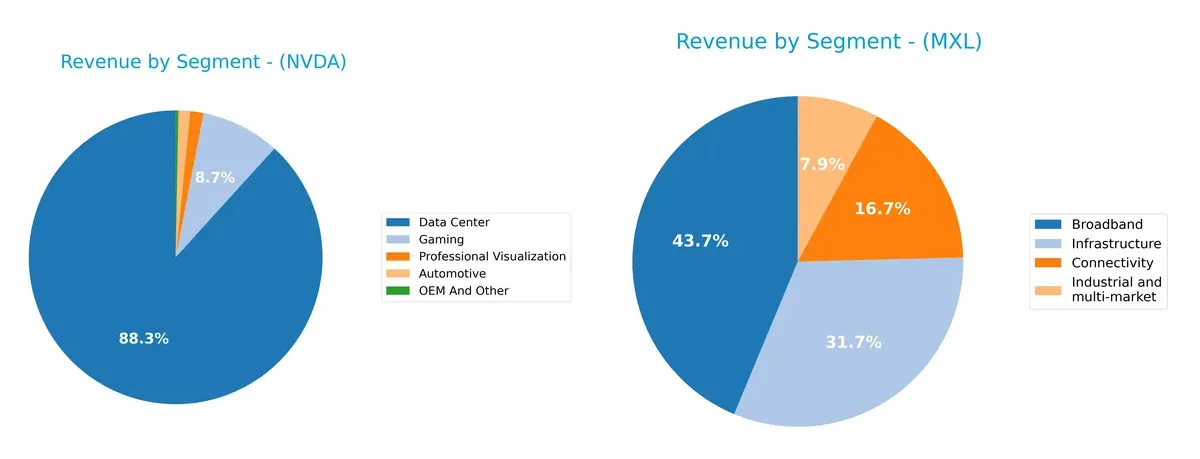
NVIDIA heavily pivots on its Data Center segment, generating $115B in 2025, dwarfing other areas like Gaming at $11.4B. This concentration signals strong infrastructure dominance but raises concentration risk. MaxLinear posts a more balanced mix with Broadband at $204M and Infrastructure at $148M, reflecting broader market exposure and less reliance on a single segment. NVIDIA’s scale anchors an ecosystem lock-in; MaxLinear’s spread suggests resilience through diversification.
Strengths and Weaknesses Comparison
This table compares the Strengths and Weaknesses of NVIDIA Corporation and MaxLinear, Inc.:
NVIDIA Corporation Strengths
- High profitability with 55.85% net margin
- Strong ROE of 91.87% and ROIC of 75.28%
- Low debt-to-assets at 9.2% with excellent interest coverage
- Diversified revenue streams led by Data Center and Gaming
- Significant global presence, especially in the US and Asia
- High asset turnover and fixed asset efficiency
MaxLinear, Inc. Strengths
- Favorable valuation with positive PE despite losses
- Moderate current and quick ratios indicating liquidity
- Manageable debt levels with 17.23% debt-to-assets
- Diverse product segments including Broadband and Connectivity
- Presence in Asia and the US markets
- Fixed asset turnover shows operational efficiency
NVIDIA Corporation Weaknesses
- Unfavorable high WACC at 14.73% raises capital cost
- Elevated P/B ratio at 36.66 may indicate overvaluation
- High current ratio at 4.44 suggests inefficient asset use
- Minimal dividend yield at 0.03%, limiting income appeal
MaxLinear, Inc. Weaknesses
- Negative profitability metrics: net margin -68.01%, ROE -47.49%, ROIC -24.31%
- Unfavorable interest coverage at -13.01 signals financial stress
- Lower asset turnover at 0.42 implies inefficient asset use
- Unfavorable P/B ratio at 3.2 may reflect market skepticism
- Zero dividend yield reduces shareholder returns
Overall, NVIDIA displays robust profitability and operational efficiency with global scale but faces valuation and capital cost concerns. MaxLinear shows liquidity and asset use strengths but struggles with persistent losses and financial strain, impacting its market perception and profitability. These contrasts highlight different strategic challenges and opportunities for each company.
The Moat Duel: Analyzing Competitive Defensibility
A structural moat is the only thing protecting long-term profits from relentless competition erosion. Let’s dissect the competitive defenses of two semiconductor players:
NVIDIA Corporation: Innovation and Scale Lock-in
NVIDIA’s moat stems from a powerful blend of network effects and intangible assets. Its 75% gross margin and 55% net margin reflect robust pricing power and efficiency. Expansion into AI and data centers in 2026 should deepen this moat further.
MaxLinear, Inc.: Niche Integration Challenge
MaxLinear relies on cost advantage within specialized RF and mixed-signal SoCs, but its negative EBIT margin exposes weak moat strength. Unlike NVIDIA, it struggles to scale profits but shows growth potential in 5G infrastructure markets.
The Moat Verdict: Network Effects vs. Cost Efficiency
NVIDIA’s wide moat with soaring ROIC growth dwarfs MaxLinear’s shrinking returns and negative profitability. I see NVIDIA as far better positioned to defend and expand its market share in 2026.
Which stock offers better returns?
The past year shows NVIDIA’s stock more than doubling, reflecting strong momentum despite recent deceleration. MaxLinear’s shares declined overall but gained recent traction with accelerating buying interest.
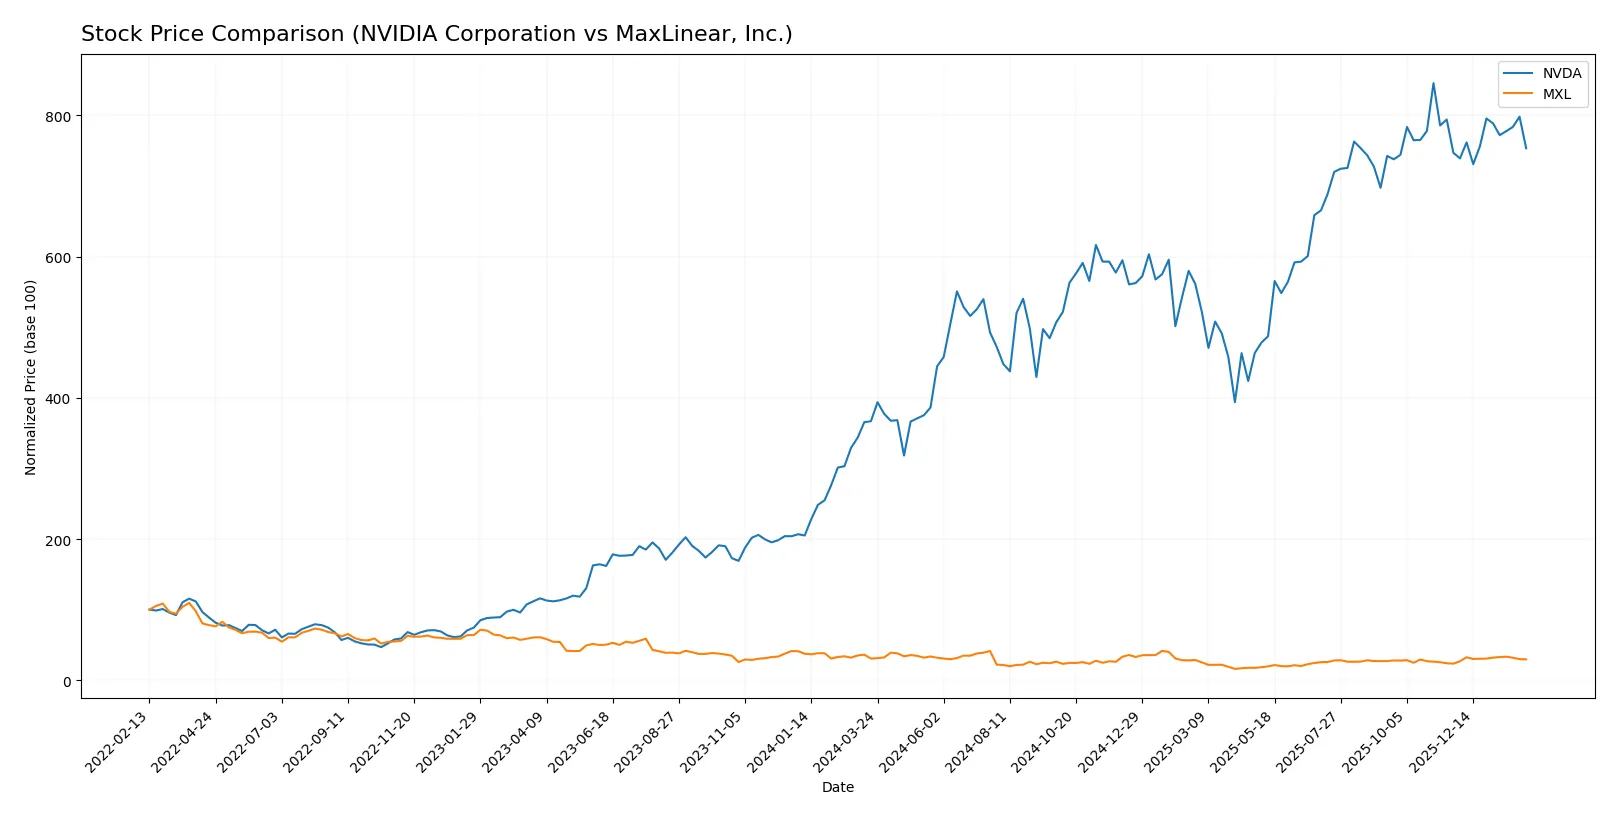
Trend Comparison
NVIDIA’s stock surged 105.39% over the past year, marking a clear bullish trend with decelerating growth. It reached a high of 202.49 and a low of 76.2, showing significant price range expansion.
MaxLinear’s stock dropped 3.83% over the same period, indicating a bearish trend that is accelerating. The stock fluctuated between 9.31 and 24.05, with recent gains of 25.51% signaling a possible recovery.
NVIDIA outperformed MaxLinear significantly, delivering the highest returns despite recent trend deceleration, while MaxLinear’s recent rally has yet to offset its yearly losses.
Target Prices
Analysts present a wide target price range for NVIDIA Corporation and MaxLinear, Inc., reflecting varied growth expectations.
| Company | Target Low | Target High | Consensus |
|---|---|---|---|
| NVIDIA Corporation | 140 | 352 | 265.21 |
| MaxLinear, Inc. | 15 | 25 | 21 |
NVIDIA’s consensus target at 265.21 suggests a 47% upside from its current 180.27 price, indicating strong confidence in its semiconductor leadership. MaxLinear’s target consensus at 21 also implies a modest upside from 17.05, reflecting cautious optimism in its niche communications solutions.

Don’t Let Luck Decide Your Entry Point
Optimize your entry points with our advanced ProRealTime indicators. You’ll get efficient buy signals with precise price targets for maximum performance. Start outperforming now!
How do institutions grade them?
NVIDIA Corporation Grades
Below is a summary of recent institutional grades for NVIDIA Corporation.
| Grading Company | Action | New Grade | Date |
|---|---|---|---|
| Jefferies | maintain | Buy | 2026-01-16 |
| Mizuho | maintain | Outperform | 2026-01-09 |
| Stifel | maintain | Buy | 2025-12-29 |
| Truist Securities | maintain | Buy | 2025-12-29 |
| B of A Securities | maintain | Buy | 2025-12-26 |
| Bernstein | maintain | Outperform | 2025-12-26 |
| Baird | maintain | Outperform | 2025-12-26 |
| Truist Securities | maintain | Buy | 2025-12-19 |
| Tigress Financial | maintain | Strong Buy | 2025-12-18 |
| Morgan Stanley | maintain | Overweight | 2025-12-01 |
MaxLinear, Inc. Grades
Below is a summary of recent institutional grades for MaxLinear, Inc.
| Grading Company | Action | New Grade | Date |
|---|---|---|---|
| Wells Fargo | maintain | Equal Weight | 2026-01-30 |
| Benchmark | maintain | Buy | 2026-01-16 |
| Benchmark | maintain | Buy | 2025-10-24 |
| Benchmark | maintain | Buy | 2025-10-17 |
| Benchmark | maintain | Buy | 2025-09-02 |
| Loop Capital | maintain | Hold | 2025-08-04 |
| Wells Fargo | maintain | Equal Weight | 2025-07-24 |
| Benchmark | maintain | Buy | 2025-07-24 |
| Susquehanna | maintain | Neutral | 2025-07-24 |
| Susquehanna | maintain | Neutral | 2025-07-22 |
Which company has the best grades?
NVIDIA consistently receives stronger grades, including multiple “Buy,” “Outperform,” and a “Strong Buy” rating. MaxLinear’s grades range mostly from “Buy” to “Equal Weight” and “Neutral.” Investors may interpret NVIDIA’s superior grades as higher analyst confidence and potentially stronger growth prospects.
Risks specific to each company
The following categories identify the critical pressure points and systemic threats facing both firms in the 2026 market environment:
1. Market & Competition
NVIDIA Corporation
- Dominates high-performance GPU and AI markets with strong brand moat, but faces intense semiconductor rivalry.
MaxLinear, Inc.
- Competes in niche RF and mixed-signal SoCs with limited scale, vulnerable to larger competitors’ tech advances.
2. Capital Structure & Debt
NVIDIA Corporation
- Maintains very low debt-to-equity (0.13) and strong interest coverage (341x), ensuring financial resilience.
MaxLinear, Inc.
- Higher debt ratio (0.29) and negative interest coverage signal elevated financial risk and tighter liquidity.
3. Stock Volatility
NVIDIA Corporation
- High beta (2.31) indicates elevated sensitivity to market swings, driven by tech sector cyclicality.
MaxLinear, Inc.
- Beta of 1.71 reflects moderate volatility but less market sensitivity than NVIDIA.
4. Regulatory & Legal
NVIDIA Corporation
- Exposure to export controls and antitrust scrutiny due to market dominance and international sales.
MaxLinear, Inc.
- Faces regulatory risks typical of semiconductor suppliers, with less geopolitical scrutiny but potential compliance costs.
5. Supply Chain & Operations
NVIDIA Corporation
- Complex global supply chain vulnerable to geopolitical tensions in Asia and component shortages.
MaxLinear, Inc.
- Smaller scale supply chain with risks in securing advanced components amid industry-wide shortages.
6. ESG & Climate Transition
NVIDIA Corporation
- Active in reducing carbon footprint and enhancing sustainability, aligning with investor ESG demands.
MaxLinear, Inc.
- Limited ESG disclosures and initiatives create potential reputational and regulatory risks.
7. Geopolitical Exposure
NVIDIA Corporation
- Significant exposure to US-China tensions impacting manufacturing and sales in critical Asian markets.
MaxLinear, Inc.
- Moderate geopolitical risk with less direct exposure to China but reliant on global tech supply chain stability.
Which company shows a better risk-adjusted profile?
NVIDIA’s most impactful risk lies in its high market volatility and geopolitical exposure, while MaxLinear faces severe financial distress risk from weak profitability and liquidity. NVIDIA’s robust balance sheet and high Altman Z-Score (71.4, safe zone) contrast sharply with MaxLinear’s grey zone Z-Score (2.13) and negative earnings. Overall, NVIDIA offers a superior risk-adjusted profile, supported by consistent profitability and scale advantages despite valuation and regulatory pressures.
Final Verdict: Which stock to choose?
NVIDIA’s superpower lies in its durable economic moat and stellar capital efficiency. It commands industry-leading returns on invested capital, signaling a well-executed strategy in a high-growth market. Its valuation and current ratio suggest caution; this stock suits investors with an appetite for aggressive growth and technological leadership exposure.
MaxLinear’s strategic moat centers on niche market positioning and specialized R&D efforts, yet it struggles with consistent profitability and value creation. While offering relatively more conservative liquidity metrics, it presents higher risks. This stock might appeal to portfolios focused on turnaround potential or speculative growth at a reasonable price.
If you prioritize sustained value creation and robust profitability in cutting-edge tech, NVIDIA outshines with superior capital returns and market dominance. However, if you seek speculative exposure with a focus on operational improvement and valuation leverage, MaxLinear offers a less stable but potentially rewarding scenario. Both demand careful risk assessment aligned with your investment profile.
Disclaimer: Investment carries a risk of loss of initial capital. The past performance is not a reliable indicator of future results. Be sure to understand risks before making an investment decision.
Go Further
I encourage you to read the complete analyses of NVIDIA Corporation and MaxLinear, Inc. to enhance your investment decisions: