Home > Comparison > Technology > NVMI vs MXL
The strategic rivalry between Nova Ltd. and MaxLinear, Inc. shapes the semiconductor industry’s future. Nova operates as a precision metrology equipment provider, essential for semiconductor manufacturing process control. MaxLinear focuses on high-performance analog and mixed-signal SoCs for communications infrastructure. This head-to-head pits capital-intensive industrial specialization against integrated communications solutions. This analysis aims to identify which company presents the superior risk-adjusted return for diversified portfolios navigating technology sector dynamics.
Table of contents
Companies Overview
Nova Ltd. and MaxLinear, Inc. stand as key players shaping the semiconductor industry’s technology frontier.
Nova Ltd.: Precision Process Control Pioneer
Nova Ltd. dominates the semiconductor process control systems market with advanced metrology platforms. It generates revenue by selling measurement solutions that optimize semiconductor manufacturing steps like lithography and etch. In 2026, Nova focuses strategically on expanding its footprint across integrated circuit sectors including logic, memory, and foundries to reinforce its competitive edge.
MaxLinear, Inc.: Integrated Communications SoC Leader
MaxLinear, Inc. leads in RF and mixed-signal SoC solutions for connected home and infrastructure applications. Its core revenue derives from high-performance analog and digital signal processing chips used in modems, routers, and 4G/5G base stations. The 2026 strategy emphasizes developing highly integrated communication platforms to capture growing demand in broadband and wireless networks globally.
Strategic Collision: Similarities & Divergences
Both companies innovate within semiconductors but contrast sharply in focus: Nova centers on precision measurement for manufacturing, while MaxLinear targets communication chip integration. Their primary battleground lies in technology leadership amid evolving semiconductor demands. Investors should note Nova’s specialization versus MaxLinear’s broader communications exposure shapes markedly different risk and growth profiles.
Income Statement Comparison
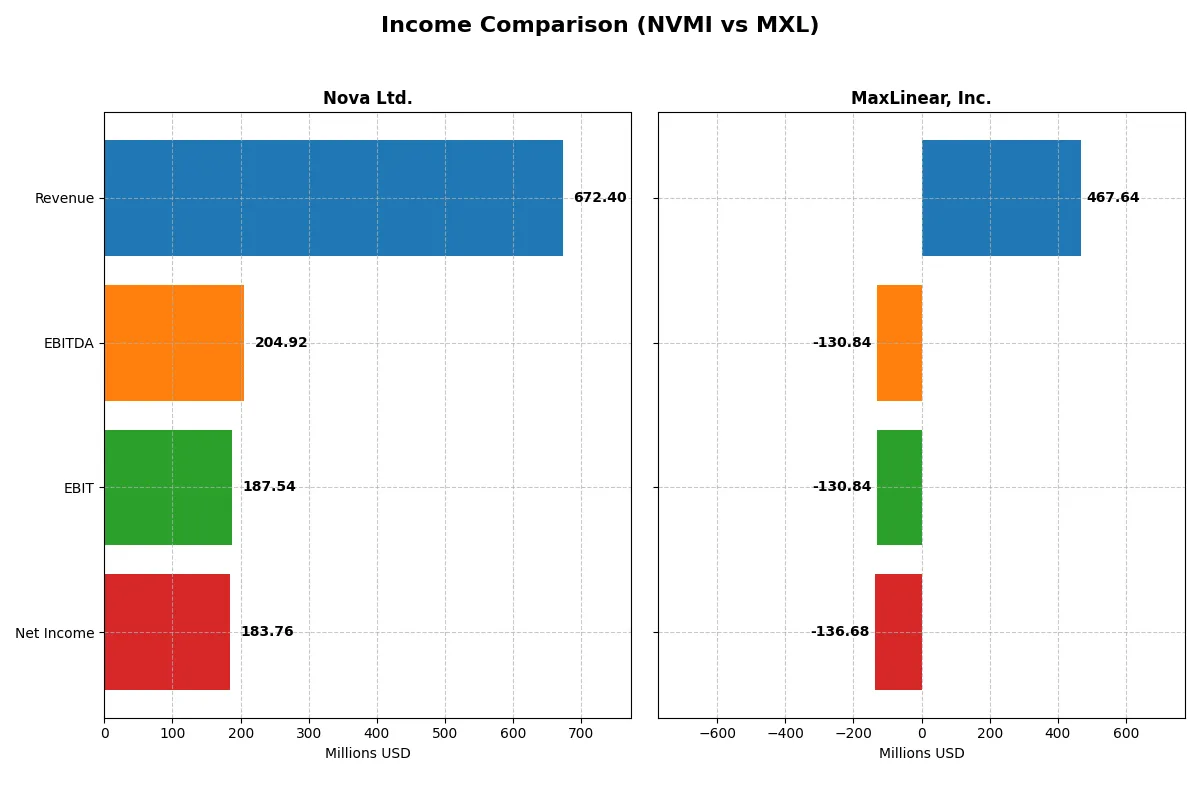
This data dissects the core profitability and scalability of both corporate engines to reveal who dominates the bottom line:
| Metric | Nova Ltd. (NVMI) | MaxLinear, Inc. (MXL) |
|---|---|---|
| Revenue | 672M | 468M |
| Cost of Revenue | 285M | 202M |
| Operating Expenses | 200M | 393M |
| Gross Profit | 387M | 266M |
| EBITDA | 205M | -131M |
| EBIT | 188M | -131M |
| Interest Expense | 1.6M | 10.1M |
| Net Income | 184.9M | -136.7M |
| EPS | 6.31 | -1.58 |
| Fiscal Year | 2024 | 2025 |
Income Statement Analysis: The Bottom-Line Duel
This income statement comparison reveals which company operates with greater financial efficiency and sustainable profitability.
Nova Ltd. Analysis
Nova Ltd. demonstrates a strong revenue uptrend, reaching $672M in 2024, with net income climbing to $185M. Gross margin stands at 57.6%, indicating robust product profitability. The net margin of 27.3% remains healthy, reflecting disciplined cost control. In 2024, Nova sustains momentum with 30% revenue growth and solid EBIT expansion, signaling operational strength.
MaxLinear, Inc. Analysis
MaxLinear posts $468M revenue in 2025, showing a recent rebound after a declining multi-year trend. Gross margin holds at a competitive 56.8%, but EBIT margin suffers a steep loss at -28%. The net margin is deeply negative at -29%, reflecting ongoing losses despite improving year-on-year growth rates. MaxLinear’s 2025 results highlight recovery signs but persistent profitability challenges.
Margin Strength vs. Recovery Struggles
Nova Ltd. outperforms MaxLinear with superior margins and consistent earnings growth over five years. MaxLinear faces a difficult turnaround, with negative EBIT and net margins overshadowing its revenue growth. For investors, Nova’s profile offers a more reliable earnings engine and margin resilience, while MaxLinear remains a high-risk recovery play.
Financial Ratios Comparison
These vital ratios act as a diagnostic tool to expose the underlying fiscal health, valuation premiums, and capital efficiency of the companies compared below:
| Ratios | Nova Ltd. (NVMI) | MaxLinear, Inc. (MXL) |
|---|---|---|
| ROE | 19.8% | -47.5% |
| ROIC | 13.4% | -24.3% |
| P/E | 31.2 | -6.7 |
| P/B | 6.18 | 3.20 |
| Current Ratio | 2.32 | 1.77 |
| Quick Ratio | 1.92 | 1.28 |
| D/E (Debt-to-Equity) | 0.25 | 0.29 |
| Debt-to-Assets | 17.0% | 17.2% |
| Interest Coverage | 116.2 | -15.5 |
| Asset Turnover | 0.48 | 0.42 |
| Fixed Asset Turnover | 5.06 | 4.65 |
| Payout Ratio | 0 | 0 |
| Dividend Yield | 0 | 0 |
| Fiscal Year | 2024 | 2024 |
Efficiency & Valuation Duel: The Vital Signs
Financial ratios serve as a company’s DNA, exposing hidden risks and operational strengths beyond surface-level metrics.
Nova Ltd.
Nova Ltd. demonstrates robust profitability with a 19.81% ROE and a strong 27.33% net margin, signaling operational efficiency. However, its valuation appears stretched, with a high P/E of 31.2 and a P/B of 6.18. The company retains earnings for growth, as it pays no dividends, reflecting a focus on reinvestment and innovation.
MaxLinear, Inc.
MaxLinear, Inc. faces profitability challenges, posting a negative ROE of -47.49% and a steep -68.01% net margin, indicating operational difficulties. While its P/E ratio is negative, suggesting market skepticism, the P/B at 3.2 is more reasonable. The company also pays no dividend, prioritizing R&D heavily to reverse its losses.
Premium Valuation vs. Operational Safety
Nova Ltd. offers a stronger balance of profitability and operational health despite a premium valuation. MaxLinear’s negative returns and cash flow issues heighten risk. Investors seeking stability may favor Nova’s profile; those tolerating volatility might watch MaxLinear for turnaround potential.
Which one offers the Superior Shareholder Reward?
Nova Ltd. (NVMI) and MaxLinear, Inc. (MXL) both forgo dividends, focusing on reinvestment and buybacks. NVMI sports a stronger free cash flow per share of 7.49 versus MXL’s negative 0.75 in 2024. NVMI’s payout comes solely through share repurchases, supported by a healthy operating cash flow ratio of 0.61. MXL, meanwhile, struggles with negative profit margins and weak cash flow, limiting buyback potential. Historically in semiconductors, consistent cash generation underpins sustainable buybacks. I see NVMI’s distribution model as more sustainable and value-accretive. For 2026 investors prioritizing total return, NVMI offers a superior shareholder reward due to its robust cash flow and disciplined capital allocation.
Comparative Score Analysis: The Strategic Profile
The radar chart reveals the fundamental DNA and trade-offs of Nova Ltd. and MaxLinear, Inc., highlighting their distinct financial strengths and vulnerabilities:
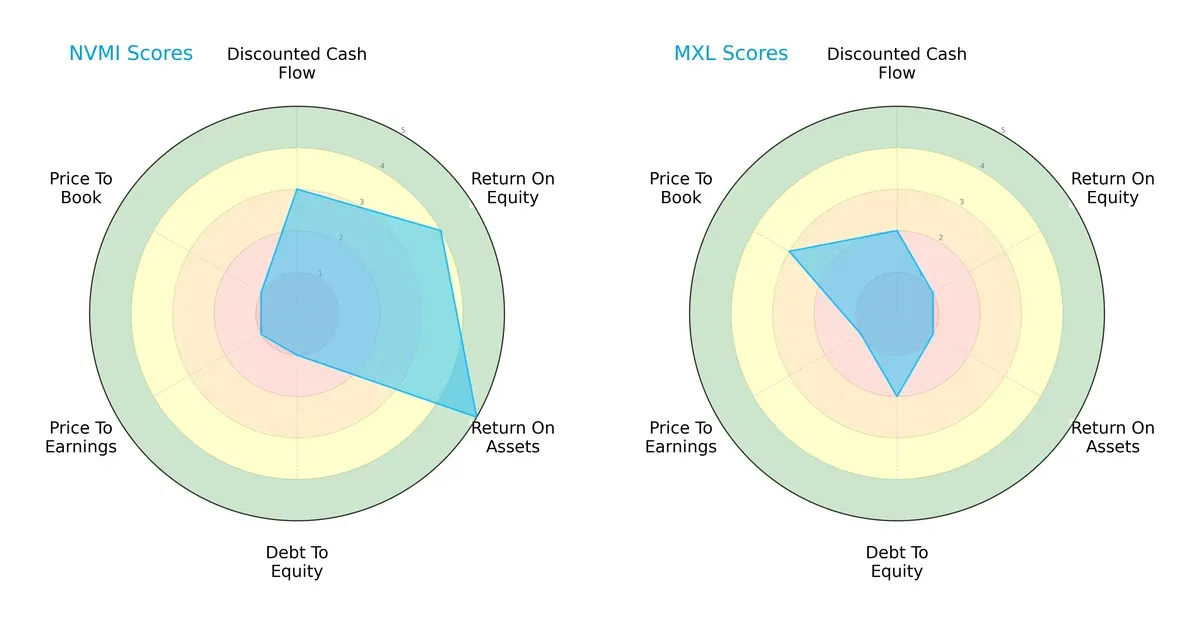
Nova Ltd. shows superior operational efficiency with higher ROE (4 vs. 1) and ROA (5 vs. 1) scores. However, it carries significant leverage risks, reflected in its very unfavorable debt-to-equity score (1 vs. 2). MaxLinear, Inc. maintains a more conservative balance sheet but struggles with profitability and asset utilization. Valuation metrics penalize both firms equally, but MaxLinear’s slightly better price-to-book score (3 vs. 1) suggests relative undervaluation. Overall, Nova Ltd. exhibits a more unbalanced profile reliant on operational excellence, while MaxLinear appears steadier but less efficient.
Bankruptcy Risk: Solvency Showdown
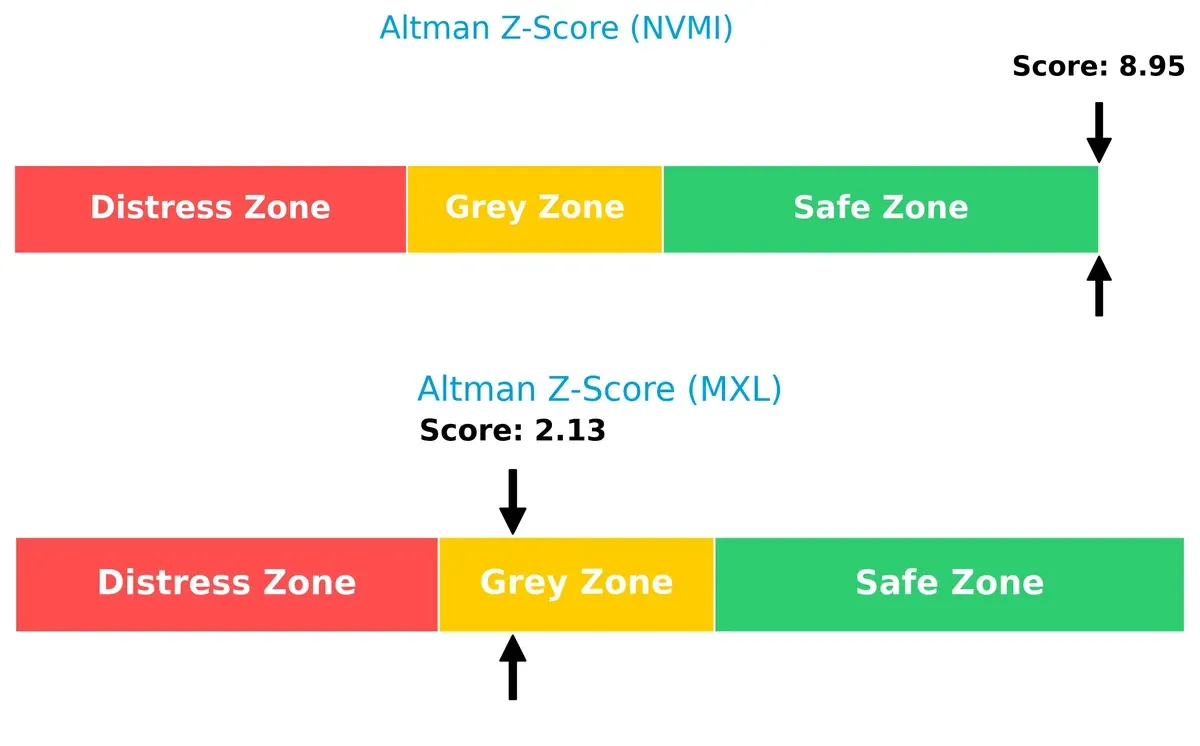
Nova Ltd.’s Altman Z-Score of 8.95 places it firmly in the safe zone, signaling robust long-term solvency. MaxLinear’s 2.13 score lies in the grey zone, indicating moderate bankruptcy risk in this volatile cycle:
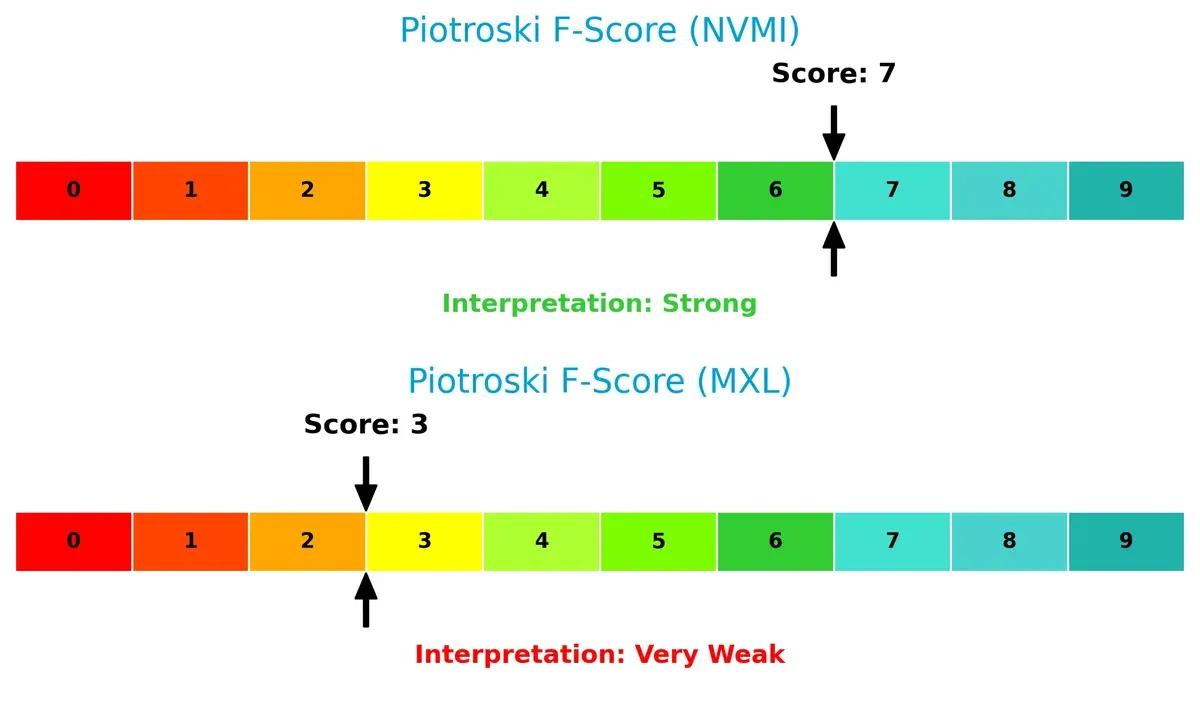
Financial Health: Quality of Operations
Nova Ltd. scores a strong 7 on the Piotroski F-Score, indicating solid financial health and operational quality. MaxLinear’s weak score of 3 raises red flags about its internal metrics and earnings quality:
How are the two companies positioned?
This section dissects Nova Ltd. and MaxLinear’s operational DNA by comparing revenue distribution and internal dynamics. The goal is to confront their economic moats to reveal which model offers the most resilient competitive advantage today.
Revenue Segmentation: The Strategic Mix
The following visual comparison dissects how Nova Ltd. and MaxLinear, Inc. diversify their income streams and where their primary sector bets lie:
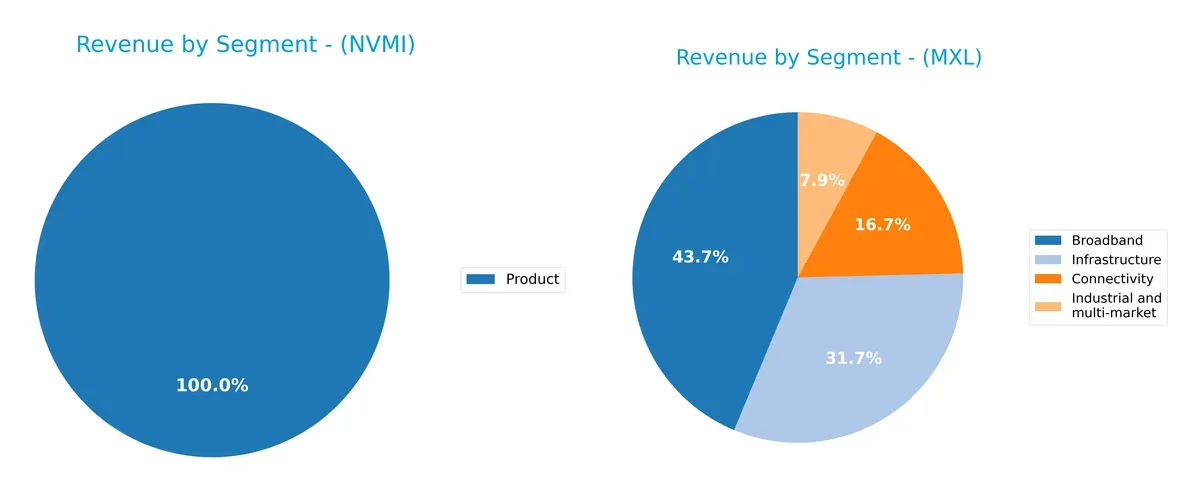
Nova Ltd. relies entirely on a single Product segment, generating $538M in 2024, signaling a focused but concentrated revenue base. MaxLinear, Inc. spreads $464M across Broadband ($204M), Infrastructure ($148M), Connectivity ($78M), and Industrial ($37M) segments in 2025, showcasing a diversified portfolio. MaxLinear’s mix reduces concentration risk and supports ecosystem lock-in, while Nova’s reliance on one segment heightens exposure to market shifts.
Strengths and Weaknesses Comparison
This table compares the Strengths and Weaknesses of Nova Ltd. and MaxLinear, Inc.:
Nova Ltd. Strengths
- High net margin and ROE indicate strong profitability
- Favorable current and quick ratios show solid liquidity
- Low debt-to-assets and excellent interest coverage support financial stability
- Product revenue growth shows focused market presence
- Efficient fixed asset turnover reflects operational strength
MaxLinear, Inc. Strengths
- Diverse product segments across broadband, connectivity, infrastructure, and industrial markets
- Positive PE ratio suggests market optimism
- Favorable current and quick ratios indicate reasonable liquidity
- Moderate debt levels maintain balance sheet health
- Global revenue exposure, especially in Asia
Nova Ltd. Weaknesses
- Unfavorable WACC and valuation multiples suggest higher capital costs and valuation risk
- Asset turnover below ideal level signals less asset efficiency
- No dividend yield may deter income-focused investors
MaxLinear, Inc. Weaknesses
- Negative net margin, ROE, and ROIC reflect poor profitability and capital returns
- Negative interest coverage signals financial distress risk
- Unfavorable asset turnover indicates operational inefficiency
- Low dividend yield and moderate PB ratio raise valuation concerns
Nova Ltd. demonstrates robust profitability and financial health but faces valuation and asset efficiency challenges. MaxLinear shows strong product diversification and geographic reach but struggles with profitability and financial stability, crucial for its turnaround strategy.
The Moat Duel: Analyzing Competitive Defensibility
A structural moat is the only reliable shield protecting long-term profits from relentless competition erosion. Let’s dissect the core moats of Nova Ltd. and MaxLinear, Inc.:
Nova Ltd.: Precision Metrology’s Intangible Asset Moat
Nova’s competitive edge rests on intangible assets—its proprietary metrology technology critical for advanced semiconductor manufacturing. This moat sustains high ROIC and margin stability. In 2026, expansion into new lithography and packaging technologies may deepen its lead but demands continuous innovation.
MaxLinear, Inc.: Integration Complexity and Cost Advantage
MaxLinear’s moat derives from its integrated RF and mixed-signal SoCs complexity, offering cost advantages in communications infrastructure. Unlike Nova’s specialized niche, MaxLinear struggles with declining ROIC and negative margins, signaling a fragile moat. Yet, 5G and fiber network growth offer disruptive expansion potential if execution improves.
Precision Tech vs. Integration Scale: The Moat Verdict
Nova’s growing ROIC and stable margins reveal a deeper, more durable moat than MaxLinear’s declining profitability and value destruction. I believe Nova is better positioned to defend market share through innovation, while MaxLinear must overcome operational challenges to sustain its edge.
Which stock offers better returns?
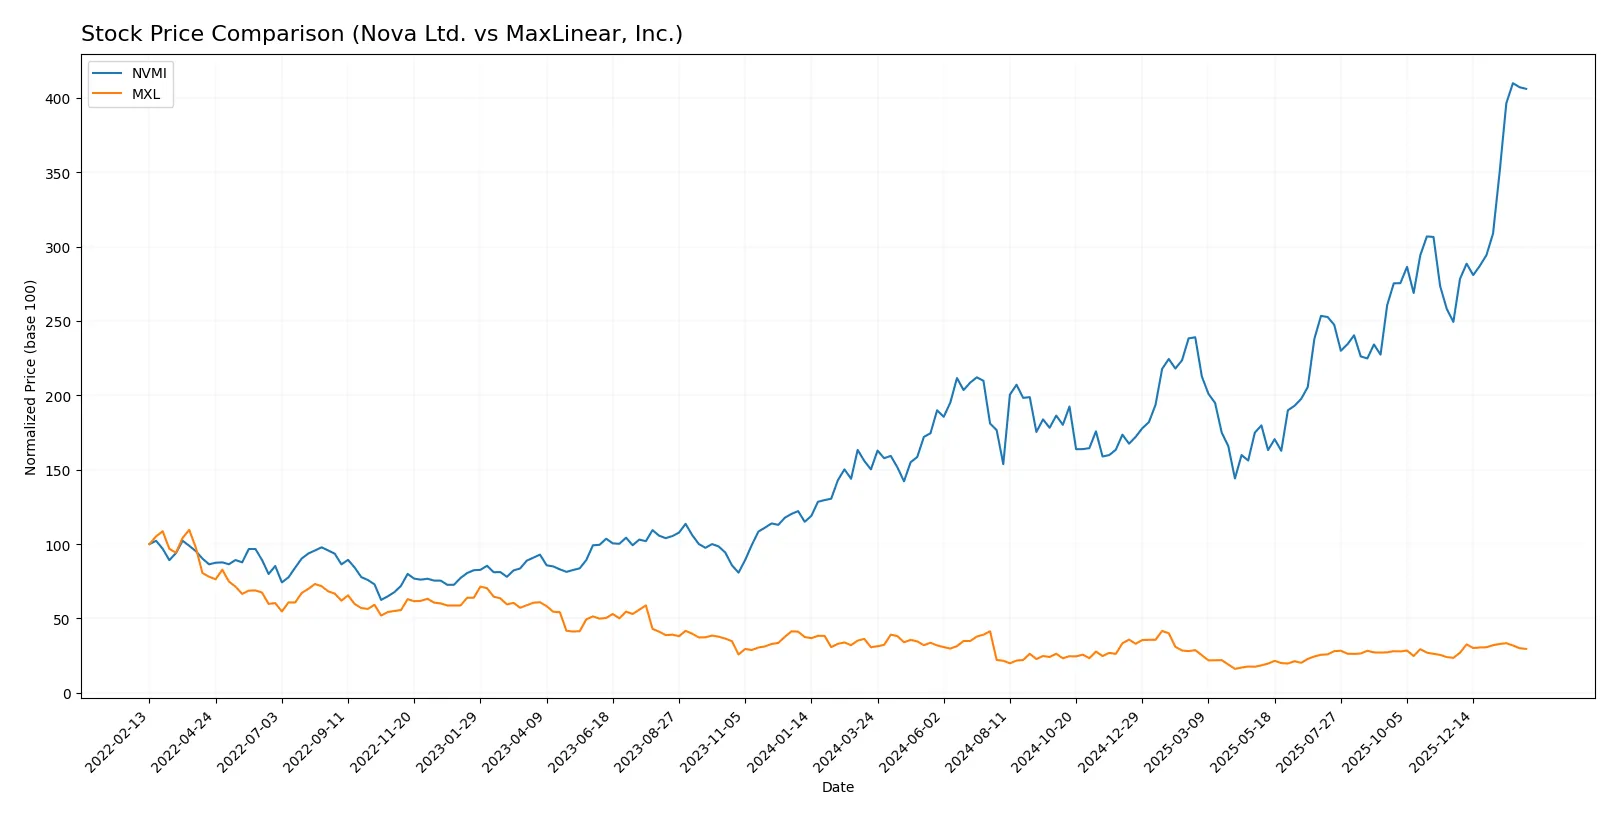
The past year shows stark divergence in price trends, with Nova Ltd. surging markedly while MaxLinear, Inc. exhibits a mild decline despite recent upticks.
Trend Comparison
Nova Ltd. (NVMI) posted a 170.31% price increase over the past 12 months, signaling a bullish trend with accelerating momentum and notable volatility (std dev 66.97). Its highest price hit 460.91, well above the 159.92 low.
MaxLinear, Inc. (MXL) recorded a -3.83% price change, reflecting a bearish trend despite acceleration. Volatility remains low (std dev 3.34) with prices ranging between 9.31 and 24.05.
Comparatively, Nova Ltd. delivered significantly stronger returns than MaxLinear, Inc., outperforming it by over 170% during the analyzed period.
Target Prices
Analysts present a mixed but constructive consensus for Nova Ltd. and MaxLinear, Inc.
| Company | Target Low | Target High | Consensus |
|---|---|---|---|
| Nova Ltd. | 335 | 500 | 408.33 |
| MaxLinear, Inc. | 15 | 25 | 21 |
Nova Ltd.’s target consensus at 408.33 sits below its current price near 456, signaling cautious optimism. MaxLinear’s consensus target of 21 exceeds its current 17.13, suggesting upside potential.

Don’t Let Luck Decide Your Entry Point
Optimize your entry points with our advanced ProRealTime indicators. You’ll get efficient buy signals with precise price targets for maximum performance. Start outperforming now!
How do institutions grade them?
The following summarizes institutional grades for Nova Ltd. and MaxLinear, Inc.:
Nova Ltd. Grades
This table displays recent grades assigned to Nova Ltd. by reputable grading firms.
| Grading Company | Action | New Grade | Date |
|---|---|---|---|
| Needham | Buy | Buy | 2026-01-20 |
| B of A Securities | Maintain | Buy | 2026-01-13 |
| Jefferies | Maintain | Buy | 2025-12-15 |
| Evercore ISI Group | Maintain | Outperform | 2025-11-07 |
| Benchmark | Maintain | Buy | 2025-11-07 |
| Cantor Fitzgerald | Maintain | Overweight | 2025-06-24 |
| B of A Securities | Maintain | Buy | 2025-06-24 |
| Citigroup | Maintain | Buy | 2025-05-09 |
| Benchmark | Maintain | Buy | 2025-05-09 |
| B of A Securities | Maintain | Buy | 2025-04-16 |
MaxLinear, Inc. Grades
Below is a summary of recent grades assigned to MaxLinear, Inc. by recognized grading companies.
| Grading Company | Action | New Grade | Date |
|---|---|---|---|
| Wells Fargo | Maintain | Equal Weight | 2026-01-30 |
| Benchmark | Maintain | Buy | 2026-01-16 |
| Benchmark | Maintain | Buy | 2025-10-24 |
| Benchmark | Maintain | Buy | 2025-10-17 |
| Benchmark | Maintain | Buy | 2025-09-02 |
| Loop Capital | Maintain | Hold | 2025-08-04 |
| Wells Fargo | Maintain | Equal Weight | 2025-07-24 |
| Benchmark | Maintain | Buy | 2025-07-24 |
| Susquehanna | Maintain | Neutral | 2025-07-24 |
| Susquehanna | Maintain | Neutral | 2025-07-22 |
Which company has the best grades?
Nova Ltd. consistently receives Buy or Outperform ratings from major firms, signaling strong institutional confidence. MaxLinear, Inc. shows mixed grades with multiple Buy ratings but also Neutral and Equal Weight, suggesting more cautious sentiment. This difference may influence investor perception of risk and growth potential.
Risks specific to each company
The following categories identify the critical pressure points and systemic threats facing both firms in the 2026 market environment:
1. Market & Competition
Nova Ltd.
- Operates in a highly specialized semiconductor metrology niche with strong technological barriers.
MaxLinear, Inc.
- Competes in broad semiconductor SoC markets with intense competition and rapid innovation cycles.
2. Capital Structure & Debt
Nova Ltd.
- Maintains low debt-to-equity (0.25) and strong interest coverage (116x), signaling financial stability.
MaxLinear, Inc.
- Slightly higher leverage (0.29 D/E) but negative interest coverage (-13x) indicates solvency risks.
3. Stock Volatility
Nova Ltd.
- Beta of 1.82 implies above-market volatility, typical for tech growth firms.
MaxLinear, Inc.
- Beta of 1.71 also indicates elevated volatility, reflecting sector cyclicality and company-specific risks.
4. Regulatory & Legal
Nova Ltd.
- Exposure to global semiconductor regulations, including export controls, given international footprint.
MaxLinear, Inc.
- Faces regulatory scrutiny in communication technology standards and data security compliance.
5. Supply Chain & Operations
Nova Ltd.
- Relies on precision manufacturing; geopolitical tensions could disrupt supply chains in key regions.
MaxLinear, Inc.
- Dependent on complex global supply chains for semiconductor components, vulnerable to bottlenecks.
6. ESG & Climate Transition
Nova Ltd.
- Moderate ESG risks due to energy-intensive manufacturing and international operations.
MaxLinear, Inc.
- Faces pressure to improve energy efficiency and sustainable sourcing in communication hardware.
7. Geopolitical Exposure
Nova Ltd.
- Significant exposure to Middle East and Asia-Pacific geopolitical tensions impacting operations.
MaxLinear, Inc.
- Primarily US-based but exposed to global telecom infrastructure geopolitical risks.
Which company shows a better risk-adjusted profile?
Nova Ltd.’s strongest risk is geopolitical exposure and supply chain fragility in volatile regions. MaxLinear’s key risk lies in poor profitability and negative interest coverage undermining financial resilience. Nova’s safer Altman Z-score (8.95 vs. 2.13) and stronger Piotroski score (7 vs. 3) indicate a superior risk-adjusted profile. Investors should note MaxLinear’s alarming negative net margin (-68%) and interest coverage, flagging urgent operational distress.
Final Verdict: Which stock to choose?
Nova Ltd. (NVMI) stands out with its superpower of mounting profitability and efficient capital use, evidenced by a steadily growing ROIC despite trading above its WACC. Its point of vigilance lies in valuation metrics, which suggest a premium price. NVMI fits well in an aggressive growth portfolio seeking quality earnings expansion.
MaxLinear, Inc. (MXL) offers a strategic moat through its strong R&D focus and a solid current ratio, suggesting operational resilience. However, it suffers from declining profitability and value destruction, which increases risk relative to NVMI. MXL could suit a portfolio aiming for turnaround plays or speculative growth with patience.
If you prioritize consistent value creation and robust profitability, Nova Ltd. outshines MaxLinear due to its improving returns and strong income statement. However, if you seek a higher-risk, potential recovery scenario, MaxLinear offers better speculative upside despite weaker fundamentals. Each appeals to distinct investor profiles with different risk tolerances.
Disclaimer: Investment carries a risk of loss of initial capital. The past performance is not a reliable indicator of future results. Be sure to understand risks before making an investment decision.
Go Further
I encourage you to read the complete analyses of Nova Ltd. and MaxLinear, Inc. to enhance your investment decisions: