Home > Comparison > Technology > MU vs MXL
The strategic rivalry between Micron Technology, Inc. and MaxLinear, Inc. shapes the semiconductor sector’s evolution. Micron operates as a capital-intensive memory and storage manufacturer, while MaxLinear focuses on high-performance analog and RF communication SoCs. This analysis pits Micron’s scale and diversified product lines against MaxLinear’s niche innovation. I will determine which company presents the superior risk-adjusted profile for a balanced technology portfolio.
Table of contents
Companies Overview
Micron Technology and MaxLinear stand as pivotal players in the semiconductor industry with distinct market footprints.
Micron Technology, Inc.: Memory and Storage Powerhouse
Micron Technology dominates as a leading memory and storage provider. Its revenue stems from diverse memory products including DRAM, NAND, and NOR technologies. In 2026, Micron focuses strategically on expanding cloud server, enterprise, and mobile markets, leveraging its vast portfolio to meet rising data demand worldwide.
MaxLinear, Inc.: Integrated Communications Innovator
MaxLinear specializes in high-performance analog and mixed-signal SoCs for communications. It generates revenue through RF and broadband components used in home networking, 4G/5G infrastructure, and data transport networks. The company’s 2026 strategy revolves around enhancing integrated platform solutions to capture growth in connected home and industrial applications.
Strategic Collision: Similarities & Divergences
Both companies operate in semiconductors but pursue different philosophies. Micron relies on broad memory solutions, while MaxLinear focuses on integrated communication SoCs. Their main battleground is data transmission and connectivity infrastructure. Micron’s scale and product breadth contrast with MaxLinear’s niche focus, creating distinct risk and growth profiles for investors.
Income Statement Comparison
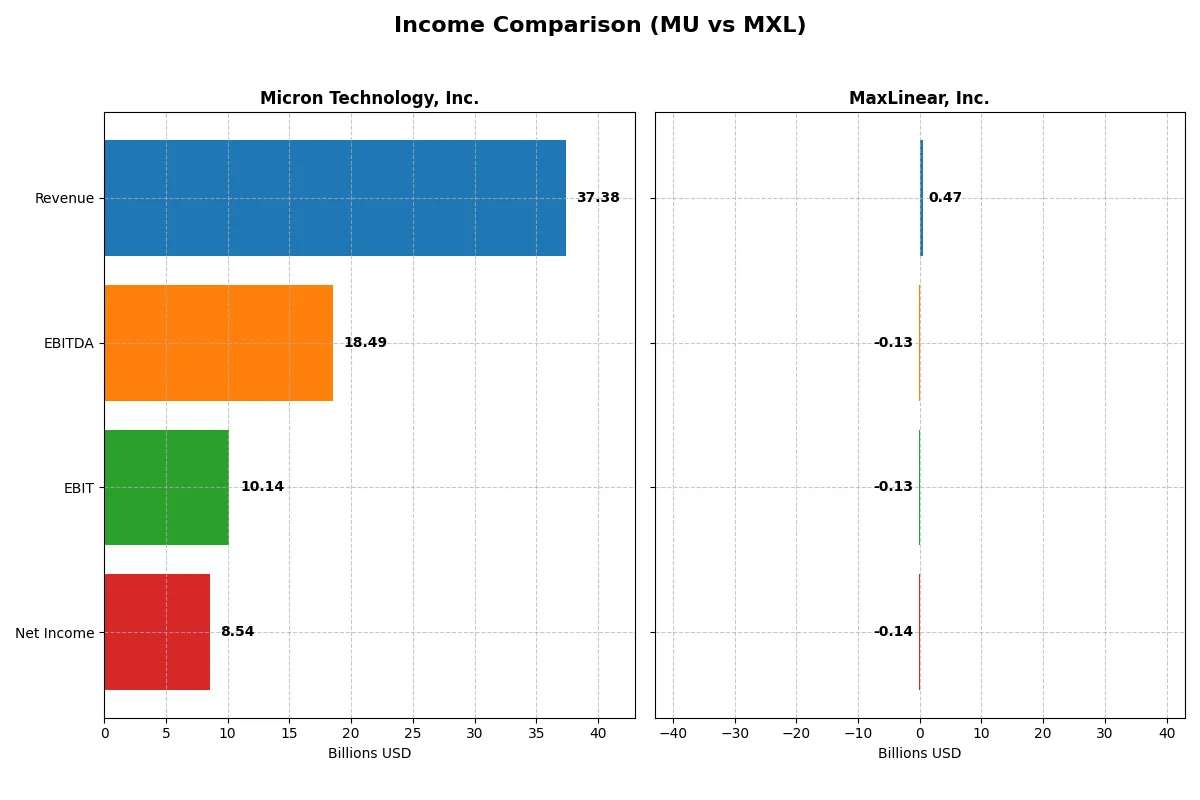
This data dissects the core profitability and scalability of both corporate engines to reveal who dominates the bottom line:
| Metric | Micron Technology, Inc. (MU) | MaxLinear, Inc. (MXL) |
|---|---|---|
| Revenue | 37.4B | 468M |
| Cost of Revenue | 22.5B | 202M |
| Operating Expenses | 5.0B | 393M |
| Gross Profit | 14.9B | 266M |
| EBITDA | 18.5B | -131M |
| EBIT | 10.1B | -131M |
| Interest Expense | 477M | 10M |
| Net Income | 8.5B | -137M |
| EPS | 7.65 | -1.58 |
| Fiscal Year | 2025 | 2025 |
Income Statement Analysis: The Bottom-Line Duel
This income statement comparison reveals which company operates its business with greater efficiency and sustainable profitability.
Micron Technology, Inc. Analysis
Micron’s revenue surged from 15.5B in 2023 to 37.4B in 2025, reflecting robust growth. Net income rebounded sharply from a 5.8B loss in 2023 to 8.5B profit in 2025. Gross and net margins improved significantly, with a 39.8% gross margin and 22.8% net margin in 2025, signaling strong operational leverage and disciplined cost control.
MaxLinear, Inc. Analysis
MaxLinear’s revenue declined overall from 1.12B in 2022 to 468M in 2025 despite a recent 30% rebound. Net income remained negative, though losses narrowed from 245M in 2024 to 137M in 2025. The company maintains a high gross margin of 56.8%, but negative EBIT and net margins (-28.0% and -29.2%) highlight ongoing profitability challenges and cost pressures.
Growth and Margin Dominance: Micron’s Scale vs. MaxLinear’s Struggles
Micron clearly dominates with strong revenue growth, margin expansion, and a profitable turnaround, outperforming sector benchmarks. MaxLinear shows margin strength but suffers from shrinking scale and persistent losses. For investors, Micron’s profile offers a more compelling combination of growth and sustainable profitability.
Financial Ratios Comparison
These vital ratios act as a diagnostic tool to expose the underlying fiscal health, valuation premiums, and capital efficiency of the companies compared below:
| Ratios | Micron Technology, Inc. (MU) | MaxLinear, Inc. (MXL) |
|---|---|---|
| ROE | 15.8% | -47.5% |
| ROIC | 12.1% | -24.3% |
| P/E | 15.9 | -6.7 |
| P/B | 2.51 | 3.20 |
| Current Ratio | 2.52 | 1.77 |
| Quick Ratio | 1.79 | 1.28 |
| D/E | 0.28 | 0.29 |
| Debt-to-Assets | 18.5% | 17.2% |
| Interest Coverage | 20.7 | -15.5 |
| Asset Turnover | 0.45 | 0.42 |
| Fixed Asset Turnover | 0.79 | 4.65 |
| Payout Ratio | 6.1% | 0% |
| Dividend Yield | 0.38% | 0% |
| Fiscal Year | 2025 | 2024 |
Efficiency & Valuation Duel: The Vital Signs
Financial ratios act as a company’s DNA, unveiling hidden risks and operational strengths to guide investors in complex markets.
Micron Technology, Inc.
Micron shows strong profitability with a 15.76% ROE and a robust 22.84% net margin, signaling operational efficiency. Its P/E of 15.94 and P/B of 2.51 suggest a fairly valued stock, neither expensive nor cheap. Shareholders receive modest dividends (0.38% yield), while the company balances reinvestment and capital returns cautiously.
MaxLinear, Inc.
MaxLinear struggles with deeply negative profitability metrics: a -47.49% ROE and a -68.01% net margin indicate operational challenges. Its negative P/E reflects losses, while a high P/B of 3.2 points to a stretched valuation. The firm does not pay dividends, opting instead to reinvest heavily in R&D, aiming to drive future growth despite current setbacks.
Premium Valuation vs. Operational Safety
Micron offers a balanced profile with solid profitability and reasonable valuation, mitigating risk amid market volatility. MaxLinear’s valuation appears stretched given its weak returns and negative earnings, increasing risk. Investors prioritizing stability find Micron more attractive, while those seeking turnaround potential might consider MaxLinear’s growth focus.
Which one offers the Superior Shareholder Reward?
I compare Micron Technology (MU) and MaxLinear (MXL) on shareholder returns through dividends and buybacks. Micron pays a modest 0.38% dividend yield with a low 6.1% payout ratio, signaling strong free cash flow coverage and room to grow distributions. MaxLinear pays no dividend, reinvesting heavily in R&D and growth. MU sustains moderate buybacks, enhancing total return reliably. MXL’s lack of buybacks and persistent losses undermine near-term shareholder reward. I conclude Micron offers a more attractive, sustainable total return profile for 2026 investors.
Comparative Score Analysis: The Strategic Profile
The radar chart reveals the core DNA and strategic trade-offs between Micron Technology, Inc. and MaxLinear, Inc.:

Micron shows a balanced profile with strengths in ROE (4) and ROA (5), indicating efficient capital and asset use. MaxLinear lags significantly in profitability metrics (ROE 1, ROA 1) but holds a slight edge in price-to-book valuation (3 vs. 2). Micron’s moderate debt-to-equity score (3) and valuation scores (PE 2, PB 2) suggest disciplined capital allocation, while MaxLinear depends heavily on valuation appeal amid weaker fundamentals.
Bankruptcy Risk: Solvency Showdown
Micron’s Altman Z-Score (12.3) places it firmly in the safe zone, signaling robust solvency. MaxLinear’s score (2.1) falls in the grey zone, implying moderate bankruptcy risk under stress:
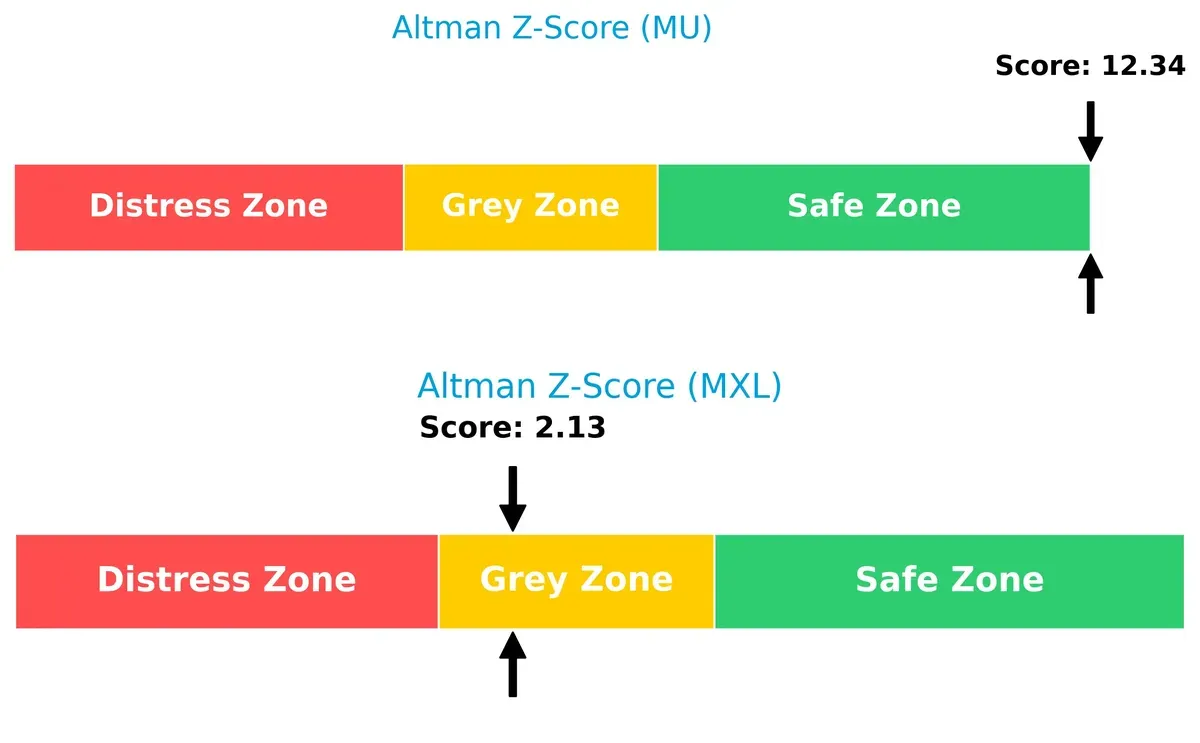
This wide delta highlights Micron’s superior financial resilience in this late-cycle environment, whereas MaxLinear faces greater uncertainty due to weaker leverage and liquidity buffers.
Financial Health: Quality of Operations
Micron’s Piotroski F-Score of 7 reflects strong internal financial health, signaling efficient operations and low red flags. MaxLinear’s score of 3 indicates very weak fundamentals and operational concerns:
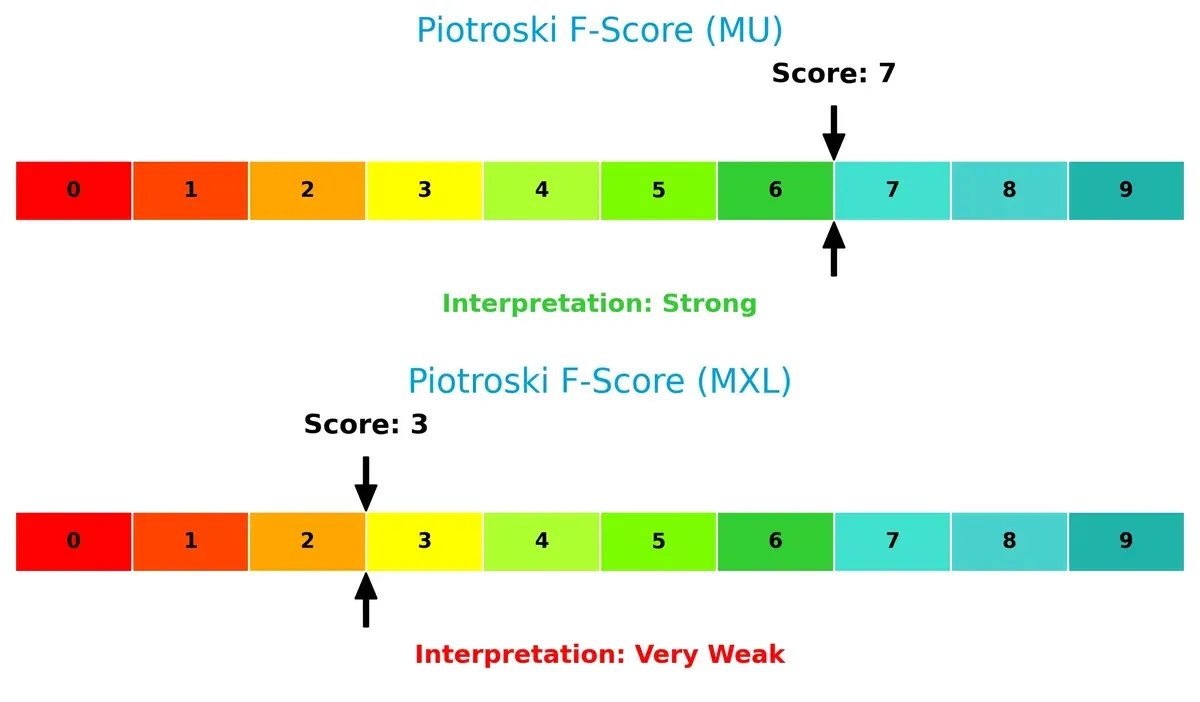
I view Micron as the safer choice for investors prioritizing quality and stability. MaxLinear’s weaker score warns of potential internal inefficiencies that could impair long-term performance.
How are the two companies positioned?
This section dissects the operational DNA of MU and MXL by comparing their revenue distribution by segment and internal dynamics. The goal is to confront their economic moats to identify which model offers the most resilient competitive advantage today.
Revenue Segmentation: The Strategic Mix
This visual comparison dissects how Micron Technology, Inc. and MaxLinear, Inc. diversify their income streams and highlights their primary sector bets:
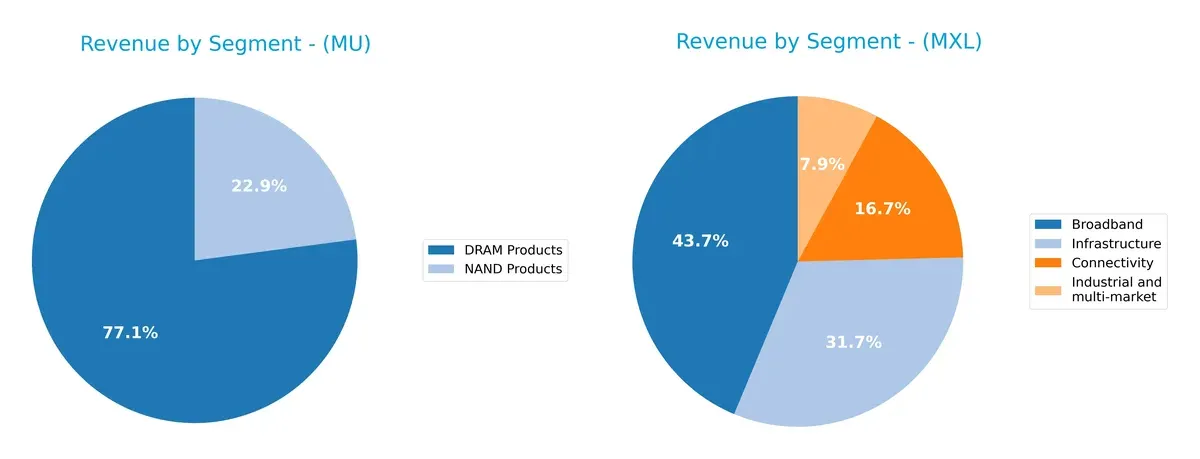
Micron anchors its revenue in DRAM Products with $28.6B in 2025, dwarfing NAND at $8.5B. This concentration signals a strategic bet on memory dominance but entails exposure to cyclical memory demand. MaxLinear spreads its $457M across Broadband ($204M), Infrastructure ($148M), Connectivity ($78M), and Industrial markets ($37M), reflecting a balanced portfolio that mitigates concentration risk and leverages diversified infrastructure and connectivity growth.
Strengths and Weaknesses Comparison
This table compares the Strengths and Weaknesses of Micron Technology, Inc. and MaxLinear, Inc.:
Micron Technology Strengths
- Strong profitability with 22.84% net margin
- Favorable liquidity ratios with current ratio 2.52
- Low debt levels at 0.28 debt-to-equity
- Diversified product segments including DRAM and NAND
- Significant global presence with large US and Taiwan revenue
MaxLinear Strengths
- Favorable price-to-earnings ratio despite losses
- Positive liquidity with current ratio 1.77
- Low debt-to-equity 0.29
- Favorable fixed asset turnover at 4.65
- Diversified end markets including broadband and industrial
Micron Technology Weaknesses
- Unfavorable return on invested capital at 12.12% below 22.1% WACC
- Asset turnover ratios weak at 0.45
- Low dividend yield at 0.38%
- Moderate exposure concentration in US and Taiwan markets
MaxLinear Weaknesses
- Substantial losses with -68.01% net margin and negative ROE
- Negative interest coverage at -13.01
- Unfavorable price-to-book ratio at 3.2
- Asset turnover below 1 at 0.42
- No dividend yield
Micron shows solid profitability and financial stability but faces challenges in capital efficiency and dividend returns. MaxLinear struggles with profitability and interest coverage but maintains operational asset efficiency and broad market exposure. These factors shape each company’s strategic focus on improving weaknesses while leveraging core strengths.
The Moat Duel: Analyzing Competitive Defensibility
A structural moat is the only true shield protecting long-term profits from relentless competition and market disruption. Let’s dissect these two semiconductors giants:
Micron Technology, Inc.: Scale-Driven Cost Advantage
Micron’s moat stems from its massive scale and manufacturing expertise, driving cost efficiencies. Its stable margins and growing profitability confirm this advantage. New memory tech could widen its lead in 2026.
MaxLinear, Inc.: Niche Product Innovation
MaxLinear relies on specialized RF and mixed-signal SoCs for communications infrastructure, a distinct moat versus Micron’s broad memory focus. Yet, declining ROIC signals margin pressure. Market diversification could reverse this trend.
Scale Power vs. Specialized Innovation: The Moat Verdict
Micron’s scale-driven cost moat is wider and more durable than MaxLinear’s niche innovation moat. Micron’s improving profitability and margin stability better equip it to defend market share in 2026. MaxLinear faces tougher challenges sustaining value creation.
Which stock offers better returns?
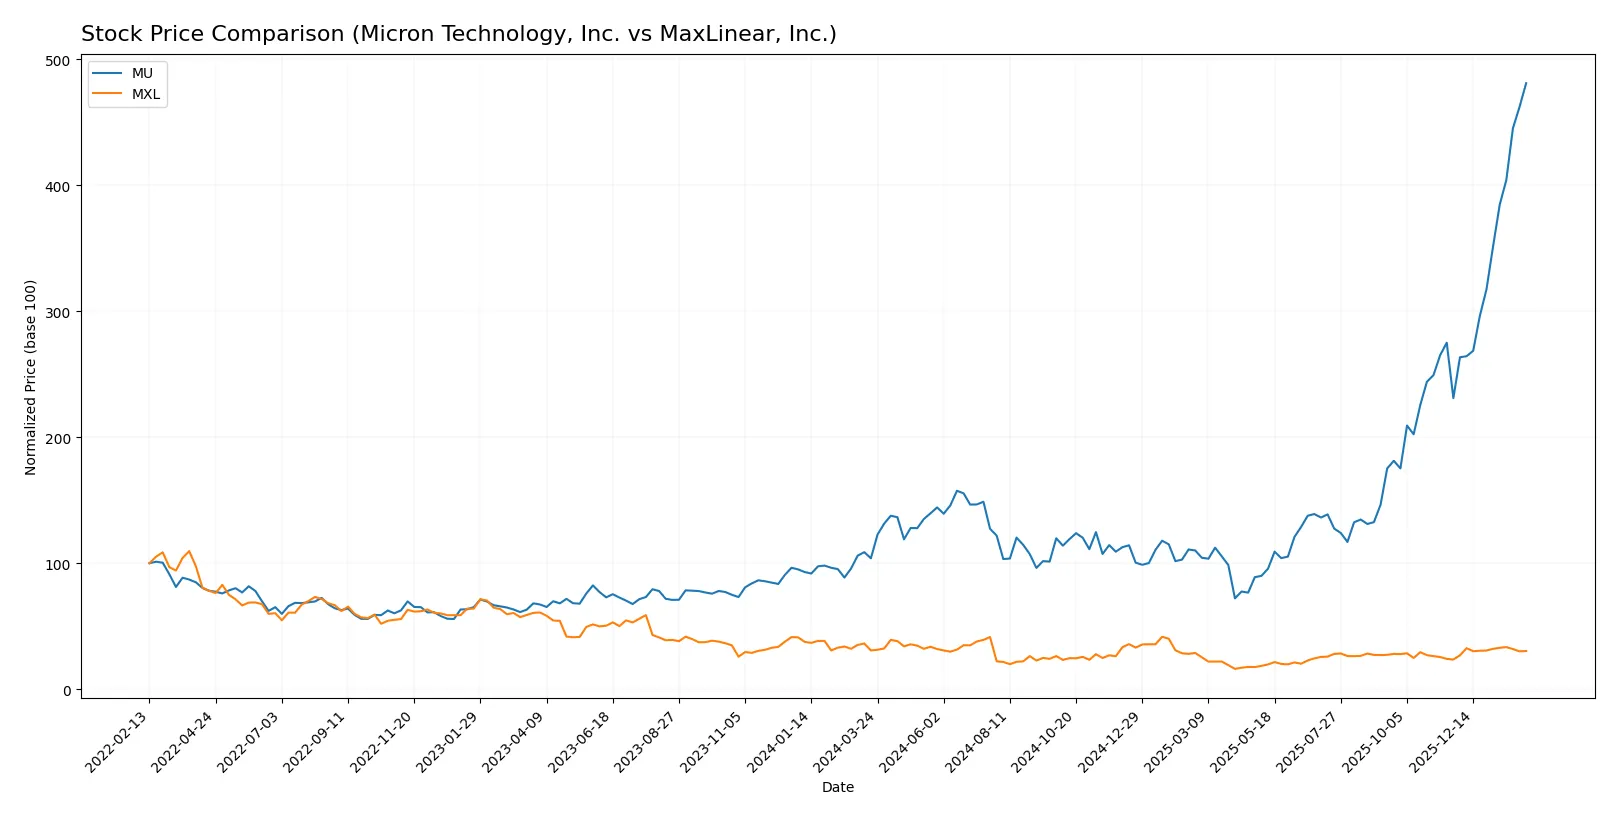
The past year shows Micron Technology’s stock surging sharply, driven by accelerating gains and strong buyer dominance. MaxLinear’s shares, however, reveal a modest decline with recent mild recovery signs.
Trend Comparison
Micron Technology’s stock posted a 363.02% gain over the past 12 months, an accelerating bullish trend with a wide trading range from 65 to 432 and high volatility.
MaxLinear’s stock declined 1.24% over the same period, reflecting a bearish trend despite accelerating momentum and limited price volatility between 9.31 and 24.05.
Micron Technology outperformed MaxLinear significantly, delivering the highest market returns with strong volume support and pronounced upward acceleration.
Target Prices
Analysts present a cautiously optimistic consensus on Micron Technology and MaxLinear, reflecting varied upside potential.
| Company | Target Low | Target High | Consensus |
|---|---|---|---|
| Micron Technology, Inc. | 190 | 480 | 345.61 |
| MaxLinear, Inc. | 15 | 25 | 21 |
Micron’s consensus target of 345.61 falls below its current price near 419, signaling possible overvaluation. MaxLinear’s 21 consensus exceeds its 17 price, suggesting modest upside.

Don’t Let Luck Decide Your Entry Point
Optimize your entry points with our advanced ProRealTime indicators. You’ll get efficient buy signals with precise price targets for maximum performance. Start outperforming now!
How do institutions grade them?
Micron Technology, Inc. Grades
The table below summarizes recent grades from major institutions for Micron Technology, Inc.:
| Grading Company | Action | New Grade | Date |
|---|---|---|---|
| Mizuho | Maintain | Outperform | 2026-01-27 |
| Stifel | Maintain | Buy | 2026-01-20 |
| Rosenblatt | Maintain | Buy | 2026-01-20 |
| TD Cowen | Maintain | Buy | 2026-01-20 |
| Citigroup | Maintain | Buy | 2026-01-15 |
| Wells Fargo | Maintain | Overweight | 2026-01-15 |
| Cantor Fitzgerald | Maintain | Overweight | 2026-01-14 |
| Keybanc | Maintain | Overweight | 2026-01-13 |
| B of A Securities | Maintain | Buy | 2026-01-13 |
| Lynx Global | Maintain | Buy | 2026-01-12 |
MaxLinear, Inc. Grades
Below is a summary of recent institutional grades for MaxLinear, Inc.:
| Grading Company | Action | New Grade | Date |
|---|---|---|---|
| Wells Fargo | Maintain | Equal Weight | 2026-01-30 |
| Benchmark | Maintain | Buy | 2026-01-16 |
| Benchmark | Maintain | Buy | 2025-10-24 |
| Benchmark | Maintain | Buy | 2025-10-17 |
| Benchmark | Maintain | Buy | 2025-09-02 |
| Loop Capital | Maintain | Hold | 2025-08-04 |
| Wells Fargo | Maintain | Equal Weight | 2025-07-24 |
| Benchmark | Maintain | Buy | 2025-07-24 |
| Susquehanna | Maintain | Neutral | 2025-07-24 |
| Susquehanna | Maintain | Neutral | 2025-07-22 |
Which company has the best grades?
Micron Technology consistently receives stronger grades, mainly Buy and Outperform ratings. MaxLinear’s grades cluster around Buy and Equal Weight with some Hold and Neutral ratings. Investors might view Micron’s grades as signaling higher confidence from analysts.
Risks specific to each company
The following categories identify the critical pressure points and systemic threats facing both firms in the 2026 market environment:
1. Market & Competition
Micron Technology, Inc.
- Dominates memory and storage markets with broad product range but faces intense semiconductor cyclicality.
MaxLinear, Inc.
- Specializes in RF and mixed-signal SoCs with niche markets but struggles against larger competitors and innovation pace.
2. Capital Structure & Debt
Micron Technology, Inc.
- Maintains low debt-to-equity (0.28) with strong interest coverage (21.26), indicating solid financial stability.
MaxLinear, Inc.
- Similar debt-to-equity (0.29) but negative interest coverage (-13.01) signals liquidity stress and higher refinancing risk.
3. Stock Volatility
Micron Technology, Inc.
- Beta of 1.505 reflects moderate volatility typical in semiconductors but manageable for diversified portfolios.
MaxLinear, Inc.
- Higher beta at 1.708 indicates above-average volatility, increasing risk for risk-averse investors.
4. Regulatory & Legal
Micron Technology, Inc.
- Subject to global trade tensions impacting supply and sales, especially US-China semiconductor restrictions.
MaxLinear, Inc.
- Faces regulatory scrutiny in communications technology but lower exposure to geopolitical trade barriers.
5. Supply Chain & Operations
Micron Technology, Inc.
- Complex global supply chains expose it to chip shortages and raw material price swings.
MaxLinear, Inc.
- Smaller scale reduces supply chain complexity but limits bargaining power and scale efficiencies.
6. ESG & Climate Transition
Micron Technology, Inc.
- Increasing pressure to reduce carbon footprint in energy-intensive semiconductor manufacturing.
MaxLinear, Inc.
- Faces ESG challenges in sourcing materials and ensuring sustainable product lifecycle management.
7. Geopolitical Exposure
Micron Technology, Inc.
- High exposure to US-China tensions affecting manufacturing and sales channels.
MaxLinear, Inc.
- Lower geopolitical exposure but vulnerable to US regulatory changes in communications sector.
Which company shows a better risk-adjusted profile?
Micron’s prime risk is its exposure to semiconductor market cyclicality and geopolitical tensions. MaxLinear’s greatest threat lies in its poor profitability and liquidity, evidenced by negative margins and interest coverage. Micron’s strong balance sheet and safer Altman Z-score (12.3) indicate a superior risk-adjusted profile. MaxLinear remains in the “grey zone” for bankruptcy risk with a weak Piotroski score (3), underscoring financial vulnerability. Recent data confirm Micron’s consistent dividend and stable liquidity buffer, reinforcing my confidence in its resilience.
Final Verdict: Which stock to choose?
Micron Technology’s superpower lies in its robust profitability and cash-generating ability, evident in its strong margins and improving earnings. The key point of vigilance is its ROIC falling short of the cost of capital, signaling value destruction despite rising profitability. This stock suits an aggressive growth portfolio willing to navigate cyclical risks.
MaxLinear offers a strategic moat through its focus on specialized semiconductor niches with a decent recurring revenue base. It presents a safer balance sheet than Micron but struggles with profitability and declining returns on capital. It fits a more speculative or turnaround-oriented portfolio seeking potential value in distressed assets.
If you prioritize strong profitability and growth momentum, Micron Technology outshines with a more resilient income profile and market traction. However, if you seek a speculative play with a niche focus and relatively lower leverage, MaxLinear offers better stability but demands tolerance for ongoing value erosion and operational challenges.
Disclaimer: Investment carries a risk of loss of initial capital. The past performance is not a reliable indicator of future results. Be sure to understand risks before making an investment decision.
Go Further
I encourage you to read the complete analyses of Micron Technology, Inc. and MaxLinear, Inc. to enhance your investment decisions: