Home > Comparison > Technology > MCHP vs MXL
The strategic rivalry between Microchip Technology Incorporated and MaxLinear, Inc. shapes the semiconductor sector’s competitive landscape. Microchip operates as a diversified embedded control solutions leader with a broad product portfolio, while MaxLinear specializes in high-performance analog and mixed-signal communication SoCs. This analysis pits Microchip’s scale and legacy against MaxLinear’s niche innovation to determine which offers superior risk-adjusted returns for a well-diversified portfolio in technology.
Table of contents
Companies Overview
Microchip Technology Incorporated and MaxLinear, Inc. both play pivotal roles in the semiconductor industry’s evolving landscape.
Microchip Technology Incorporated: Embedded Control Solutions Leader
Microchip Technology dominates the embedded control market through sales of microcontrollers and analog products. Its core revenue engine stems from diverse microcontroller offerings and specialized analog components. In 2026, the company emphasizes expanding secure and connected solutions across automotive, industrial, and communications sectors, reinforcing its leadership in embedded innovation.
MaxLinear, Inc.: High-Performance Communications SoCs Specialist
MaxLinear focuses on providing integrated SoCs for RF, analog, and mixed-signal communications systems. Its primary revenue driver is the supply of broadband transceivers and networking components for wired and wireless infrastructure. The firm’s 2026 strategy centers on advancing high-speed connectivity solutions for data centers, 5G infrastructure, and home networking applications.
Strategic Collision: Similarities & Divergences
Both companies target semiconductor markets but diverge in approach; Microchip prioritizes embedded control with a broad product range, while MaxLinear focuses on integrated communications SoCs. Their competitive battleground lies in connectivity solutions—Microchip with secure embedded chips, MaxLinear with high-speed communications platforms. These differences shape distinct investment profiles: Microchip offers scale and product diversity; MaxLinear leans into niche, cutting-edge network technologies.
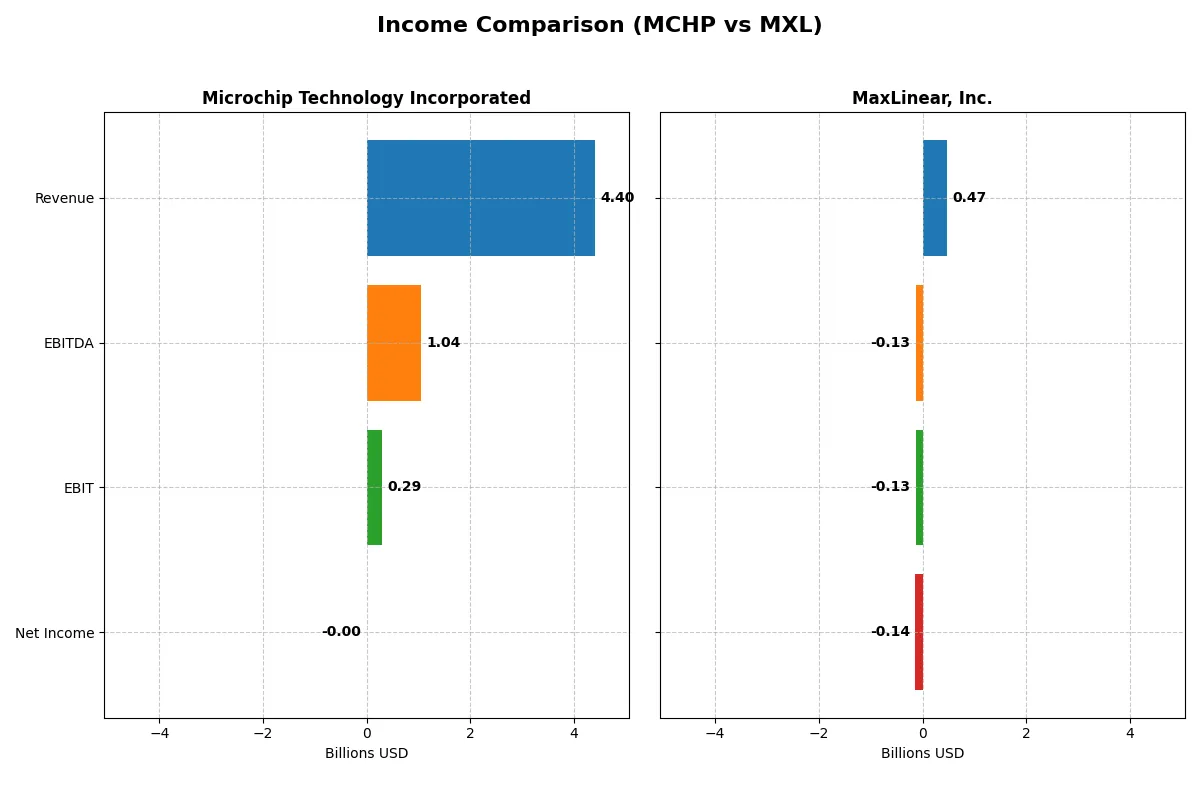
Income Statement Comparison
This data dissects the core profitability and scalability of both corporate engines to reveal who dominates the bottom line:
| Metric | Microchip Technology Incorporated (MCHP) | MaxLinear, Inc. (MXL) |
|---|---|---|
| Revenue | 4.4B | 468M |
| Cost of Revenue | 1.93B | 202M |
| Operating Expenses | 2.17B | 393M |
| Gross Profit | 2.47B | 266M |
| EBITDA | 1.04B | -131M |
| EBIT | 290M | -131M |
| Interest Expense | 251M | 10M |
| Net Income | -0.5M | -137M |
| EPS | -0.005 | -1.58 |
| Fiscal Year | 2025 | 2025 |
Income Statement Analysis: The Bottom-Line Duel
This income statement comparison exposes which company drives profitability and operational efficiency more effectively through recent financial performance.
Microchip Technology Incorporated Analysis
Microchip’s revenue declined sharply from 8.4B in 2023 to 4.4B in 2025, dragging net income from 2.2B to a slight loss in 2025. Its gross margin stays healthy at 56%, but net margin collapses to near zero, reflecting severe pressure on profitability. The latest fiscal year reveals a steep earnings drop, signaling operational challenges and eroding momentum.
MaxLinear, Inc. Analysis
MaxLinear shows a modest revenue rebound to 468M in 2025 after prior declines, with net losses narrowing from -245M in 2024 to -137M in 2025. Its gross margin remains solid near 57%, but the EBIT margin stays deeply negative, reflecting ongoing operating inefficiencies. However, recent growth rates indicate improving top-line momentum and better cost control.
Margin Stability vs. Recovery Trajectory
Microchip dominates with scale and historically strong profitability but faces a sharp downturn eroding net margins and earnings. MaxLinear is smaller and loss-making but posts favorable recent growth and margin expansion trends. For investors, Microchip’s entrenched scale contrasts with MaxLinear’s potential turnaround profile, reflecting different risk-reward trade-offs.
Financial Ratios Comparison
These vital ratios act as a diagnostic tool to expose the underlying fiscal health, valuation premiums, and capital efficiency of the companies compared below:
| Ratios | Microchip Technology Incorporated (MCHP) | MaxLinear, Inc. (MXL) |
|---|---|---|
| ROE | -0.007% (2025) | -47.49% (2024) |
| ROIC | -0.027% (2025) | -24.31% (2024) |
| P/E | -52,021 (2025) | -6.74 (2024) |
| P/B | 3.67 (2025) | 3.20 (2024) |
| Current Ratio | 2.59 (2025) | 1.77 (2024) |
| Quick Ratio | 1.47 (2025) | 1.28 (2024) |
| D/E | 0.80 (2025) | 0.29 (2024) |
| Debt-to-Assets | 0.37 (2025) | 0.17 (2024) |
| Interest Coverage | 1.18 (2025) | -15.52 (2024) |
| Asset Turnover | 0.29 (2025) | 0.42 (2024) |
| Fixed Asset Turnover | 3.72 (2025) | 4.65 (2024) |
| Payout ratio | -1951.4% (2025) | 0% (2024) |
| Dividend yield | 3.75% (2025) | 0% (2024) |
| Fiscal Year | 2025 | 2024 |
Efficiency & Valuation Duel: The Vital Signs
Financial ratios form a company’s DNA, exposing both hidden risks and operational strengths essential for investment insight.
Microchip Technology Incorporated
Microchip shows weak profitability with negative ROE and marginal net margins, indicating operational challenges. Its P/E is unusually favorable but paired with a stretched P/B of 3.67, suggesting valuation concerns. The company supports shareholders with a 3.75% dividend yield, balancing modest returns amid reinvestment in R&D (22% of revenue).
MaxLinear, Inc.
MaxLinear exhibits severely negative profitability metrics, including a -47.5% ROE and a -68% net margin. Despite a low negative P/E, its valuation looks stretched given a P/B of 3.2. The company pays no dividends, focusing heavily on R&D, investing over 62% of revenue, reflecting a growth-oriented but high-risk profile.
Dividend Yield vs. Profitability Struggles
Microchip offers a better dividend yield and a more balanced capital structure despite operational headwinds. MaxLinear’s higher R&D intensity contrasts with its deeper losses and lack of shareholder payouts. Investors seeking income may prefer Microchip’s profile, while those tolerant of risk might consider MaxLinear’s growth emphasis.
Which one offers the Superior Shareholder Reward?
I observe Microchip Technology Incorporated (MCHP) pays dividends with a 3.75% yield and a payout ratio near 48%, supported by strong free cash flow of 4.8B. Its buybacks are steady, enhancing total returns. MaxLinear, Inc. (MXL) pays no dividends and struggles with negative margins and cash flow, despite modest buybacks. MCHP’s balanced dividend and buyback strategy is more sustainable and delivers a superior total return profile in 2026. I favor MCHP for disciplined capital allocation and shareholder reward.
Comparative Score Analysis: The Strategic Profile
The radar chart reveals the fundamental DNA and trade-offs of Microchip Technology Incorporated and MaxLinear, Inc., highlighting their financial strengths and weaknesses:
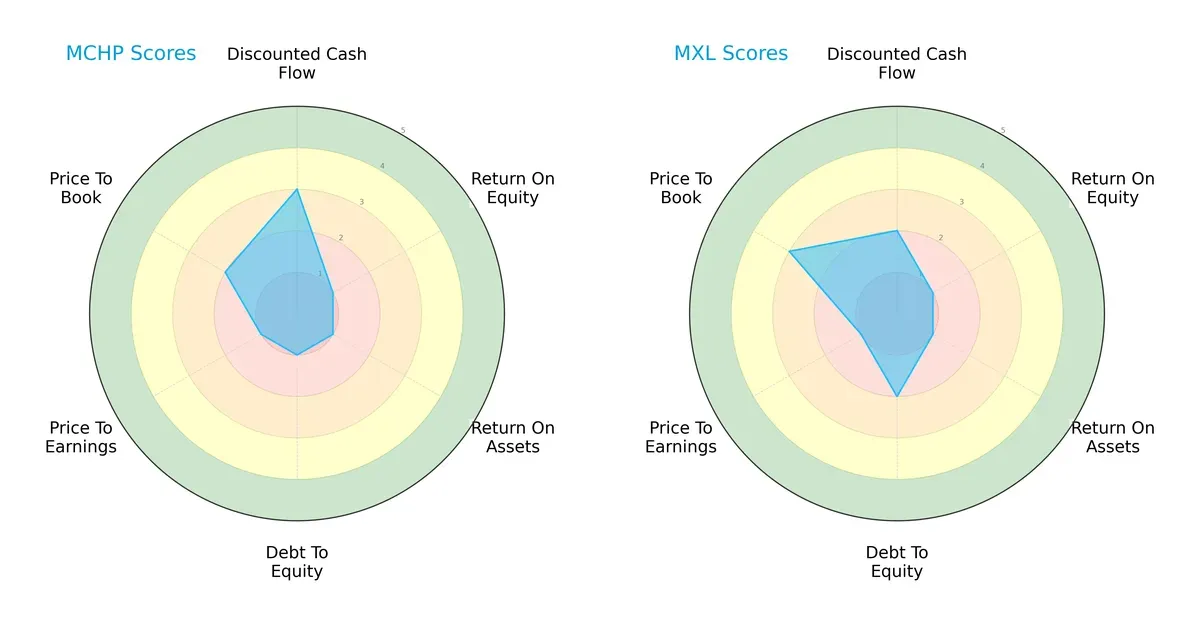
Microchip shows a sharper edge in discounted cash flow with a score of 3, signaling moderate valuation appeal. MaxLinear scores better in debt management (2 vs. 1), suggesting a more balanced financial risk profile. Both companies suffer from very unfavorable returns on equity and assets (1 each), and low price-to-earnings scores, indicating operational challenges and valuation concerns. MaxLinear edges out with a higher price-to-book score (3 vs. 2), hinting at better market perception or asset valuation. Overall, MaxLinear presents a more balanced profile, while Microchip relies heavily on cash flow valuation.
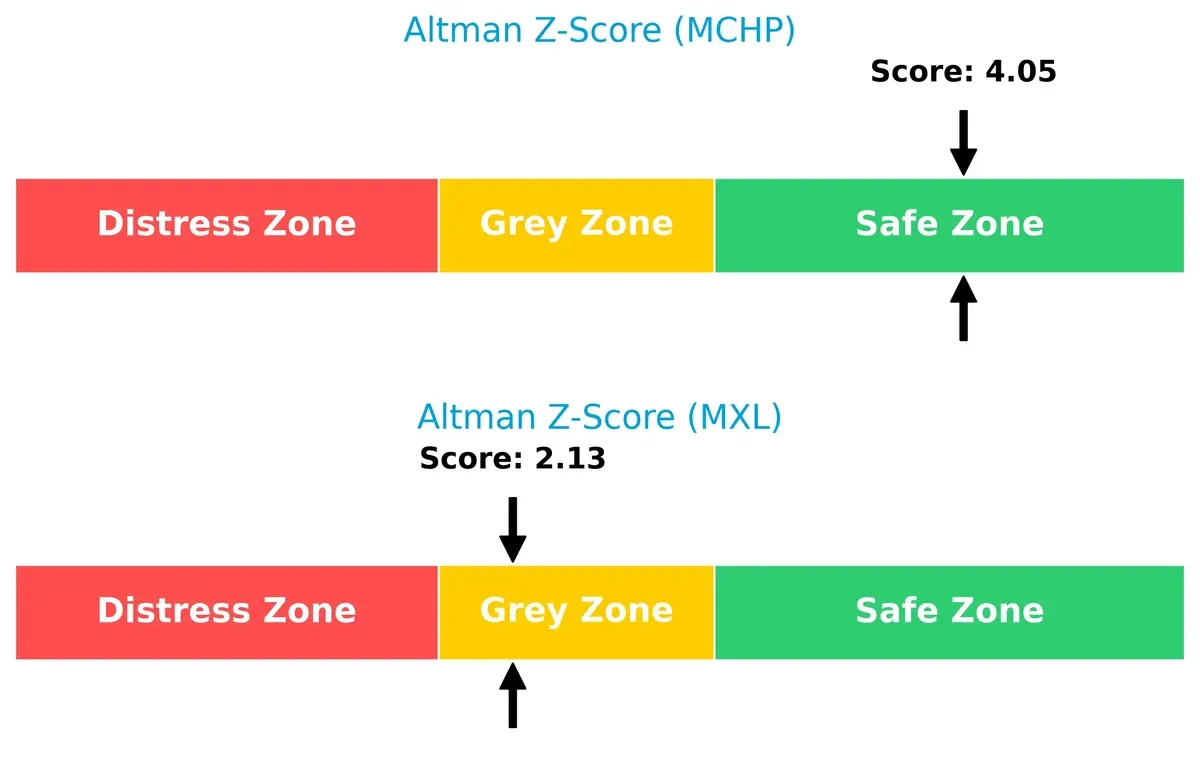
Bankruptcy Risk: Solvency Showdown
Microchip’s Altman Z-Score of 4.05 places it firmly in the safe zone, while MaxLinear’s 2.13 situates it in the grey zone. This gap signals stronger long-term solvency odds for Microchip in this cycle:
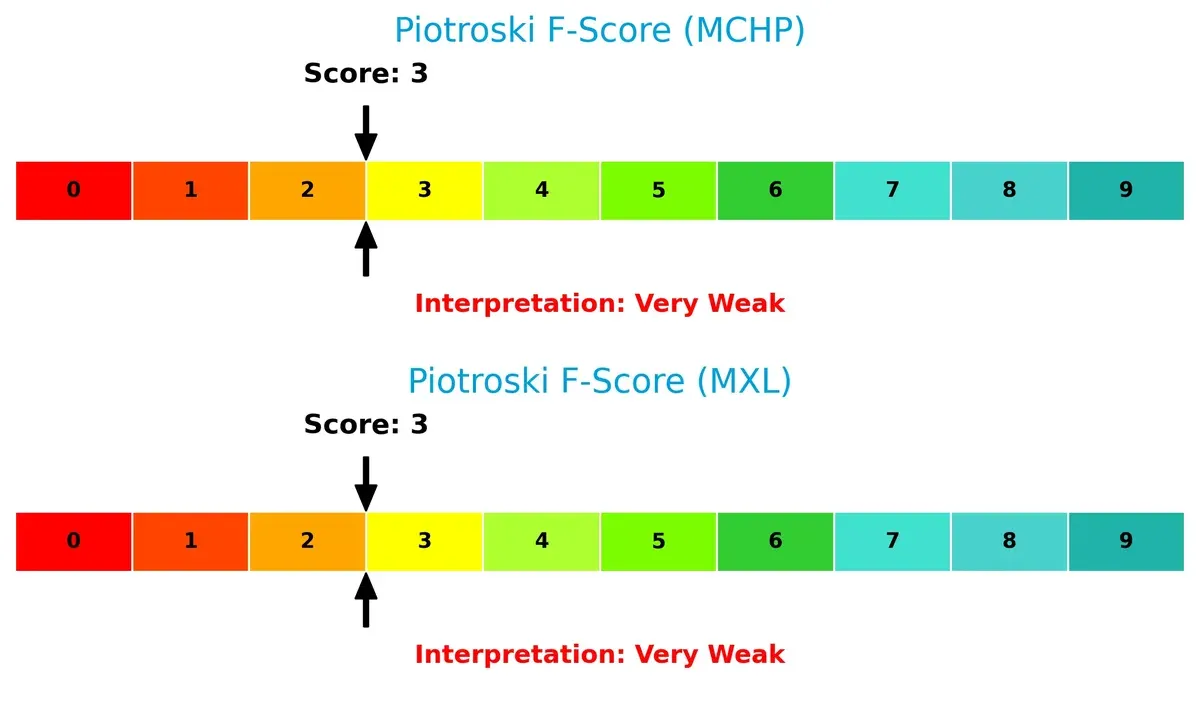
Financial Health: Quality of Operations
Both firms score a low 3 on the Piotroski F-Score, indicating very weak financial health. Neither shows robust internal metrics, signaling red flags in operational efficiency and financial quality:
How are the two companies positioned?
This section dissects the operational DNA of Microchip Technology and MaxLinear by comparing their revenue distribution and internal strengths and weaknesses. The goal is to confront their economic moats and identify which model offers the most resilient competitive advantage today.
Revenue Segmentation: The Strategic Mix
This visual comparison dissects how Microchip Technology Incorporated and MaxLinear, Inc. diversify their income streams and where their primary sector bets lie:
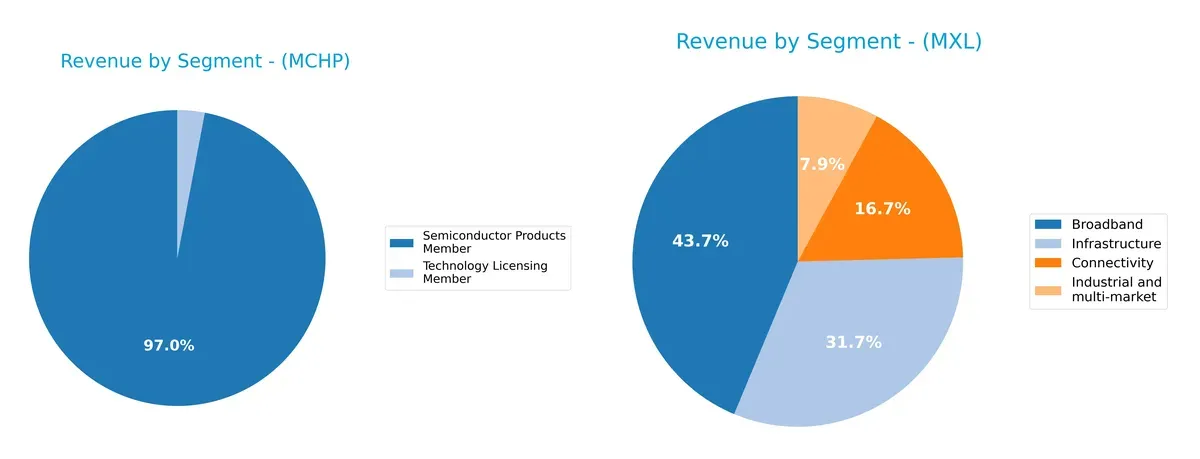
Microchip Technology anchors revenue heavily in Semiconductor Products with $4.27B in 2025, while Technology Licensing contributes a modest $131M. MaxLinear, however, presents a more balanced mix: Broadband leads at $204M, followed by Infrastructure ($148M), Connectivity ($78M), and Industrial ($37M). Microchip’s concentration signals reliance on semiconductor innovation and ecosystem lock-in. MaxLinear’s diversified segments reduce concentration risk and position it well across multiple markets.
Strengths and Weaknesses Comparison
This table compares the strengths and weaknesses of Microchip Technology Incorporated (MCHP) and MaxLinear, Inc. (MXL):
MCHP Strengths
- Strong semiconductor product revenue stream
- Favorable current and quick ratios indicate liquidity
- Attractive dividend yield of 3.75%
- Efficient fixed asset turnover
MXL Strengths
- Diversified product segments across broadband, connectivity, industrial, infrastructure
- Favorable debt-to-equity and debt-to-assets ratios
- Solid fixed asset turnover
- Favorable PE ratio despite losses
MCHP Weaknesses
- Negative profitability metrics (net margin, ROE, ROIC)
- Unfavorable interest coverage and asset turnover
- Elevated price-to-book ratio
- Slightly unfavorable overall financial ratios
MXL Weaknesses
- Deeply negative profitability ratios (net margin, ROE, ROIC)
- Unfavorable WACC and interest coverage
- Zero dividend yield
- Unfavorable asset turnover and high overall financial risk
Both companies show liquidity strength and asset efficiency. However, profitability challenges and negative returns weigh on both firms, with MXL facing more severe financial risk. These factors highlight the need for strategic focus on improving operational efficiency and capital returns.
The Moat Duel: Analyzing Competitive Defensibility
A structural moat alone shields long-term profits from relentless competitive pressure and margin erosion. Let’s dissect the moat dynamics of these two semiconductor players:
Microchip Technology Incorporated: Intangible Assets & Scale Advantage
Microchip’s moat stems from its extensive portfolio of embedded control solutions and proprietary SuperFlash tech. This drives stable gross margins near 56%, despite declining revenue and net income. However, shrinking ROIC warns of weakening capital efficiency. New product innovation in automotive and industrial IoT could either deepen or strain this moat by 2026.
MaxLinear, Inc.: Integrated Systems & Market Adaptability
MaxLinear’s competitive edge lies in highly integrated RF and mixed-signal SoCs tailored for broadband and 5G infrastructure. Its moat contrasts with Microchip’s by leaning on rapid revenue growth (30% last year) and improving operational leverage, though profitability remains elusive. Expansion into emerging connectivity markets may accelerate moat reinforcement in 2026.
Legacy Scale vs. Agile Innovation: Who Holds the Deeper Moat?
Both firms suffer declining ROIC, signaling value destruction, but Microchip maintains higher margin stability due to scale and proprietary tech. MaxLinear’s faster growth highlights a nimble approach but lacks profitability. I see Microchip’s moat as wider due to entrenched assets, while MaxLinear’s remains narrower but potentially deeper if operational improvements sustain. Microchip is better positioned currently to defend its market share amid intensifying semiconductor competition.
Which stock offers better returns?
Over the past 12 months, Microchip Technology and MaxLinear exhibited distinct price movements with varying volatility and buyer dominance, highlighting divergent trading dynamics in a challenging market.
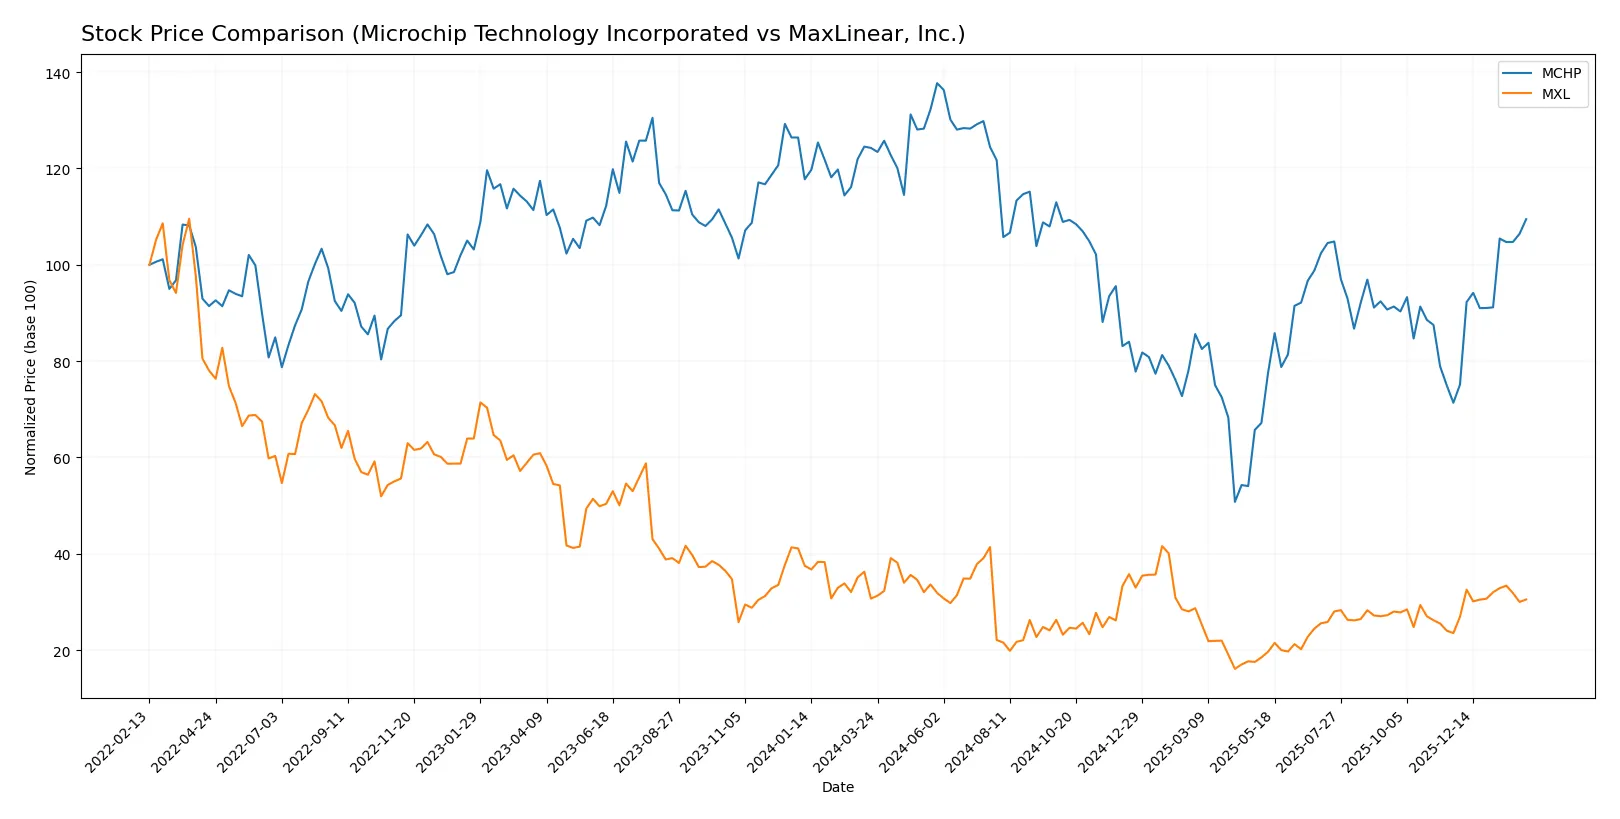
Trend Comparison
Microchip Technology’s stock fell 11.91% over the past year, signaling a bearish trend with accelerating decline. It showed high volatility, hitting a low of 36.22 and a high of 98.23.
MaxLinear’s stock declined 0.62% in the same period, also bearish but with much lower volatility. The trend accelerated mildly, with prices ranging between 9.31 and 24.05.
Microchip’s recent strong rebound (+53.4%) outperformed MaxLinear’s +29.71% rally, indicating higher short-term momentum despite a weaker full-year performance.
Target Prices
Analysts show a moderately bullish consensus for Microchip Technology and MaxLinear.
| Company | Target Low | Target High | Consensus |
|---|---|---|---|
| Microchip Technology Incorporated | 60 | 100 | 82.46 |
| MaxLinear, Inc. | 15 | 25 | 21 |
Microchip’s consensus target of 82.46 slightly exceeds its current price of 78.08, signaling modest upside. MaxLinear’s 21 target also suggests potential gains above its 17.64 market price.

Don’t Let Luck Decide Your Entry Point
Optimize your entry points with our advanced ProRealTime indicators. You’ll get efficient buy signals with precise price targets for maximum performance. Start outperforming now!
How do institutions grade them?
The following tables summarize recent institutional grades for Microchip Technology Incorporated and MaxLinear, Inc.:
Microchip Technology Incorporated Grades
This table shows the latest grades from various reputable institutions for Microchip Technology Incorporated.
| Grading Company | Action | New Grade | Date |
|---|---|---|---|
| Cantor Fitzgerald | maintain | Overweight | 2026-02-02 |
| UBS | maintain | Buy | 2026-01-26 |
| Susquehanna | maintain | Positive | 2026-01-22 |
| B of A Securities | maintain | Neutral | 2026-01-21 |
| Citigroup | maintain | Buy | 2026-01-15 |
| Piper Sandler | maintain | Overweight | 2026-01-15 |
| B. Riley Securities | maintain | Buy | 2026-01-12 |
| Mizuho | maintain | Outperform | 2026-01-09 |
| Wells Fargo | maintain | Equal Weight | 2026-01-07 |
| JP Morgan | maintain | Overweight | 2026-01-06 |
MaxLinear, Inc. Grades
This table presents the recent grades issued by credible firms for MaxLinear, Inc.
| Grading Company | Action | New Grade | Date |
|---|---|---|---|
| Wells Fargo | maintain | Equal Weight | 2026-01-30 |
| Benchmark | maintain | Buy | 2026-01-16 |
| Benchmark | maintain | Buy | 2025-10-24 |
| Benchmark | maintain | Buy | 2025-10-17 |
| Benchmark | maintain | Buy | 2025-09-02 |
| Loop Capital | maintain | Hold | 2025-08-04 |
| Wells Fargo | maintain | Equal Weight | 2025-07-24 |
| Benchmark | maintain | Buy | 2025-07-24 |
| Susquehanna | maintain | Neutral | 2025-07-24 |
| Susquehanna | maintain | Neutral | 2025-07-22 |
Which company has the best grades?
Microchip Technology Incorporated consistently receives higher grades, including multiple Buy, Overweight, and Outperform ratings. MaxLinear, Inc. holds mostly Buy and Equal Weight grades, with some Neutral and Hold ratings. Investors may interpret Microchip’s stronger institutional support as a sign of greater confidence from analysts.
Risks specific to each company
The following categories identify the critical pressure points and systemic threats facing both firms in the 2026 market environment:
1. Market & Competition
Microchip Technology Incorporated
- Large market cap at $42B supports strong competitive positioning in semiconductors.
MaxLinear, Inc.
- Smaller $1.5B market cap limits scale despite niche SoC expertise.
2. Capital Structure & Debt
Microchip Technology Incorporated
- Debt-to-assets at 37% is moderate; interest coverage weak at 1.15x signals liquidity strain.
MaxLinear, Inc.
- Lower leverage with 17% debt-to-assets; negative interest coverage at -13x is a severe risk.
3. Stock Volatility
Microchip Technology Incorporated
- Beta 1.44 indicates above-average volatility but less extreme than peers.
MaxLinear, Inc.
- Beta 1.71 exposes investors to higher market swings and risk.
4. Regulatory & Legal
Microchip Technology Incorporated
- US-based with global operations; faces typical semiconductor export controls and IP litigation risks.
MaxLinear, Inc.
- Also US-based, exposed to similar regulatory environments but less diversified globally.
5. Supply Chain & Operations
Microchip Technology Incorporated
- Large scale and diversified product base mitigate supply chain disruptions.
MaxLinear, Inc.
- Smaller scale and concentration in communications markets increase exposure to supply shocks.
6. ESG & Climate Transition
Microchip Technology Incorporated
- Established footprint suggests ongoing ESG investments, but no clear leadership in climate initiatives.
MaxLinear, Inc.
- Limited resources may slow ESG adaptation, heightening risk in increasingly eco-conscious markets.
7. Geopolitical Exposure
Microchip Technology Incorporated
- Significant Asia exposure risks tariffs and supply disruptions amid US-China tensions.
MaxLinear, Inc.
- Similar geopolitical risks but less global footprint may reduce direct impact.
Which company shows a better risk-adjusted profile?
Microchip’s most impactful risk is its strained interest coverage despite solid market position and scale. MaxLinear faces critical liquidity issues with negative interest coverage and far greater stock volatility. Despite Microchip’s weaknesses, its $42B market cap and safer Altman Z-Score of 4.05 versus MaxLinear’s 2.13 grey zone underline a better risk-adjusted profile. MaxLinear’s severe profitability losses and weaker capital structure mark it as the higher-risk investment.
Final Verdict: Which stock to choose?
Microchip Technology Incorporated’s superpower lies in its robust liquidity and dividend yield, supporting resilience amid cyclical pressures. However, its declining profitability and value destruction warrant caution. It suits portfolios seeking exposure to established semiconductor players with income focus but higher risk tolerance.
MaxLinear, Inc. leverages a strategic moat through aggressive R&D investment, fueling revenue growth and potential innovation breakthroughs. Its lighter debt load offers greater balance sheet safety versus Microchip, appealing to investors favoring growth with moderate financial risk. It fits well in GARP (Growth at a Reasonable Price) portfolios.
If you prioritize income and established market presence, Microchip’s strong cash conversion and dividend yield make it a compelling choice despite operational challenges. However, if you seek growth backed by innovation and a healthier balance sheet, MaxLinear offers better stability and upside potential. Both present risks; careful alignment with investment strategy is essential.
Disclaimer: Investment carries a risk of loss of initial capital. The past performance is not a reliable indicator of future results. Be sure to understand risks before making an investment decision.
Go Further
I encourage you to read the complete analyses of Microchip Technology Incorporated and MaxLinear, Inc. to enhance your investment decisions: