In today’s fast-evolving tech landscape, Workday, Inc. and Match Group, Inc. stand out as influential players within the software application sector. Workday excels in enterprise cloud solutions for financial and human capital management, while Match Group dominates the global online dating market with innovative platforms. This comparison highlights their market positions, growth strategies, and innovation approaches to help you identify which company offers the most compelling investment opportunity in 2026.
Table of contents
Companies Overview
I will begin the comparison between Workday, Inc. and Match Group, Inc. by providing an overview of these two companies and their main differences.
Workday Overview
Workday, Inc. specializes in enterprise cloud applications, offering financial management, human capital management, and analytics solutions to a broad range of industries including healthcare, education, and technology. Headquartered in Pleasanton, California, Workday supports business operations by enabling real-time financial insights, streamlined supplier management, and enhanced employee lifecycle management. The company operates globally with over 20K employees.
Match Group Overview
Match Group, Inc. operates as a global provider of dating products, owning brands such as Tinder, Match, and Hinge. Based in Dallas, Texas, it focuses exclusively on social and dating applications, serving a worldwide user base. Established in 1986, Match Group employs around 2.5K people and concentrates on expanding its portfolio within the digital dating market.
Key similarities and differences
Both Workday and Match Group belong to the technology sector and trade on NASDAQ, focusing on software applications. Workday targets enterprise clients with cloud-based business management tools, while Match Group concentrates on consumer-facing dating platforms. Their business models differ significantly: Workday provides B2B SaaS solutions, whereas Match Group delivers B2C digital dating services. Employee count and market capitalization also vary notably, reflecting their distinct market positions.
Income Statement Comparison
The following table presents a side-by-side comparison of key income statement metrics for Workday, Inc. and Match Group, Inc. for their most recent fiscal years.
| Metric | Workday, Inc. (WDAY) | Match Group, Inc. (MTCH) |
|---|---|---|
| Market Cap | 49.9B | 7.4B |
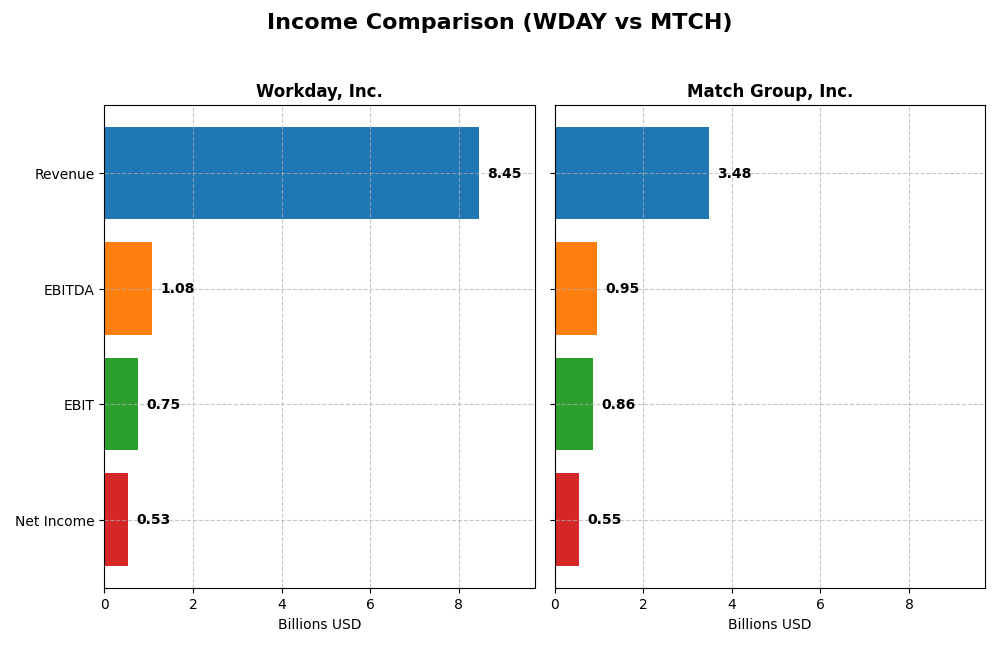
| Revenue | 8.45B | 3.48B |
| EBITDA | 1.08B | 952M |
| EBIT | 752M | 864M |
| Net Income | 526M | 551M |
| EPS | 1.98 | 2.12 |
| Fiscal Year | 2025 | 2024 |
Income Statement Interpretations
Workday, Inc.
Workday’s revenue grew strongly from $4.3B in 2021 to $8.4B in 2025, nearly doubling over five years. Net income recovered from losses in early years to $526M in 2025, despite a net margin decline in the latest year. Gross margin remained high at 75.5%, while EBIT margin was stable at 8.9%. The 2025 year showed favorable revenue and EBIT growth but a drop in net margin and EPS.
Match Group, Inc.
Match Group’s revenue increased steadily from $2.4B in 2020 to $3.5B in 2024, with net income rising from $162M to $551M. Margins were solid, with gross margin at 71.5% and EBIT margin at 24.8%, both favorable. The latest year saw modest revenue growth of 3.4%, but EBIT and net margin declined, indicating rising operating expenses relative to revenue.
Which one has the stronger fundamentals?
Workday demonstrates stronger overall revenue and net income growth over the period, with high gross margins and improving EBIT, despite recent net margin and EPS softness. Match Group maintains higher EBIT and net margins with steady profitability but faces slower growth and margin pressure recently. Both show favorable fundamentals, with Workday excelling in growth and Match Group in margin stability.
Financial Ratios Comparison
Below is a comparison of key financial ratios for Workday, Inc. and Match Group, Inc. based on their most recent fiscal year data.
| Ratios | Workday, Inc. (2025) | Match Group, Inc. (2024) |
|---|---|---|
| ROE | 5.8% | -865.9% |
| ROIC | 2.7% | 16.4% |
| P/E | 132.2 | 15.4 |
| P/B | 7.7 | -133.7 |
| Current Ratio | 1.85 | 2.54 |
| Quick Ratio | 1.85 | 2.54 |
| D/E | 0.37 | -62.1 |
| Debt-to-Assets | 18.7% | 88.5% |
| Interest Coverage | 3.64 | 5.14 |
| Asset Turnover | 0.47 | 0.78 |
| Fixed Asset Turnover | 5.36 | 22.0 |
| Payout ratio | 0 | 0 |
| Dividend yield | 0 | 0 |
Interpretation of the Ratios
Workday, Inc.
Workday’s ratios are mixed, with favorable liquidity and leverage metrics, including a current ratio of 1.85 and debt-to-equity at 0.37. However, profitability ratios such as ROE at 5.82% and ROIC at 2.73% are unfavorable, alongside high valuation multiples like a P/E of 132.15. The company does not pay dividends, reflecting a reinvestment strategy likely focused on growth and innovation.
Match Group, Inc.
Match Group shows more favorable profitability with a net margin of 15.84% and ROIC of 16.38%, supported by a strong current ratio of 2.54 and interest coverage of 5.4. Despite a negative ROE due to losses, the company’s valuation and asset turnover are solid. Match Group pays no dividends, suggesting capital is retained for growth and operational investments.
Which one has the best ratios?
Match Group’s ratios appear generally stronger, with a higher proportion of favorable metrics, including profitability and liquidity. Workday’s financials reflect more balance but with significant concerns in profitability and valuation. The overall evaluation favors Match Group, though both exhibit strengths and weaknesses investors should consider carefully.
Strategic Positioning
This section compares the strategic positioning of Workday, Inc. and Match Group, Inc., focusing on market position, key segments, and exposure to technological disruption:
Workday, Inc.
- Leading enterprise cloud applications provider facing tech sector competition.
- Focused on subscription services for finance and human capital management.
- Moderate exposure with cloud-based platforms and machine learning enhancements.
Match Group, Inc.
- Niche leader in global dating products with moderate competitive pressure.
- Concentrated on dating services through multiple brand portfolios.
- Exposure tied to evolving online dating technologies and user engagement tools.
Workday, Inc. vs Match Group, Inc. Positioning
Workday pursues a diversified technology approach across multiple enterprise functions, creating broad business drivers. Match Group concentrates on the dating product segment, offering focused brand-driven growth but less diversification.
Which has the best competitive advantage?
Match Group demonstrates a slightly favorable moat by creating value with efficient capital use despite declining ROIC, whereas Workday has a slightly unfavorable moat due to value destruction but improving profitability trends.
Stock Comparison
The stock prices of Workday, Inc. and Match Group, Inc. have shown notable declines over the past year, with both experiencing bearish trends marked by decreasing values and varying trading volumes.
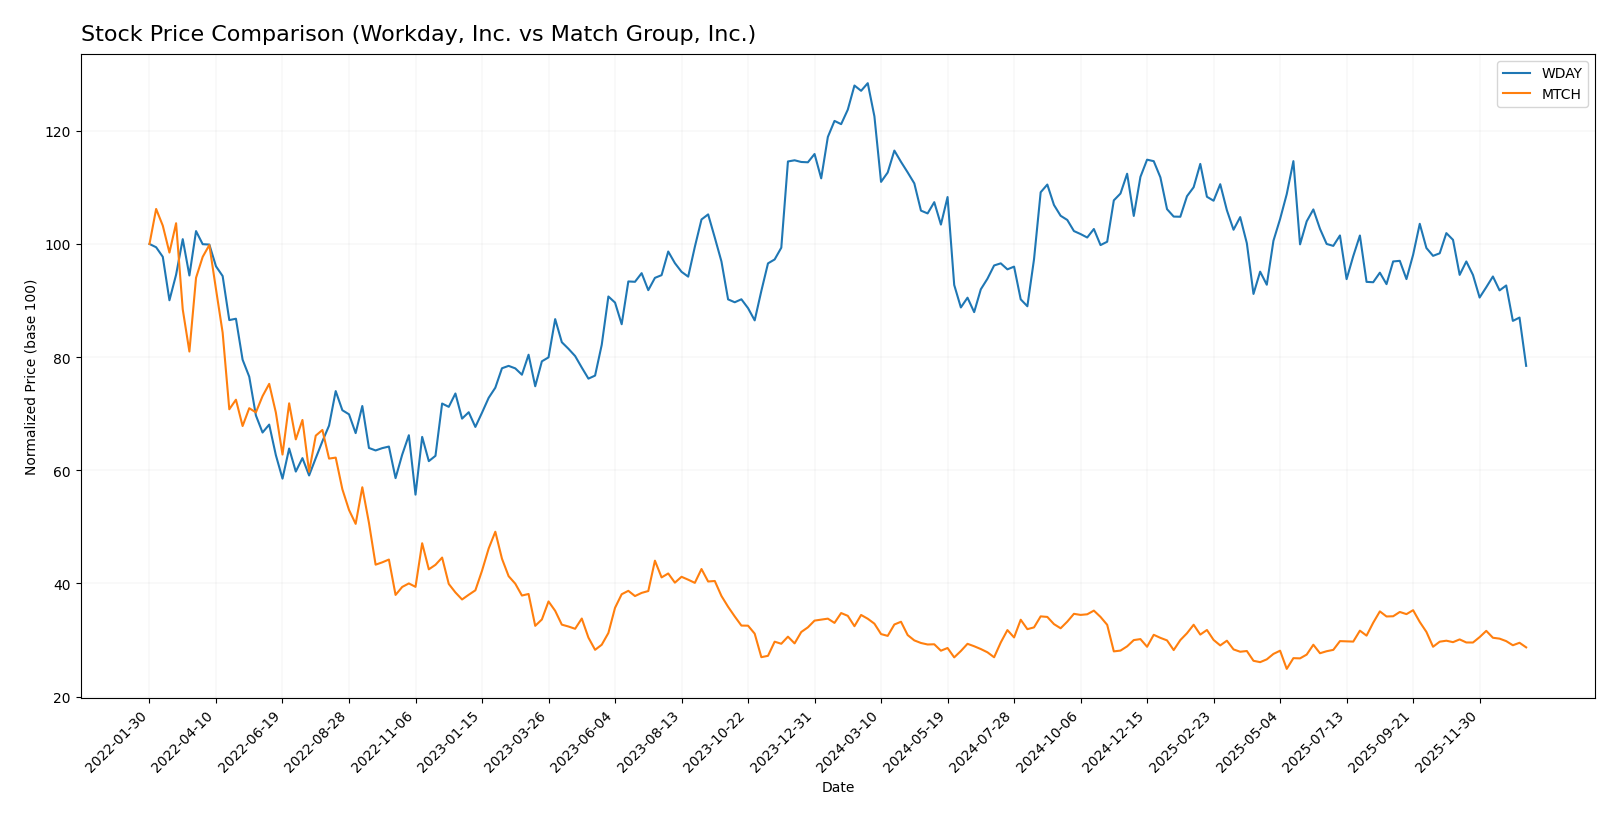
Trend Analysis
Workday, Inc. exhibited a bearish trend over the past 12 months, with a price decline of 38.91%. The trend shows deceleration and high volatility, with prices ranging from 186.86 to 305.88.
Match Group, Inc. also experienced a bearish trend with a price decrease of 14.99% over the same period. The trend is decelerating and less volatile, with a price range between 27.18 and 38.51.
Comparing both, Workday, Inc. experienced a steeper decline and higher volatility, while Match Group, Inc. showed a smaller loss. Match Group delivered the relatively better market performance over the past year.
Target Prices
The current analyst consensus reveals promising upside potential for both Workday, Inc. and Match Group, Inc.
| Company | Target High | Target Low | Consensus |
|---|---|---|---|
| Workday, Inc. | 320 | 235 | 274.47 |
| Match Group, Inc. | 43 | 33 | 36.29 |
Analysts expect Workday to reach a consensus target of $274.47, significantly above its current price of $186.86, while Match Group’s target consensus of $36.29 also suggests upside from its current $31.34.
Analyst Opinions Comparison
This section compares analysts’ ratings and grades for Workday, Inc. and Match Group, Inc.:
Rating Comparison
WDAY Rating
- Rating: B- indicating a very favorable outlook.
- Discounted Cash Flow Score: 4, considered favorable.
- ROE Score: 3, moderate efficiency in generating profit from equity.
- ROA Score: 3, moderate asset utilization.
- Debt To Equity Score: 2, moderate financial risk.
- Overall Score: 2, moderate overall financial standing.
MTCH Rating
- Rating: B indicating a very favorable outlook.
- Discounted Cash Flow Score: 5, very favorable.
- ROE Score: 1, very unfavorable efficiency.
- ROA Score: 5, very favorable asset utilization.
- Debt To Equity Score: 1, very unfavorable leverage.
- Overall Score: 3, moderate overall financial standing.
Which one is the best rated?
Match Group holds a higher overall rating (B) and better discounted cash flow and return on assets scores, but suffers from weaker ROE and debt to equity scores compared to Workday. Overall, Match Group is slightly better rated by analysts.
Scores Comparison
Here is a comparison of the financial health scores for Workday, Inc. and Match Group, Inc.:
WDAY Scores
- Altman Z-Score: 4.41, indicating a safe zone with low bankruptcy risk.
- Piotroski Score: 6, reflecting average financial strength.
MTCH Scores
- Altman Z-Score: 0.52, indicating distress zone and high bankruptcy risk.
- Piotroski Score: 8, reflecting very strong financial strength.
Which company has the best scores?
Workday has a significantly better Altman Z-Score, signaling lower bankruptcy risk, while Match Group shows a stronger Piotroski Score, indicating better financial strength. Each company excels in a different score metric based on the data provided.
Grades Comparison
Here is the overview of recent grades assigned to Workday, Inc. and Match Group, Inc.:
Workday, Inc. Grades
The following table summarizes the latest grades from various established grading companies for Workday, Inc.:
| Grading Company | Action | New Grade | Date |
|---|---|---|---|
| Barclays | Maintain | Overweight | 2026-01-12 |
| RBC Capital | Maintain | Outperform | 2026-01-05 |
| TD Cowen | Maintain | Buy | 2025-11-26 |
| DA Davidson | Maintain | Neutral | 2025-11-26 |
| Wells Fargo | Maintain | Overweight | 2025-11-26 |
| Barclays | Maintain | Overweight | 2025-11-26 |
| Keybanc | Maintain | Overweight | 2025-11-26 |
| Citigroup | Maintain | Neutral | 2025-11-26 |
| JP Morgan | Maintain | Overweight | 2025-11-26 |
| UBS | Maintain | Neutral | 2025-11-26 |
Overall, Workday, Inc. has consistently received favorable grades, predominantly in the “Overweight” and “Buy” categories, indicating positive sentiment from analysts.
Match Group, Inc. Grades
Below is a summary of recent grades given to Match Group, Inc. by reputable grading firms:
| Grading Company | Action | New Grade | Date |
|---|---|---|---|
| Morgan Stanley | Maintain | Equal Weight | 2026-01-13 |
| Truist Securities | Maintain | Hold | 2025-11-05 |
| Evercore ISI Group | Maintain | In Line | 2025-11-05 |
| Wells Fargo | Maintain | Equal Weight | 2025-11-05 |
| Morgan Stanley | Maintain | Equal Weight | 2025-10-20 |
| Susquehanna | Maintain | Positive | 2025-08-07 |
| Evercore ISI Group | Maintain | In Line | 2025-08-06 |
| JP Morgan | Maintain | Neutral | 2025-08-06 |
| UBS | Maintain | Neutral | 2025-07-23 |
| Wells Fargo | Maintain | Equal Weight | 2025-06-27 |
Match Group, Inc. grades mostly range from “Equal Weight” to “Hold,” with some “Neutral” and “Positive” ratings, reflecting a more cautious outlook from analysts.
Which company has the best grades?
Workday, Inc. has received stronger and more consistent positive grades compared to Match Group, Inc., which shows more moderate and neutral ratings. This difference may influence investors’ perception of growth potential and risk between the two companies.
Strengths and Weaknesses
Below is a comparison table summarizing key strengths and weaknesses of Workday, Inc. (WDAY) and Match Group, Inc. (MTCH) based on the most recent data available.
| Criterion | Workday, Inc. (WDAY) | Match Group, Inc. (MTCH) |
|---|---|---|
| Diversification | Primarily subscription services with growing professional services segment; moderate product diversification | Focused on dating and related services; less diversified product portfolio |
| Profitability | Moderate net margin (6.23%), slightly unfavorable ROIC (2.73%) below WACC; improving profitability trend | Strong net margin (15.84%) and ROIC (16.38%) above WACC; profitability declining recently |
| Innovation | Growing ROIC trend suggests improving efficiency; investment in professional services | High fixed asset turnover indicates efficient asset use; innovation needed to reverse declining profitability |
| Global presence | Established global presence in enterprise HR and finance software | Strong global dating platform presence but high debt-to-assets ratio poses risk |
| Market Share | Solid position in enterprise software market; subscription revenue growing steadily | Leading market share in online dating, supported by favorable financial ratios |
Key takeaways: Workday shows improving profitability but still struggles with value creation relative to cost of capital. Match Group maintains strong profitability and efficient asset use but faces challenges with declining earnings and elevated leverage. Investors should weigh growth potential against these risks.
Risk Analysis
The table below summarizes key risks for Workday, Inc. (WDAY) and Match Group, Inc. (MTCH) based on the latest financial and operational data from 2025 and 2024 respectively.
| Metric | Workday, Inc. (WDAY) | Match Group, Inc. (MTCH) |
|---|---|---|
| Market Risk | Beta 1.14, moderate volatility, tech sector exposure | Beta 1.33, higher volatility, consumer discretionary sector |
| Debt level | Low debt-to-equity 0.37, favorable leverage | High debt-to-assets 88.5%, unfavorable leverage |
| Regulatory Risk | Moderate, cloud software compliance standards | Moderate, privacy and data protection regulations |
| Operational Risk | Medium, large workforce 20.5K, software complexity | Medium, smaller workforce 2.5K, brand portfolio management |
| Environmental Risk | Low, limited direct impact in software industry | Low, limited environmental footprint |
| Geopolitical Risk | Moderate, global operations with US base | Moderate, US base with international user base |
Workday shows a safer financial leverage profile and stable Altman Z-Score indicating low bankruptcy risk, but its high P/E ratio suggests valuation risk. Match Group faces significant financial distress risk with a low Altman Z-Score and high debt, despite strong profitability and operational efficiency. Investors should weigh Match’s financial risk against its growth potential, while Workday’s valuation and moderate growth metrics call for cautious optimism.
Which Stock to Choose?
Workday, Inc. (WDAY) shows a favorable income evolution with 16.35% revenue growth in 2025 and strong overall income growth since 2021. Its financial ratios are mixed, with a neutral global evaluation, favorable liquidity, and debt metrics but unfavorable profitability ratios. The company is slightly unfavorable on MOAT due to ROIC below WACC but with a growing ROIC trend. Its rating is very favorable (B-), supported by moderate financial scores.
Match Group, Inc. (MTCH) has a favorable income statement overall but slower recent growth with 3.41% revenue increase in 2024. Its financial ratios are mostly favorable, especially profitability and liquidity, despite unfavorable debt-to-assets. MOAT is slightly favorable as ROIC exceeds WACC, although ROIC is declining. The rating is very favorable (B), with moderate to strong scores but some concerns on return on equity and debt.
Investors focused on growth may find Workday appealing due to its strong income growth and improving profitability, while those prioritizing value and financial stability might see Match Group as more favorable given its higher profitability ratios and value-creating ROIC despite slower growth trends. The overall rating and ratio evaluations suggest different profiles could interpret the investment potential in line with their risk tolerance and strategy.
Disclaimer: Investment carries a risk of loss of initial capital. The past performance is not a reliable indicator of future results. Be sure to understand risks before making an investment decision.
Go Further
I encourage you to read the complete analyses of Workday, Inc. and Match Group, Inc. to enhance your investment decisions: