Home > Comparison > Technology > U vs MTCH
The strategic rivalry between Unity Software Inc. and Match Group, Inc. shapes the evolution of the technology sector’s software application landscape. Unity operates a capital-intensive platform for interactive real-time 3D content, while Match Group leads as a high-margin provider of global dating products. This analysis pits innovation-driven growth against steady subscription revenue. I will determine which company offers the superior risk-adjusted return for a diversified portfolio in 2026.
Table of contents
Companies Overview
Unity Software Inc. and Match Group, Inc. both hold significant positions in the technology sector, shaping interactive content and digital social connections.
Unity Software Inc.: Leader in Real-Time 3D Content Platforms
Unity Software Inc. dominates the interactive real-time 3D content platform market. It generates revenue by licensing software that enables creators to build and monetize 2D and 3D content across devices, including mobile, PC, and AR/VR. In 2026, the company focuses strategically on expanding its platform capabilities and global distribution channels to enhance content creator engagement.
Match Group, Inc.: Pioneer in Online Dating Services
Match Group, Inc. leads in digital dating products worldwide, operating brands like Tinder and OkCupid. Its revenue engine centers on subscription fees and premium services that monetize social connections. In 2026, Match Group prioritizes innovation in user experience and brand diversification to capture a broader demographic within the competitive dating market.
Strategic Collision: Similarities & Divergences
Both companies rely on software applications but differ fundamentally: Unity builds an open, multi-platform content ecosystem, while Match Group operates a closed, brand-driven network. Their primary battleground is user engagement—content creation versus social interaction. Unity’s growth depends on developer adoption; Match Group’s on consumer subscriptions. These distinctions define their unique investment profiles, balancing tech innovation against steady consumer monetization.
Income Statement Comparison
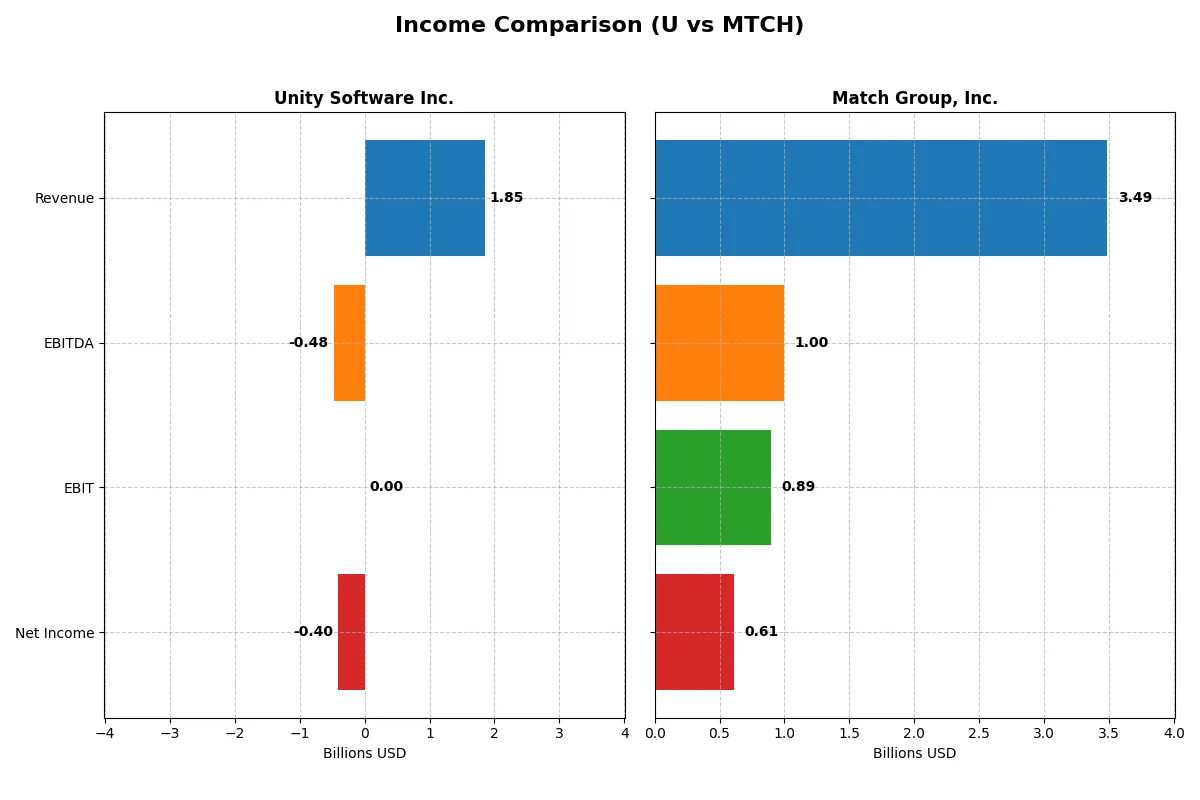
This data dissects the core profitability and scalability of both corporate engines to reveal who dominates the bottom line:
| Metric | Unity Software Inc. (U) | Match Group, Inc. (MTCH) |
|---|---|---|
| Revenue | 1.85B | 3.49B |
| Cost of Revenue | 478M | 948M |
| Operating Expenses | 1.85B | 1.67B |
| Gross Profit | 1.37B | 2.54B |
| EBITDA | -479M | 999M |
| EBIT | 0 | 894M |
| Interest Expense | 24M | 148M |
| Net Income | -403M | 613M |
| EPS | -0.96 | 2.53 |
| Fiscal Year | 2025 | 2025 |
Income Statement Analysis: The Bottom-Line Duel
This income statement comparison reveals the true efficiency and profitability of each company’s core business engine over recent years.
Unity Software Inc. Analysis
Unity’s revenue climbed steadily from 1.11B in 2021 to 1.85B in 2025, a 67% growth. Despite a strong 74% gross margin, Unity remains unprofitable with a net loss of 403M in 2025. Operating expenses exceed revenue, but improving net margin and EPS growth signal early momentum in cost management and operational leverage.
Match Group, Inc. Analysis
Match Group’s revenue grew more modestly from 3B in 2021 to 3.49B in 2025, a 17% increase. It sustains a healthy 73% gross margin and a strong net margin of 18%. Match delivers solid profitability with a net income of 613M in 2025, supported by consistent EBIT growth and disciplined expense control, reflecting operational efficiency.
Profitability vs. Growth Trajectory
Match Group clearly leads in profitability, boasting robust margins and positive net income, while Unity shows significant top-line growth yet remains loss-making. For investors prioritizing earnings and margin strength, Match provides a proven profitable model. Unity appeals more to growth-focused investors willing to tolerate short-term losses for future scalability.
Financial Ratios Comparison
These vital ratios act as a diagnostic tool to expose the underlying fiscal health, valuation premiums, and capital efficiency of the companies compared below:
| Ratios | Unity Software Inc. (U) | Match Group, Inc. (MTCH) |
|---|---|---|
| ROE | -12.44% | -241.99% |
| ROIC | -8.16% | 18.50% |
| P/E | -46.16 | 12.77 |
| P/B | 5.74 | -30.91 |
| Current Ratio | 1.84 | 1.42 |
| Quick Ratio | 1.84 | 1.42 |
| D/E (Debt-to-Equity) | 0.69 | -15.67 |
| Debt-to-Assets | 32.69% | 89.06% |
| Interest Coverage | 19.95 | 5.91 |
| Asset Turnover | 0.27 | 0.78 |
| Fixed Asset Turnover | 27.09 | 26.59 |
| Payout Ratio | 0 | 30.36% |
| Dividend Yield | 0 | 2.38% |
| Fiscal Year | 2025 | 2025 |
Efficiency & Valuation Duel: The Vital Signs
Financial ratios act as a company’s DNA, exposing hidden risks and operational strengths that shape investment decisions.
Unity Software Inc.
Unity displays negative profitability with a -12.44% ROE and a -21.78% net margin, signaling ongoing losses. Its valuation appears favorable with a negative P/E of -46.16, but a high price-to-book of 5.74 suggests stretched equity valuation. Unity retains earnings, focusing heavily on R&D at over 50% of revenue instead of dividends.
Match Group, Inc.
Match Group shows mixed profitability: a positive 17.59% net margin and 18.5% ROIC contrast with a negative ROE of -241.99%. Its valuation metrics—P/E of 12.77 and a negative P/B—indicate an efficient but leveraged profile. The company supports shareholders with a 2.38% dividend yield and maintains solid interest coverage at 6.06x.
Premium Valuation vs. Operational Safety
Match Group offers a more balanced risk and reward outlook, combining profitability and shareholder returns despite leverage concerns. Unity’s innovation-driven model carries higher risk with persistent losses. Conservative investors may prefer Match’s operational safety, while growth seekers might consider Unity’s reinvestment strategy.
Which one offers the Superior Shareholder Reward?
Unity Software (U) pays no dividends and lacks buybacks, focusing on reinvesting free cash flow into growth. Match Group (MTCH) offers a 2.38% dividend yield with a 30% payout ratio and robust buybacks, supported by strong free cash flow of $4.2B. MTCH’s distribution model balances income and capital return sustainably. U’s negative margins and absence of returns to shareholders increase risk. I find Match Group’s shareholder reward superior in 2026, delivering steady income plus buyback-driven capital appreciation.
Comparative Score Analysis: The Strategic Profile
The radar chart reveals the fundamental DNA and trade-offs between Unity Software Inc. and Match Group, Inc.:
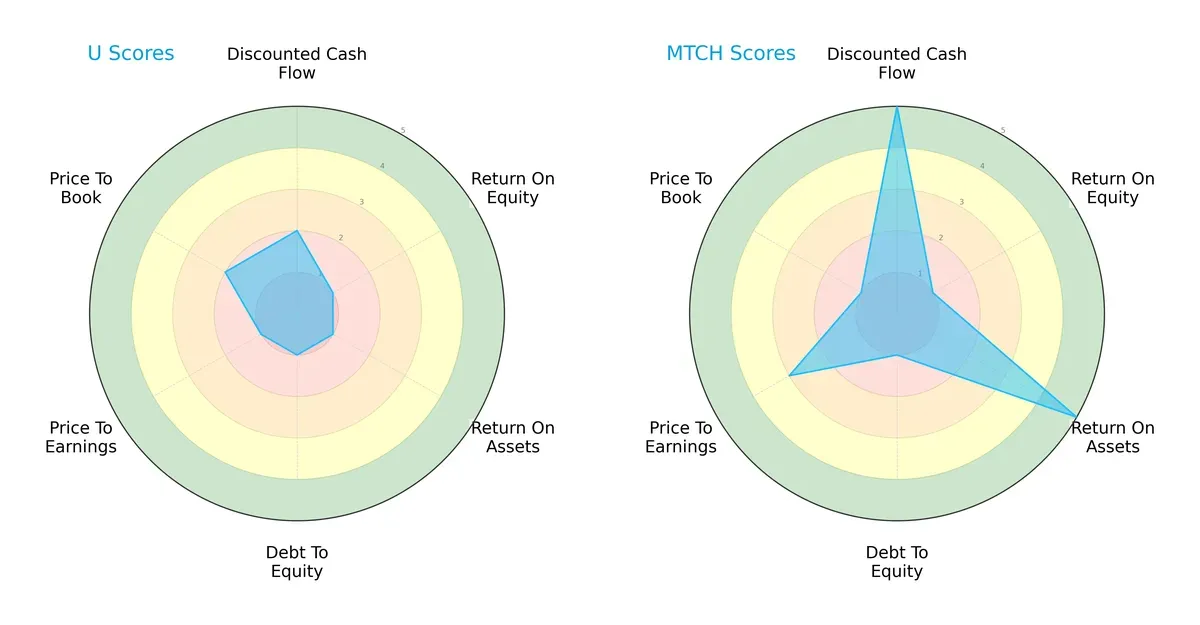
Match Group exhibits a stronger discounted cash flow (DCF) and return on assets (ROA) profile, scoring 5 in both, indicating superior operational efficiency and valuation appeal. Unity lags with mostly very unfavorable scores, particularly in return on equity (ROE) and debt-to-equity. Match Group’s profile is more balanced, leveraging asset efficiency and valuation strength, while Unity relies on a modest price-to-book edge but suffers across profitability and leverage metrics.
Bankruptcy Risk: Solvency Showdown
The Altman Z-Score delta highlights significant distress risk for both firms, with Match Group scoring 0.63 and Unity at 1.05:
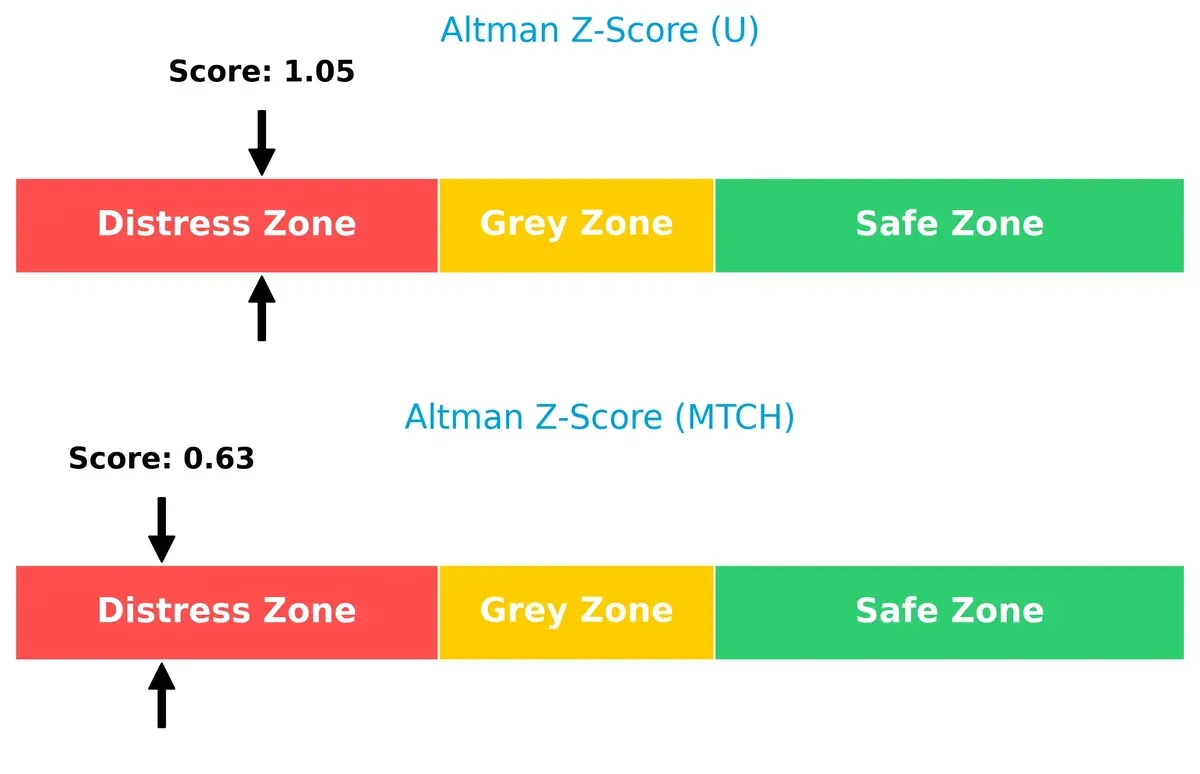
Both companies reside in the distress zone, signaling elevated bankruptcy risk amid current market cycles. Unity’s marginally higher score suggests it is slightly less vulnerable, but neither company currently offers a strong solvency cushion.
Financial Health: Quality of Operations
Piotroski F-Scores reveal stark contrasts in operational quality and financial strength between the firms:
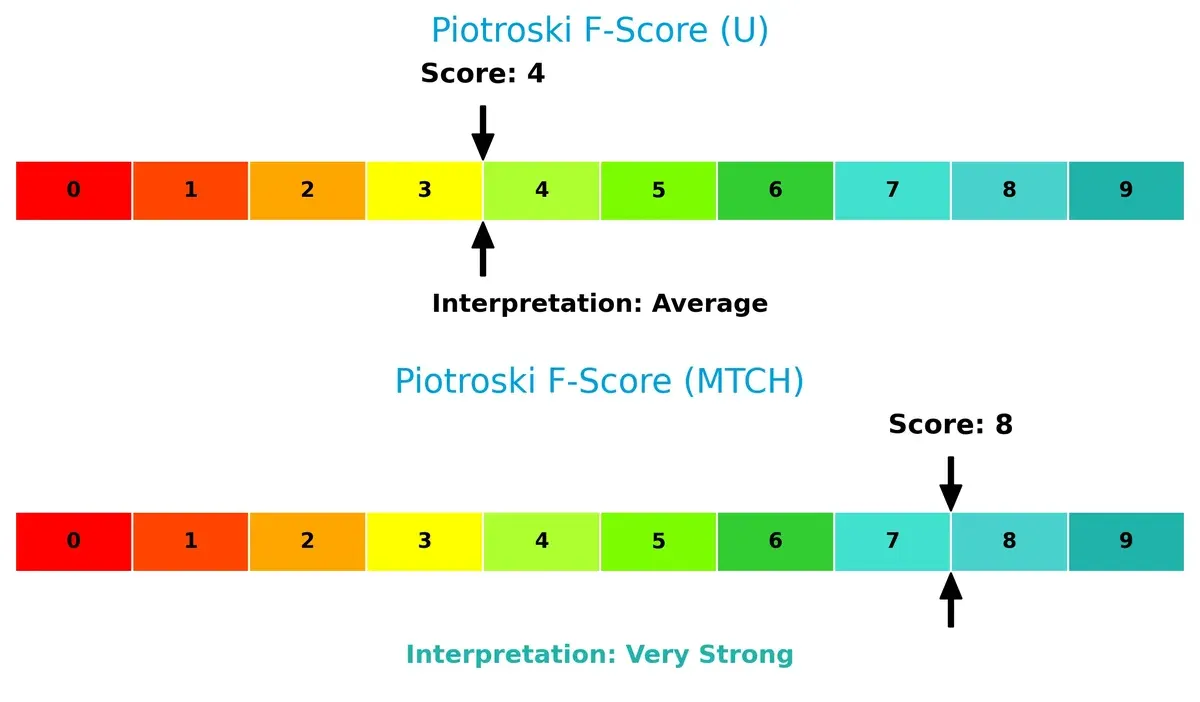
Match Group scores an impressive 8, indicating very strong financial health with solid profitability, liquidity, and leverage management. Unity’s score of 4 signals average health and potential red flags in internal metrics, warning investors of operational weaknesses compared to its peer.
How are the two companies positioned?
This section dissects the operational DNA of Unity and Match Group by comparing their revenue distribution and internal strengths and weaknesses. The goal is to confront their economic moats and identify which model delivers the most resilient competitive advantage today.
Revenue Segmentation: The Strategic Mix
The following visual comparison dissects how both firms diversify their income streams and where their primary sector bets lie:
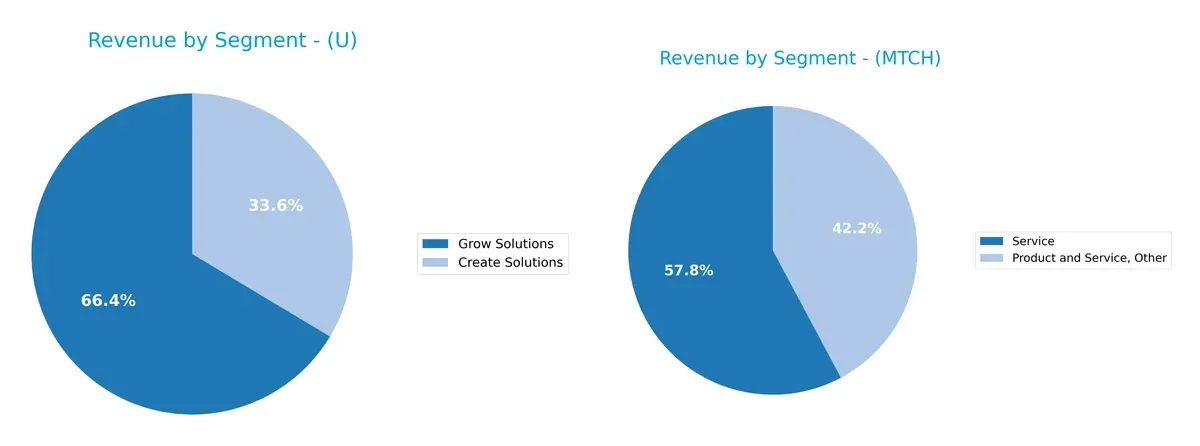
Unity Software Inc. anchors its revenue mainly in two segments: Grow Solutions at $1.23B and Create Solutions at $621M in 2025. Its dual-segment model diversifies income but leans heavily on Grow Solutions, signaling a focus on scalable development platforms. Match Group, Inc. revenue data is less segmented recently, but historically it pivots on a dominant dating segment exceeding $2B. This reliance indicates higher concentration risk compared to Unity’s broader ecosystem lock-in strategy.
Strengths and Weaknesses Comparison
This table compares the strengths and weaknesses of Unity Software Inc. and Match Group, Inc.:
Unity Software Inc. Strengths
- Diversified revenue from Create and Grow Solutions
- Favorable current and quick ratios indicate strong liquidity
- High fixed asset turnover signals efficient asset use
- Global presence with balanced revenue across US, EMEA, Asia Pacific
Match Group, Inc. Strengths
- Strong profitability with positive net margin and ROIC
- Favorable WACC and interest coverage show financial stability
- Diverse product and service revenue streams
- Global presence with significant US and Non-US revenues
- Positive dividend yield supports income investors
Unity Software Inc. Weaknesses
- Negative net margin, ROE, and ROIC reflect unprofitable operations
- Unfavorable WACC and interest coverage increase financial risk
- High price-to-book ratio questions valuation
- Low asset turnover indicates inefficient asset use
- No dividend yield limits income appeal
Match Group, Inc. Weaknesses
- Negative ROE signals shareholder return concerns
- High debt-to-assets ratio increases leverage risk
- Neutral current ratio suggests moderate liquidity
- Asset turnover is only neutral, implying average efficiency
Both companies show distinct financial profiles: Unity struggles with profitability and efficiency despite liquidity strengths, while Match Group demonstrates solid profitability and financial stability but carries higher leverage risks. These contrasts highlight differing strategic priorities and risk exposures.
The Moat Duel: Analyzing Competitive Defensibility
A structural moat protects long-term profits from relentless competition and market shifts. Without it, earnings erode quickly. Here’s how Unity Software and Match Group compare:
Unity Software Inc.: Intangible Assets and Platform Ecosystem
Unity’s moat stems from its robust real-time 3D content creation platform. This intangible asset drives high gross margins (~74%) but struggles to convert into positive net margins. Its growing ROIC signals improving capital efficiency, while expansion in AR/VR markets could deepen its moat in 2026.
Match Group, Inc.: Network Effects in Online Dating
Match Group leverages strong network effects across its portfolio of dating brands, sustaining a wide user base and high EBIT margins (~26%). Unlike Unity, Match delivers positive net margins and creates value with ROIC exceeding WACC, though its profitability trend weakens. Opportunities lie in global market expansion and brand diversification.
Intangible Assets vs. Network Effects: The Moat Showdown
Match Group’s network effects build a wider, value-creating moat despite some profitability decline. Unity’s intangible asset moat is narrower, currently destroying value but improving. Match is better positioned to defend market share long term given its established cash flow and scale.
Which stock offers better returns?
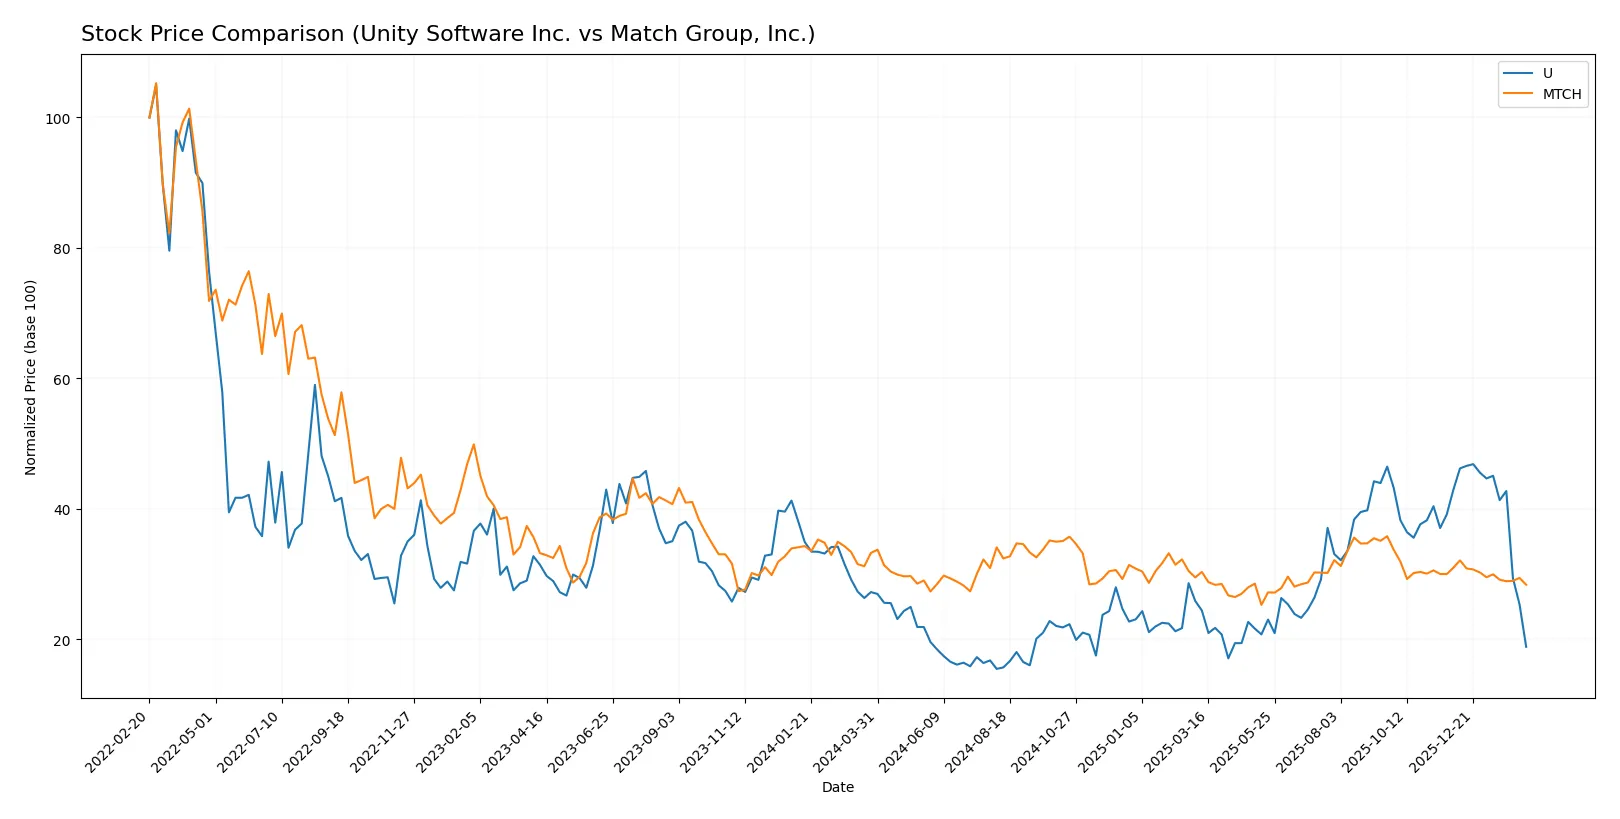
Over the past year, both stocks faced downward pressure with notable price declines; Unity Software shows heightened volatility and sharper recent losses compared to Match Group’s more moderate decrease.
Trend Comparison
Unity Software’s stock declined sharply by 30.79% over the past year, reflecting a bearish trend with decelerating losses and high volatility (9.2 std deviation). Its price ranged between 46.42 and 15.32.
Match Group’s stock also fell, down 14.69% during the same period, signaling a bearish trend with deceleration and lower volatility (2.63 std deviation). The price fluctuated between 38.51 and 27.18.
Comparing the two, Match Group delivered a less severe decline and steadier performance. Unity’s steeper fall marks it as the weaker market performer over the analyzed period.
Target Prices
Analysts present mixed but generally optimistic target prices for Unity Software Inc. and Match Group, Inc.
| Company | Target Low | Target High | Consensus |
|---|---|---|---|
| Unity Software Inc. | 26 | 60 | 37.7 |
| Match Group, Inc. | 33 | 43 | 36 |
The consensus targets sit significantly above current prices—Unity at $18.68 and Match Group at $30.50—indicating expected upside potential based on analyst forecasts.

Don’t Let Luck Decide Your Entry Point
Optimize your entry points with our advanced ProRealTime indicators. You’ll get efficient buy signals with precise price targets for maximum performance. Start outperforming now!
How do institutions grade them?
The following tables summarize recent institutional grades for Unity Software Inc. and Match Group, Inc.:
Unity Software Inc. Grades
This table shows the latest grades from leading financial institutions for Unity Software Inc.
| Grading Company | Action | New Grade | Date |
|---|---|---|---|
| Goldman Sachs | Maintain | Neutral | 2026-02-12 |
| BTIG | Maintain | Buy | 2026-02-12 |
| Needham | Maintain | Buy | 2026-02-12 |
| Wells Fargo | Maintain | Overweight | 2026-02-12 |
| Wedbush | Maintain | Outperform | 2026-02-12 |
| Macquarie | Maintain | Outperform | 2026-02-12 |
| UBS | Maintain | Neutral | 2026-02-12 |
| Citigroup | Maintain | Buy | 2026-02-12 |
| Barclays | Maintain | Equal Weight | 2026-02-12 |
| Citizens | Maintain | Market Outperform | 2026-02-12 |
Match Group, Inc. Grades
The table below presents recent grades given to Match Group, Inc. by recognized grading firms.
| Grading Company | Action | New Grade | Date |
|---|---|---|---|
| TD Cowen | Maintain | Buy | 2026-02-05 |
| JP Morgan | Maintain | Neutral | 2026-02-04 |
| Truist Securities | Maintain | Hold | 2026-02-04 |
| Morgan Stanley | Maintain | Equal Weight | 2026-01-13 |
| Wells Fargo | Maintain | Equal Weight | 2025-11-05 |
| Evercore ISI Group | Maintain | In Line | 2025-11-05 |
| Truist Securities | Maintain | Hold | 2025-11-05 |
| Morgan Stanley | Maintain | Equal Weight | 2025-10-20 |
| Susquehanna | Maintain | Positive | 2025-08-07 |
| Evercore ISI Group | Maintain | In Line | 2025-08-06 |
Which company has the best grades?
Unity Software Inc. generally receives stronger grades, including multiple Buy and Outperform ratings. Match Group, Inc. holds more Neutral and Hold grades. Investors may perceive Unity as having a more optimistic institutional outlook.
Risks specific to each company
The following categories identify the critical pressure points and systemic threats facing both firms in the 2026 market environment:
1. Market & Competition
Unity Software Inc.
- Faces intense competition in the interactive 3D software space with rapid innovation cycles.
Match Group, Inc.
- Operates in a highly competitive dating app market with constant user acquisition and retention pressure.
2. Capital Structure & Debt
Unity Software Inc.
- Maintains moderate debt levels (D/E 0.69) with neutral leverage risk but poor interest coverage.
Match Group, Inc.
- High debt-to-assets ratio (89%) signals elevated financial risk despite strong interest coverage.
3. Stock Volatility
Unity Software Inc.
- Exhibits high beta (2.09), indicating significant price swings and higher market risk.
Match Group, Inc.
- Lower beta (1.32) suggests more stable stock price relative to market fluctuations.
4. Regulatory & Legal
Unity Software Inc.
- Subject to software compliance and data privacy regulations across multiple jurisdictions.
Match Group, Inc.
- Faces increasing scrutiny on data privacy and content moderation in global dating services.
5. Supply Chain & Operations
Unity Software Inc.
- Relies on a global network of resellers and distributors, exposing it to supply chain disruptions.
Match Group, Inc.
- Primarily digital service-based, less exposed to physical supply chain risks but dependent on platform stability.
6. ESG & Climate Transition
Unity Software Inc.
- Faces pressure to improve sustainability in data center operations and software development.
Match Group, Inc.
- ESG risks stem mainly from data privacy and ethical management of user content.
7. Geopolitical Exposure
Unity Software Inc.
- Operates in diverse international markets, exposed to geopolitical tensions and trade restrictions.
Match Group, Inc.
- Also global, but primarily digital presence reduces direct geopolitical operational risks.
Which company shows a better risk-adjusted profile?
Match Group’s most impactful risk is its heavy debt load, which strains financial flexibility despite strong profitability. Unity Software’s key risk lies in poor profitability and weak financial stability, reflected in distressed Altman Z-scores. Despite debt concerns, Match Group shows a better risk-adjusted profile, supported by its favorable operating metrics and strong Piotroski score. Unity’s negative margins and weak coverage ratios highlight urgent financial distress, justifying cautious positioning.
Final Verdict: Which stock to choose?
Unity Software’s superpower lies in its relentless investment in R&D, fueling a growing return on invested capital despite current value destruction. Its weak profitability and financial distress signals are points of vigilance. This stock might suit an aggressive growth portfolio willing to weather volatility for potential future gains.
Match Group commands a strategic moat through its recurring revenue model and operational efficiency, delivering solid free cash flow and a favorable margin profile. Though it carries higher debt levels, it offers better income quality and stability than Unity. It fits well in a GARP portfolio balancing growth with financial prudence.
If you prioritize breakthrough innovation with a tolerance for uneven profitability, Unity Software could be compelling due to its improving ROIC trend. However, if you seek greater financial stability and consistent cash generation, Match Group offers better defensive qualities despite a declining ROIC trend. Both present distinct analytical scenarios for different investor profiles.
Disclaimer: Investment carries a risk of loss of initial capital. The past performance is not a reliable indicator of future results. Be sure to understand risks before making an investment decision.
Go Further
I encourage you to read the complete analyses of Unity Software Inc. and Match Group, Inc. to enhance your investment decisions: