Home > Comparison > Technology > UBER vs MTCH
The strategic rivalry between Uber Technologies, Inc. and Match Group, Inc. shapes the Technology sector’s application software landscape. Uber operates a capital-intensive platform connecting mobility, delivery, and freight services globally, while Match Group focuses on high-margin dating products with a diverse brand portfolio. This analysis pits Uber’s expansive network against Match’s niche market dominance to identify which offers a superior risk-adjusted return for diversified portfolios in 2026.
Table of contents
Companies Overview
Uber Technologies and Match Group hold significant positions in the global application software market, each commanding distinct consumer bases.
Uber Technologies, Inc.: Global Mobility and Delivery Leader
Uber dominates the mobility and delivery services market through its proprietary technology connecting riders with drivers and consumers with delivery providers. Its core revenue streams span Mobility, Delivery, and Freight segments. In 2026, Uber continues to focus strategically on expanding its logistics capabilities and integrating financial partnerships to enhance platform efficiency and scale.
Match Group, Inc.: Premier Online Dating Platform
Match Group leads the online dating sector with a diverse portfolio including Tinder and OkCupid. Its revenue primarily derives from subscription-based dating services worldwide. In 2026, the firm emphasizes product innovation and brand diversification to strengthen user engagement and monetize its customer base across various demographics and geographies.
Strategic Collision: Similarities & Divergences
Both companies leverage platform-based business models yet diverge sharply in focus—Uber operates a multi-service ecosystem bridging transportation and delivery, while Match Group specializes in social connections through dating apps. Their primary battleground is user engagement and retention within highly competitive digital marketplaces. Uber exhibits a capital-intensive growth profile; Match Group relies more on scalable subscription revenues, defining distinct investment risk and return dynamics.
Income Statement Comparison
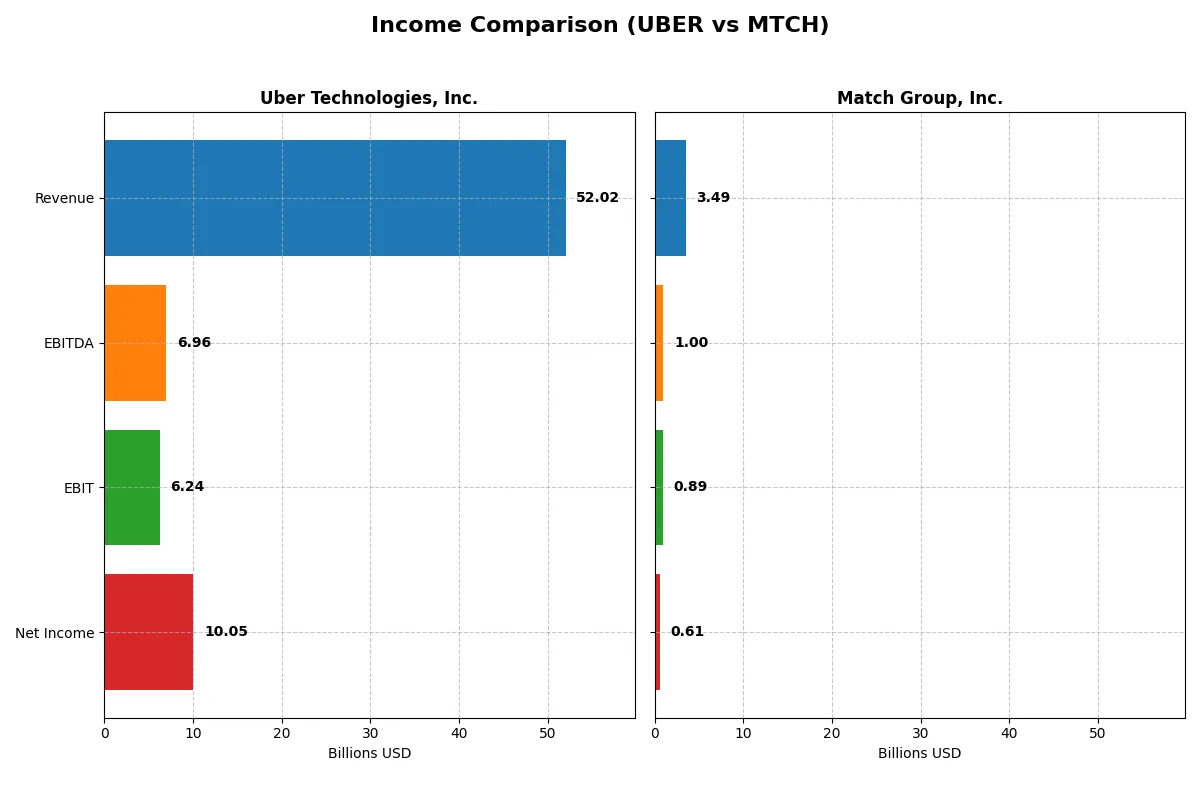
This data dissects the core profitability and scalability of both corporate engines to reveal who dominates the bottom line:
| Metric | Uber Technologies, Inc. (UBER) | Match Group, Inc. (MTCH) |
|---|---|---|
| Revenue | 52.0B | 3.49B |
| Cost of Revenue | 31.3B | 948M |
| Operating Expenses | 15.1B | 1.67B |
| Gross Profit | 20.7B | 2.54B |
| EBITDA | 6.96B | 999M |
| EBIT | 6.24B | 894M |
| Interest Expense | 440M | 148M |
| Net Income | 10.1B | 613M |
| EPS | 4.82 | 2.53 |
| Fiscal Year | 2025 | 2025 |
Income Statement Analysis: The Bottom-Line Duel
This income statement comparison reveals which company runs a more efficient and profitable corporate engine through key profitability and growth metrics.
Uber Technologies, Inc. Analysis
Uber’s revenue surged from 17.5B in 2021 to 52B in 2025, showcasing robust expansion. Net income reversed from a -496M loss in 2021 to 10B in 2025, signaling a sharp turnaround. Gross margin stabilized near 40%, while net margin hit 19.3%, reflecting improved operational efficiency and strong momentum in the latest year.
Match Group, Inc. Analysis
Match Group’s revenue grew modestly from 3B in 2021 to 3.49B in 2025. Net income more than doubled, reaching 613M in 2025 from 277M in 2021. Its gross margin remains high at 72.8%, with net margin at 17.6%, indicating excellent cost control. Recent growth slowed, but profitability and margin expansion continue steadily.
Growth Surge vs. Margin Mastery
Uber dominates in revenue scale and net income growth, growing over 200% in both measures since 2021, while maintaining solid margins. Match Group commands superior gross and EBIT margins, showing refined cost efficiency despite slower top-line growth. Investors seeking rapid expansion may favor Uber; those prioritizing margin strength may prefer Match’s steady profitability profile.
Financial Ratios Comparison
These vital ratios act as a diagnostic tool to expose the underlying fiscal health, valuation premiums, and capital efficiency of the companies compared below:
| Ratios | Uber Technologies, Inc. (UBER) | Match Group, Inc. (MTCH) |
|---|---|---|
| ROE | 37.18% | -2.42% |
| ROIC | 11.21% | 18.50% |
| P/E | 16.85 | 12.77 |
| P/B | 6.27 | -30.91 |
| Current Ratio | 1.14 | 1.42 |
| Quick Ratio | 1.14 | 1.42 |
| D/E | 0.50 | -15.67 |
| Debt-to-Assets | 21.80% | 89.06% |
| Interest Coverage | 12.65 | 5.91 |
| Asset Turnover | 0.84 | 0.78 |
| Fixed Asset Turnover | 17.28 | 26.59 |
| Payout ratio | 0% | 30.36% |
| Dividend yield | 0% | 2.38% |
| Fiscal Year | 2025 | 2025 |
Efficiency & Valuation Duel: The Vital Signs
Ratios act as a company’s DNA, revealing hidden risks and operational excellence behind headline numbers.
Uber Technologies, Inc.
Uber delivers strong profitability with a 37.18% ROE and a solid 19.33% net margin, signaling robust operational efficiency. Its P/E ratio of 16.85 suggests a fairly valued stock, although a high P/B ratio of 6.27 indicates some valuation stretch. Uber lacks dividends, choosing to reinvest heavily in R&D for growth and innovation.
Match Group, Inc.
Match Group posts a favorable 17.59% net margin and an impressive 18.5% ROIC, showing efficient capital use despite a negative ROE. The P/E of 12.77 points to an attractively priced stock. With a 2.38% dividend yield, Match returns capital to shareholders while balancing high debt levels and ongoing investments in R&D.
Valuation Discipline vs. Operational Strength
Uber offers superior profitability and reinvests for long-term growth but trades at a premium P/B ratio. Match Group combines solid margins with shareholder dividends yet carries higher leverage risk. Investors seeking growth with operational efficiency may prefer Uber; those favoring income and valuation appeal might lean toward Match.
Which one offers the Superior Shareholder Reward?
I compare Uber and Match Group’s shareholder reward through dividends and buybacks in 2026. Uber pays no dividends and reinvests all free cash flow into growth, boasting a strong 0.97 FCF/OCF ratio and modest buybacks. Match Group yields 2.38%, with a 30% payout ratio, balancing dividends and buybacks for steady cash returns. Match’s price-to-free-cash-flow ratio of 7.7 signals better valuation than Uber’s 17.4. I see Match’s combined dividend and buyback distribution as more sustainable and attractive, offering superior total shareholder return in 2026.
Comparative Score Analysis: The Strategic Profile
The radar chart reveals the fundamental DNA and trade-offs of Uber Technologies, Inc. and Match Group, Inc., highlighting their core financial strengths and vulnerabilities:
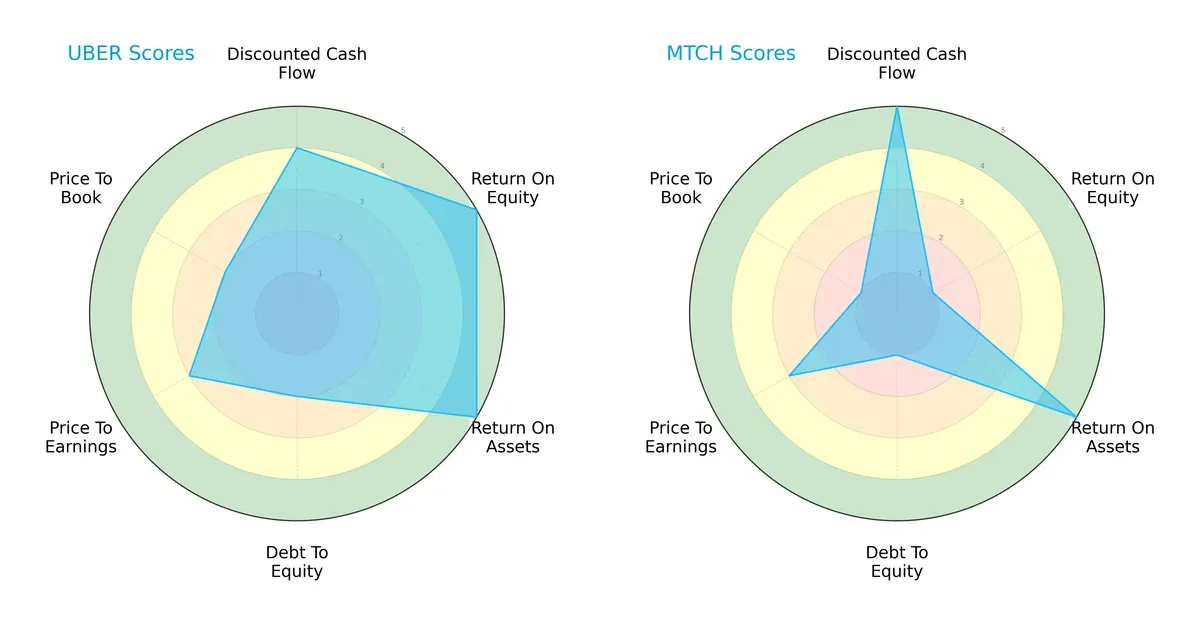
Uber shows a well-rounded profile with strong ROE and ROA scores (5 each), signaling superior profitability and asset efficiency. However, its debt-to-equity and price-to-book scores lag (2 each), reflecting balance sheet leverage and valuation concerns. Match Group excels in discounted cash flow (5) and matches Uber’s ROA (5), but suffers from weak ROE (1) and debt-to-equity scores (1), indicating financial risk and shareholder return challenges. Uber presents a more balanced strategic profile, while Match Group relies heavily on cash flow strength amid financial constraints.
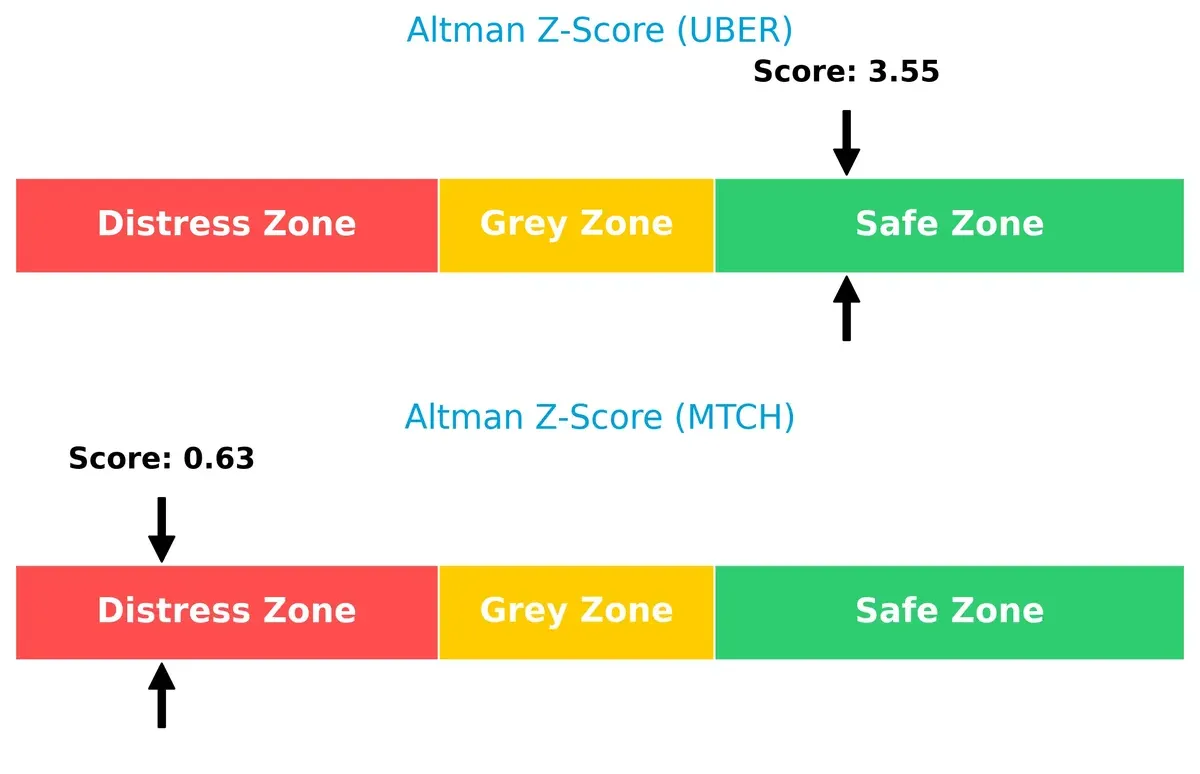
Bankruptcy Risk: Solvency Showdown
Uber’s Altman Z-Score of 3.55 places it firmly in the safe zone, signaling strong long-term survival prospects. Match Group’s 0.63 score flags distress, indicating a high bankruptcy risk in this economic cycle:
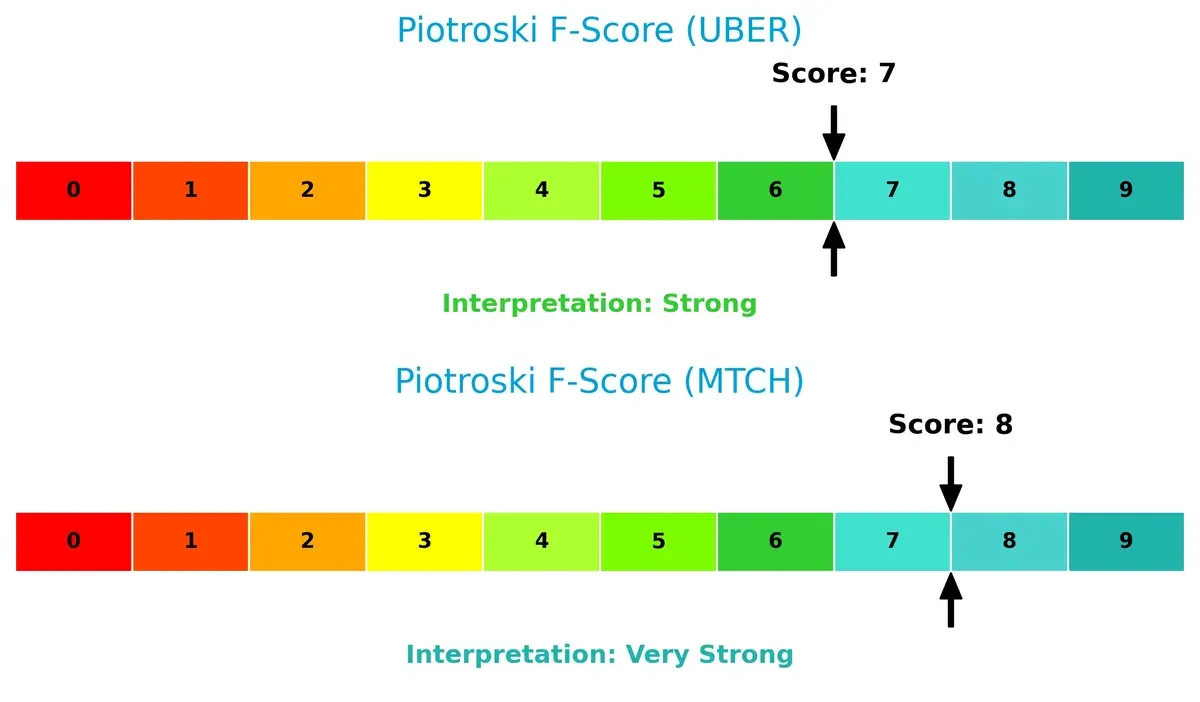
Financial Health: Quality of Operations
Match Group’s Piotroski F-Score of 8 edges out Uber’s 7, suggesting marginally better internal financial health and operational quality. Neither firm shows immediate red flags, but Uber’s lower score indicates slightly weaker fundamentals:
How are the two companies positioned?
This section dissects Uber and Match Group’s operational DNA by comparing revenue distribution and internal strengths and weaknesses. The goal is to confront their economic moats and identify which model offers the most resilient competitive advantage today.
Revenue Segmentation: The Strategic Mix
This visual comparison dissects how Uber Technologies, Inc. and Match Group, Inc. diversify their income streams and where their primary sector bets lie:
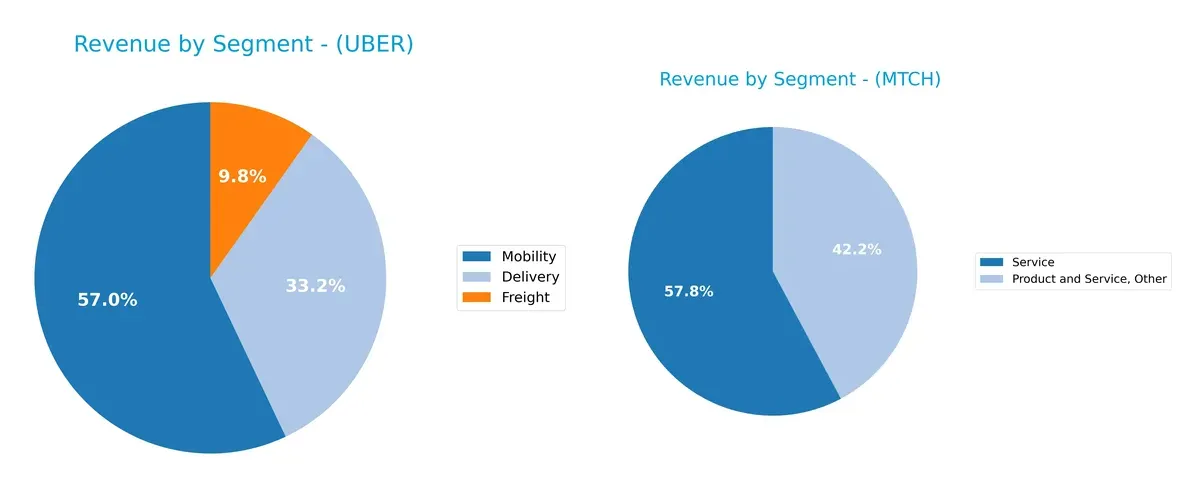
Uber anchors its revenue in Mobility with $29.7B, followed by Delivery at $17.2B and Freight at $5.1B, showing a well-diversified portfolio across transportation and logistics. Match Group’s data lacks recent segmentation but historically depends heavily on Dating services, indicating concentration risk. Uber’s diversified streams reduce dependency on a single market, while Match Group’s focus could limit resilience against sector shifts. Uber leverages ecosystem lock-in through multiple mobility verticals.
Strengths and Weaknesses Comparison
This table compares the Strengths and Weaknesses of Uber and Match Group based on diversification, profitability, financials, innovation, global presence, and market share:
Uber Strengths
- Diverse revenue streams across Delivery, Freight, Mobility segments
- Favorable net margin at 19.33%
- Strong ROE of 37.18% and ROIC above WACC
- Low debt-to-assets ratio at 21.8%
- Solid interest coverage at 14.18
- Extensive global presence, especially in US and EMEA
Match Group Strengths
- Favorable net margin at 17.59%
- High ROIC at 18.5%, exceeding WACC
- Favorable P/E and P/B ratios indicate market confidence
- Positive dividend yield of 2.38%
- Strong quick ratio and interest coverage
- Focused US and Non-US geographic revenue streams
Uber Weaknesses
- Unfavorable high price-to-book ratio at 6.27
- Neutral current ratio at 1.14 limits liquidity cushion
- No dividend yield may deter income investors
- Asset turnover neutral at 0.84 indicates efficiency limits
- Heavy reliance on US market for majority revenue
Match Group Weaknesses
- Negative ROE at -241.99% signals profitability issues
- Very high debt-to-assets ratio at 89.06% increases financial risk
- Negative debt-to-equity ratio complicates leverage assessment
- Neutral current ratio at 1.42 limits liquidity safety
- Smaller global footprint compared to Uber
Uber shows strength in diversified revenue and strong profitability metrics, leveraging a broad global footprint. Match Group excels in capital efficiency and dividend payments but faces challenges in profitability and high leverage. These differences imply contrasting strategic focuses — Uber on scale and diversification, Match Group on capital returns and market niche.
The Moat Duel: Analyzing Competitive Defensibility
A structural moat is the only reliable shield protecting long-term profits from relentless competitive erosion. Let’s dissect the nature of these moats:
Uber Technologies, Inc.: Network Effect Powerhouse
Uber’s moat stems from powerful network effects, connecting millions of riders and drivers globally. This scale drives a favorable 2.4% ROIC premium over WACC and margin stability. Expansion into freight and delivery in 2026 could deepen its moat further.
Match Group, Inc.: Intangible Asset Stronghold
Match Group’s strength lies in its portfolio of highly recognized dating brands, an intangible asset moat. It commands a robust 10.9% ROIC premium but shows a declining ROIC trend. Growth slowing in 2025 hints at challenges expanding beyond core markets.
Network Effects vs. Brand Portfolio Moats
Uber’s growing network effect moat outpaces Match’s intangible asset moat in depth and sustainability. Despite Match’s higher ROIC premium, Uber’s expanding multi-segment presence better equips it to defend and grow market share in evolving competitive landscapes.
Which stock offers better returns?
Over the past year, both Uber Technologies, Inc. and Match Group, Inc. experienced declining stock prices, with Uber showing higher volatility and more pronounced recent losses.
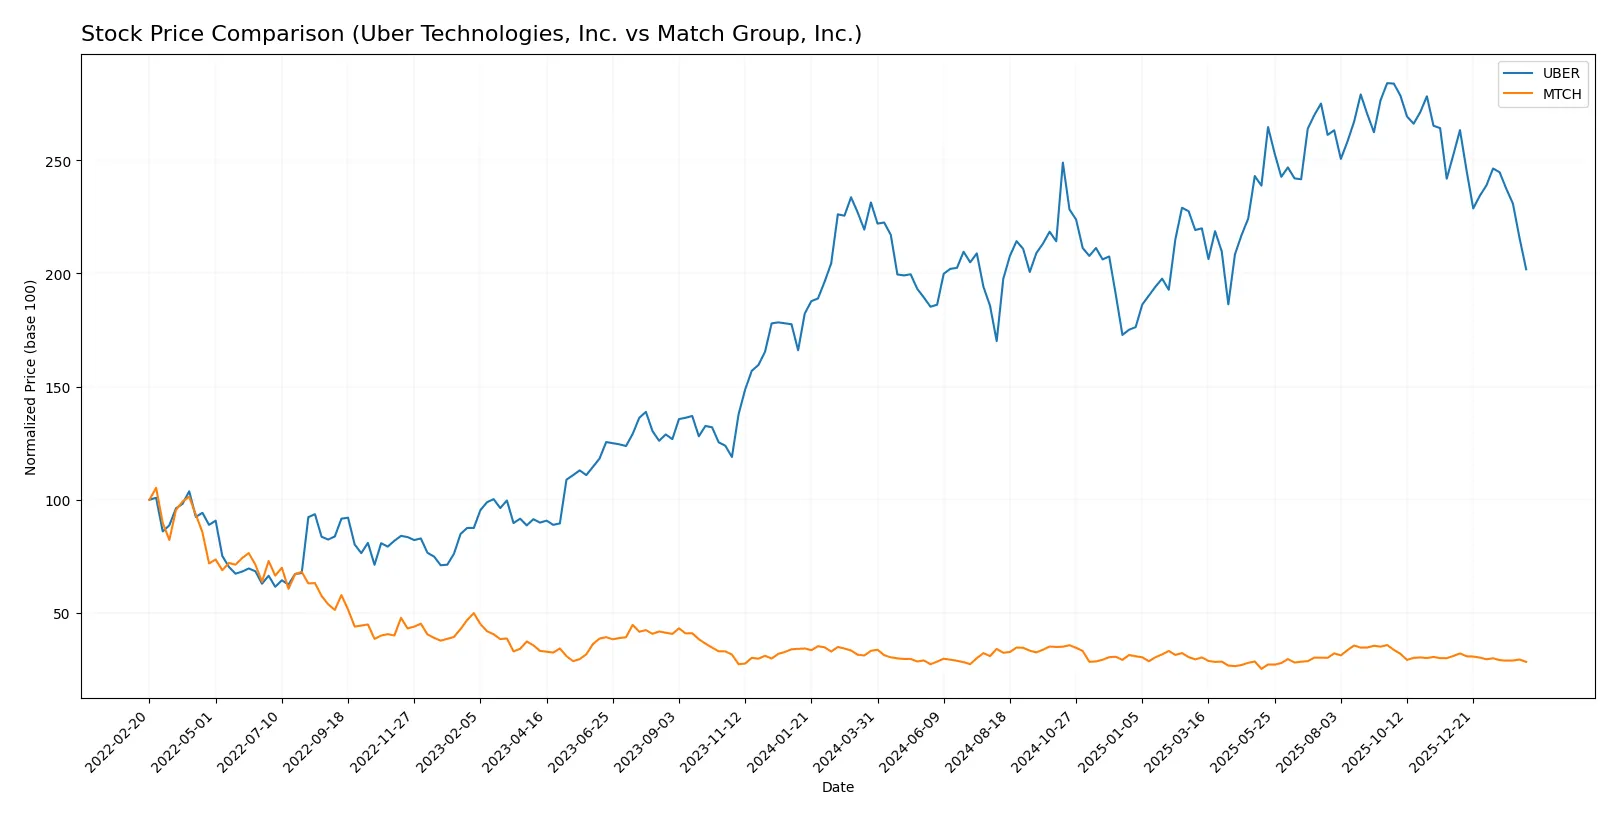
Trend Comparison
Uber’s stock declined 12.76% over the past 12 months, reflecting a bearish trend with decelerating losses. Its price fluctuated between 59 and 99, showing significant volatility (std. dev. 10.33).
Match Group’s stock fell 14.69% over the same period, also bearish with deceleration. Its price ranged from 27 to 39, with lower volatility (std. dev. 2.63) than Uber.
Both stocks underperformed, but Uber’s decline was slightly less severe. Uber delivered marginally better market performance despite higher volatility and recent sharper losses.
Target Prices
Analysts present a mixed but generally optimistic target consensus for Uber Technologies and Match Group.
| Company | Target Low | Target High | Consensus |
|---|---|---|---|
| Uber Technologies, Inc. | 72 | 140 | 105.76 |
| Match Group, Inc. | 33 | 43 | 36 |
Uber’s consensus target of 105.76 suggests a 51% upside from its current 69.99 price, reflecting strong growth expectations. Match Group’s 36 consensus target offers a modest 18% potential gain versus its 30.5 market price.

Don’t Let Luck Decide Your Entry Point
Optimize your entry points with our advanced ProRealTime indicators. You’ll get efficient buy signals with precise price targets for maximum performance. Start outperforming now!
How do institutions grade them?
Here is a summary of recent institutional grades for Uber Technologies, Inc. and Match Group, Inc.:
Uber Technologies, Inc. Grades
This table presents recent grade updates from major financial institutions for Uber Technologies, Inc.:
| Grading Company | Action | New Grade | Date |
|---|---|---|---|
| Citigroup | Maintain | Buy | 2026-02-06 |
| Morgan Stanley | Maintain | Overweight | 2026-02-05 |
| Wedbush | Maintain | Neutral | 2026-02-05 |
| Benchmark | Maintain | Hold | 2026-02-05 |
| JP Morgan | Maintain | Overweight | 2026-02-05 |
| Citizens | Upgrade | Market Outperform | 2026-02-05 |
| RBC Capital | Maintain | Outperform | 2026-02-05 |
| Wells Fargo | Maintain | Overweight | 2026-02-05 |
| Mizuho | Maintain | Outperform | 2026-02-05 |
| Needham | Maintain | Buy | 2026-02-05 |
Match Group, Inc. Grades
This table shows recent institutional grades for Match Group, Inc.:
| Grading Company | Action | New Grade | Date |
|---|---|---|---|
| TD Cowen | Maintain | Buy | 2026-02-05 |
| JP Morgan | Maintain | Neutral | 2026-02-04 |
| Truist Securities | Maintain | Hold | 2026-02-04 |
| Morgan Stanley | Maintain | Equal Weight | 2026-01-13 |
| Wells Fargo | Maintain | Equal Weight | 2025-11-05 |
| Evercore ISI Group | Maintain | In Line | 2025-11-05 |
| Truist Securities | Maintain | Hold | 2025-11-05 |
| Morgan Stanley | Maintain | Equal Weight | 2025-10-20 |
| Susquehanna | Maintain | Positive | 2025-08-07 |
| Evercore ISI Group | Maintain | In Line | 2025-08-06 |
Which company has the best grades?
Uber Technologies, Inc. has generally stronger grades, including multiple “Buy,” “Outperform,” and “Overweight” ratings. Match Group, Inc. mostly receives “Hold,” “Neutral,” and “Equal Weight” grades. Investors might view Uber’s higher ratings as reflecting greater confidence from analysts.
Risks specific to each company
The following categories identify the critical pressure points and systemic threats facing both firms in the 2026 market environment:
1. Market & Competition
Uber Technologies, Inc.
- Operates in highly competitive global mobility and delivery markets with constant innovation pressure.
Match Group, Inc.
- Faces intense competition in online dating, requiring constant brand differentiation and user engagement.
2. Capital Structure & Debt
Uber Technologies, Inc.
- Maintains moderate leverage with debt-to-equity at 0.5, favorable interest coverage.
Match Group, Inc.
- Exhibits high financial risk with debt-to-assets at 89%, negative debt-to-equity, signaling potential distress.
3. Stock Volatility
Uber Technologies, Inc.
- Beta of 1.206 implies moderate volatility aligned with tech sector norms.
Match Group, Inc.
- Beta of 1.315 indicates slightly higher volatility, reflecting market sensitivity.
4. Regulatory & Legal
Uber Technologies, Inc.
- Faces regulatory scrutiny on gig economy labor practices and data privacy globally.
Match Group, Inc.
- Subject to evolving data privacy laws affecting user data and platform operations.
5. Supply Chain & Operations
Uber Technologies, Inc.
- Complex logistics and driver network expose Uber to operational disruptions.
Match Group, Inc.
- Primarily digital platform with limited supply chain risks but reliant on platform stability.
6. ESG & Climate Transition
Uber Technologies, Inc.
- Under pressure to reduce carbon footprint amid regulatory climate targets globally.
Match Group, Inc.
- ESG risks are more reputational and data privacy-related than environmental.
7. Geopolitical Exposure
Uber Technologies, Inc.
- Operates globally, exposed to trade tensions and regulatory divergence in key markets.
Match Group, Inc.
- Mainly North American focus, less geopolitical risk but vulnerable to US regulation shifts.
Which company shows a better risk-adjusted profile?
Uber’s most impactful risk is operational complexity and regulatory scrutiny in a highly competitive global market. Match Group faces critical financial distress risk due to its excessive leverage and low Altman Z-score in the distress zone. Uber’s strong Altman Z-score and more balanced capital structure give it a superior risk-adjusted profile. Match’s high debt levels and weak equity returns highlight greater financial vulnerability, despite a very strong Piotroski score. These elements underscore Uber’s comparatively safer investment stance in 2026.
Final Verdict: Which stock to choose?
Uber’s superpower lies in its robust and growing return on invested capital, signaling strong value creation and operational efficiency. Its main point of vigilance is the relatively high price-to-book ratio, which could suggest premium valuation risk. Uber fits well in an aggressive growth portfolio seeking scalable market disruption.
Match Group’s strategic moat is its high return on invested capital combined with a resilient recurring revenue model supported by a dominant position in online dating. It offers better balance sheet safety metrics than Uber but faces challenges with declining ROIC trends. Match suits a GARP portfolio balancing growth with moderate risk controls.
If you prioritize aggressive growth and scalable market capture, Uber outshines due to its expanding profitability and operational leverage. However, if you seek steady cash flow with more defensive characteristics, Match Group offers better stability despite its profitability headwinds. Each company appeals to distinct investor profiles sensitive to growth versus stability trade-offs.
Disclaimer: Investment carries a risk of loss of initial capital. The past performance is not a reliable indicator of future results. Be sure to understand risks before making an investment decision.
Go Further
I encourage you to read the complete analyses of Uber Technologies, Inc. and Match Group, Inc. to enhance your investment decisions: