Home > Comparison > Technology > TYL vs MTCH
The strategic rivalry between Tyler Technologies, Inc. and Match Group, Inc. shapes the evolution of the technology sector. Tyler Technologies operates as a capital-intensive software provider focusing on integrated public sector solutions. In contrast, Match Group leads as a high-margin application software company specializing in global dating platforms. This analysis will dissect their divergent business models to identify which path offers superior risk-adjusted returns for a diversified portfolio.
Table of contents
Companies Overview
Tyler Technologies and Match Group both hold influential roles in the software application market, shaping public sector services and digital dating experiences.
Tyler Technologies, Inc.: Public Sector Software Powerhouse
Tyler Technologies dominates the public sector software space, generating revenue through integrated information management solutions for government agencies. Its core segments include Enterprise Software, Appraisal and Tax, and NIC. In 2026, the company focuses strategically on expanding cloud-hosted services via a partnership with Amazon Web Services, enhancing software delivery and scalability for municipal clients.
Match Group, Inc.: Global Dating Platform Leader
Match Group commands the online dating market with a diverse portfolio including Tinder, Match, and Hinge. It earns primarily from subscription and advertising revenues across its global user base. The firm’s 2026 strategy emphasizes brand diversification and international growth, leveraging its multi-brand ecosystem to capture a wide demographic and increase user engagement.
Strategic Collision: Similarities & Divergences
Both companies leverage software to solve distinct market needs but adopt contrasting philosophies: Tyler Technologies builds a closed ecosystem tailored to public sector complexities, while Match Group pursues an open infrastructure fostering multiple dating brands. Their primary battleground is user engagement—municipal clients for Tyler and individual consumers for Match. This divergence defines their unique risk profiles and growth trajectories.
Income Statement Comparison
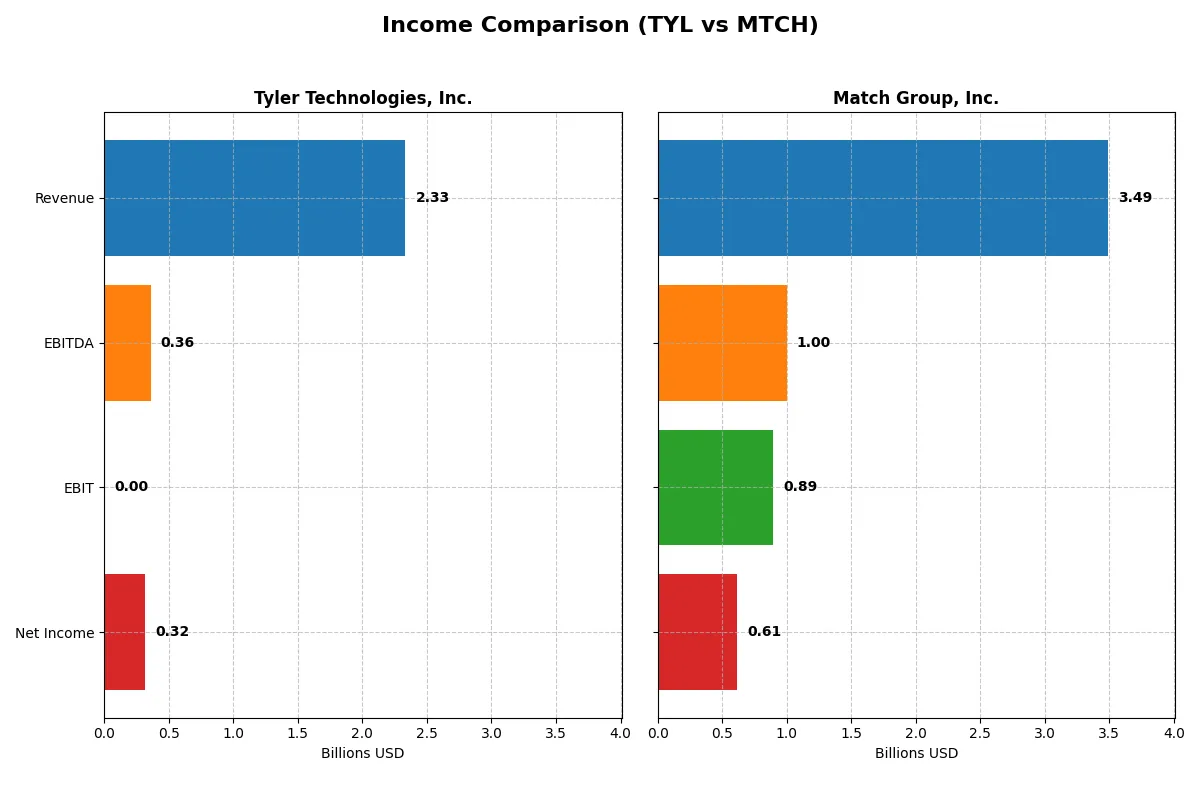
The following data dissects the core profitability and scalability of both corporate engines to reveal who dominates the bottom line:
| Metric | Tyler Technologies, Inc. (TYL) | Match Group, Inc. (MTCH) |
|---|---|---|
| Revenue | 2.33B | 3.49B |
| Cost of Revenue | 1.25B | 948M |
| Operating Expenses | 670M | 1.67B |
| Gross Profit | 1.08B | 2.54B |
| EBITDA | 358M | 999M |
| EBIT | 0 | 894M |
| Interest Expense | 5M | 148M |
| Net Income | 316M | 613M |
| EPS | 7.32 | 2.53 |
| Fiscal Year | 2025 | 2025 |
Income Statement Analysis: The Bottom-Line Duel
This income statement comparison reveals the true efficiency of each company’s business model and operational execution over recent years.
Tyler Technologies, Inc. Analysis
Tyler Technologies shows a strong revenue growth trajectory, reaching 2.33B in 2025 with net income rising to 316M. Its gross margin stands healthy at 46.46%, and net margin improves to 13.53%, reflecting solid profitability. However, its EBIT margin is zero, indicating operational challenges despite momentum in revenue and net income growth.
Match Group, Inc. Analysis
Match Group reports higher revenue at 3.49B in 2025, with net income climbing to 613M. It sustains a robust gross margin of 72.8% and a strong net margin of 17.59%, accompanied by a healthy EBIT margin near 25.62%. Despite minimal revenue growth last year, its margins suggest efficient cost control and sustainable profitability.
Margin Strength vs. Scale and Momentum
Match Group clearly leads in margin efficiency and absolute scale, delivering superior profitability ratios and larger net income. Tyler Technologies impresses with faster revenue and net income growth but struggles with operational margins. For investors, Match Group’s profile offers stable high margins, while Tyler’s growth story carries operational risks to monitor.
Financial Ratios Comparison
These vital ratios act as a diagnostic tool to expose the underlying fiscal health, valuation premiums, and capital efficiency of the companies compared below:
| Ratios | Tyler Technologies, Inc. (TYL) | Match Group, Inc. (MTCH) |
|---|---|---|
| ROE | 7.76% (2024) | -2.42% (2025) |
| ROIC | 6.20% (2024) | 18.50% (2025) |
| P/E | 93.42 (2024) | 12.77 (2025) |
| P/B | 7.25 (2024) | -30.91 (2025) |
| Current Ratio | 1.35 (2024) | 1.42 (2025) |
| Quick Ratio | 1.35 (2024) | 1.42 (2025) |
| D/E | 0.19 (2024) | -15.67 (2025) |
| Debt-to-Assets | 12.32% (2024) | 89.06% (2025) |
| Interest Coverage | 50.50 (2024) | 5.91 (2025) |
| Asset Turnover | 0.41 (2024) | 0.78 (2025) |
| Fixed Asset Turnover | 10.95 (2024) | 26.59 (2025) |
| Payout Ratio | 0% (2024) | 30.36% (2025) |
| Dividend Yield | 0% (2024) | 2.38% (2025) |
| Fiscal Year | 2024 | 2025 |
Efficiency & Valuation Duel: The Vital Signs
Ratios act as a company’s financial DNA, uncovering hidden risks and revealing operational excellence critical for investment decisions.
Tyler Technologies, Inc.
Tyler Technologies shows a solid net margin of 13.53%, yet its valuation appears stretched with a P/E of 61.99, indicating expensive stock pricing. Return on equity is absent, reflecting weak profitability. The company lacks dividends, instead directing resources towards R&D and growth, signaling a reinvestment strategy for future gains.
Match Group, Inc.
Match Group delivers a stronger net margin of 17.59% and a more attractive P/E of 12.77, portraying efficient profitability and reasonable valuation. Despite a negative ROE, its robust ROIC at 18.5% and a healthy dividend yield of 2.38% provide shareholders with direct returns and operational strength amid moderate leverage risks.
Premium Valuation vs. Operational Safety
Match Group balances efficiency and shareholder returns better than Tyler, whose high valuation and lackluster profitability raise caution. Investors seeking operational safety and income may prefer Match’s profile, while those tolerating valuation risk might consider Tyler’s growth focus.
Which one offers the Superior Shareholder Reward?
I observe Tyler Technologies (TYL) reinvests all free cash flow into growth, with no dividends and no buybacks, yielding zero immediate income. Match Group (MTCH) pays a 2.38% dividend yield with a 30% payout ratio, supported by solid FCF coverage. MTCH also executes consistent buybacks, enhancing total returns. Historically, dividend plus buyback strategies, like MTCH’s, often outperform pure growth reinvestment when priced attractively. Given MTCH’s lower P/E (13x vs. TYL’s 62x) and active distributions, I conclude MTCH offers a more attractive, sustainable shareholder reward in 2026.
Comparative Score Analysis: The Strategic Profile
The radar chart unveils the core DNA and trade-offs of Tyler Technologies and Match Group, highlighting their distinct financial strengths and vulnerabilities:
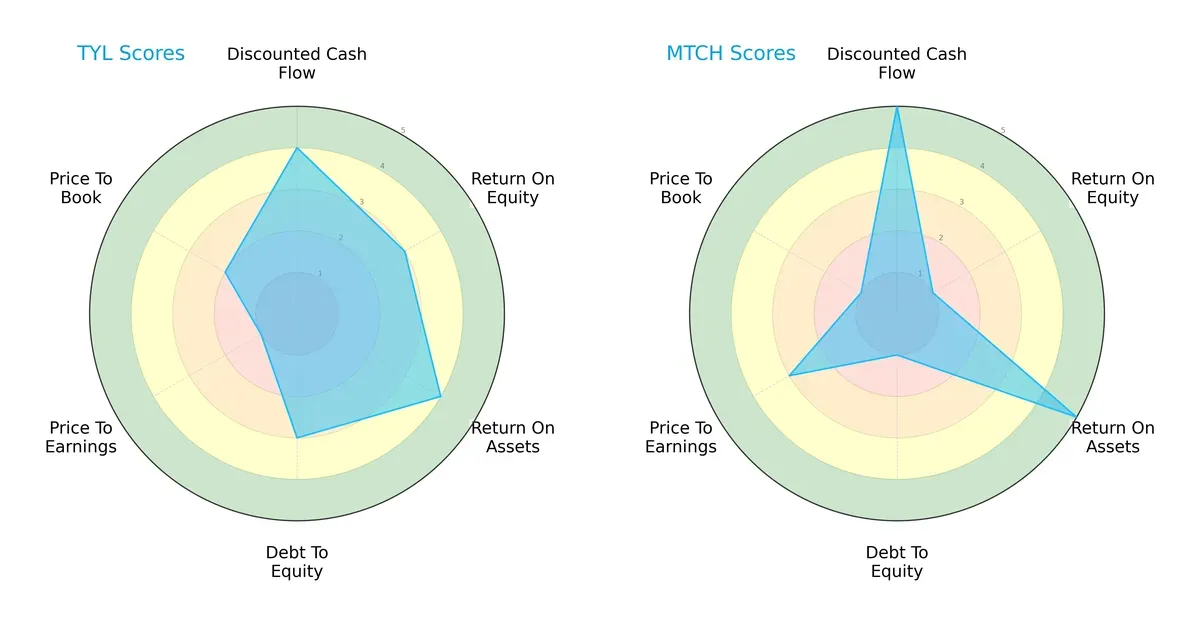
Tyler Technologies presents a balanced profile with solid DCF (4) and ROA (4) scores, moderate ROE (3), and manageable debt levels (3). However, its valuation scores lag, with a very unfavorable P/E (1) and unfavorable P/B (2), signaling potential overvaluation concerns. Match Group excels in DCF (5) and ROA (5), showing superior cash flow and asset utilization, but suffers from weak equity returns (ROE 1) and high leverage risk (debt-to-equity 1). Its valuation metrics are moderate to poor (P/E 3, P/B 1). Overall, Tyler relies on steady operational efficiency, while Match depends heavily on cash flow advantages but carries greater financial risk.
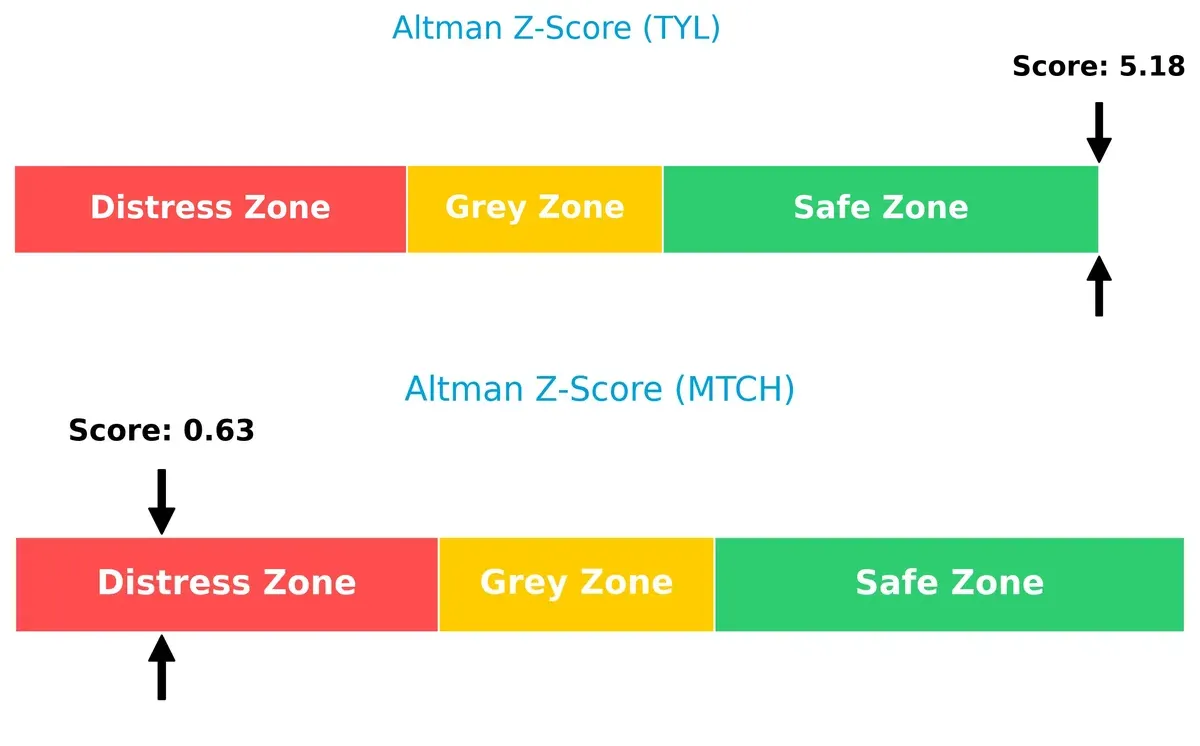
Bankruptcy Risk: Solvency Showdown
Tyler’s Altman Z-Score of 5.18 places it firmly in the safe zone, indicating strong solvency and low bankruptcy risk. In contrast, Match’s score of 0.63 signals distress, raising red flags about long-term survival in this volatile cycle:
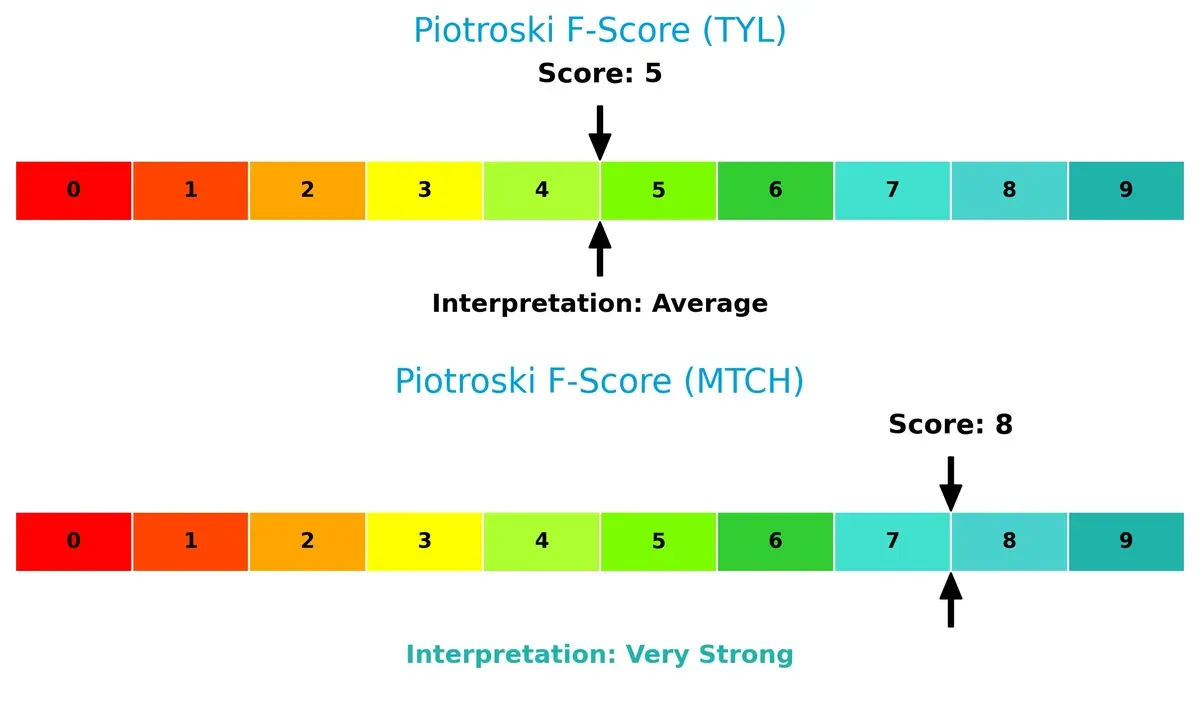
Financial Health: Quality of Operations
Match Group’s Piotroski F-Score of 8 reflects very strong financial health, showcasing excellent internal metrics and operational quality. Tyler scores a moderate 5, suggesting average financial resilience but with some areas needing improvement:
How are the two companies positioned?
This section dissects Tyler Technologies and Match Group’s operational DNA by comparing their revenue distribution and internal strengths and weaknesses. The goal is to confront their economic moats to identify which model delivers the most resilient competitive advantage today.
Revenue Segmentation: The Strategic Mix
This visual comparison dissects how Tyler Technologies and Match Group diversify their income streams and where their primary sector bets lie:
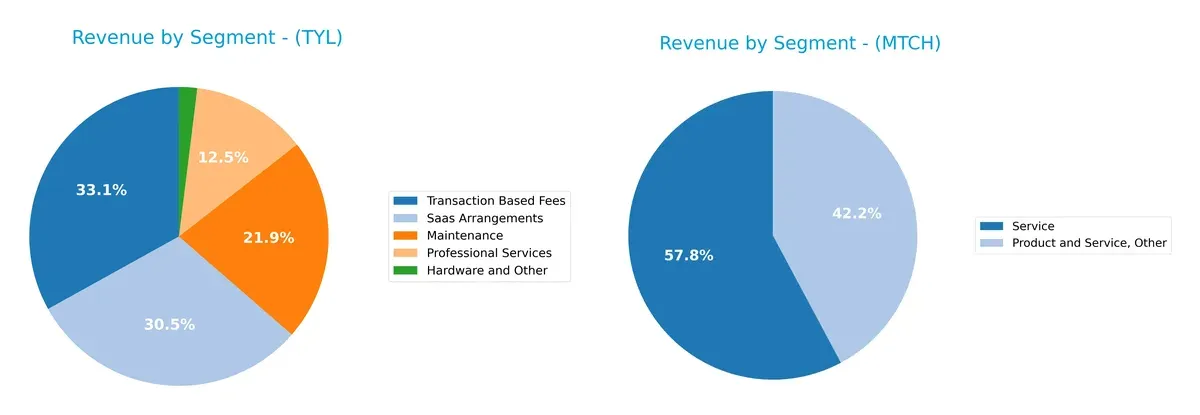
Tyler Technologies spreads revenue across five key segments, with Transaction Based Fees leading at 698M, followed by SaaS Arrangements at 645M. This mix suggests a balanced ecosystem relying on recurring and transactional income. Match Group, by contrast, pivots heavily on two segments—Service at 1.36B and Product and Service, Other at 989M—revealing concentration risks but strong positioning in digital matchmaking services. Tyler’s model anchors on infrastructure diversity; Match Group relies on platform dominance.
Strengths and Weaknesses Comparison
This table compares the strengths and weaknesses of Tyler Technologies, Inc. and Match Group, Inc.:
Tyler Technologies Strengths
- Diversified revenue streams across SaaS, transaction fees, and services
- Favorable net margin at 13.5%
- Low debt-to-assets ratio signaling strong balance sheet discipline
Match Group Strengths
- Higher net margin at 17.6%
- Strong ROIC at 18.5%, above WACC of 7.65% indicating value creation
- Solid global presence with nearly $3.5B revenue outside the US
Tyler Technologies Weaknesses
- Unfavorable ROE and ROIC values indicate poor capital efficiency
- High P/E ratio of 62 suggests overvaluation risk
- Weak liquidity ratios (current and quick ratios at 0) raise solvency concerns
Match Group Weaknesses
- Negative debt-to-assets ratio at 89%, indicating high leverage risk
- Negative ROE at -242% signals profitability challenges
- Moderate asset turnover signals less efficient asset use
Tyler Technologies shows strength in diversified revenue but suffers from poor profitability metrics and liquidity issues. Match Group excels in profitability and global reach but faces risks from high leverage and negative equity returns. These factors critically influence their strategic positioning and financial health.
The Moat Duel: Analyzing Competitive Defensibility
A structural moat is the only thing protecting long-term profits from the erosion of competition. Let’s dissect two distinct moats:
Tyler Technologies, Inc.: Specialized Public Sector Integration
Tyler’s moat stems from its deep integration in public sector software, creating high switching costs. Despite strong revenue growth, ROIC trends down, signaling future margin pressure in 2026.
Match Group, Inc.: Network Effects in Digital Dating
Match Group’s moat relies on powerful network effects across its dating platforms. It consistently creates value with high ROIC above WACC, though a slight ROIC decline warns of potential competitive challenges.
Legacy Systems vs. Network Effects: Which Moat Holds Stronger?
Match Group holds a wider moat with a clear value-creating ROIC advantage over Tyler. Despite both showing declining ROIC trends, Match’s network-driven scale better defends market share in 2026.
Which stock offers better returns?
Both Tyler Technologies and Match Group show notable price declines over the past year, reflecting bearish trends with varying volatility and deceleration in downward momentum.
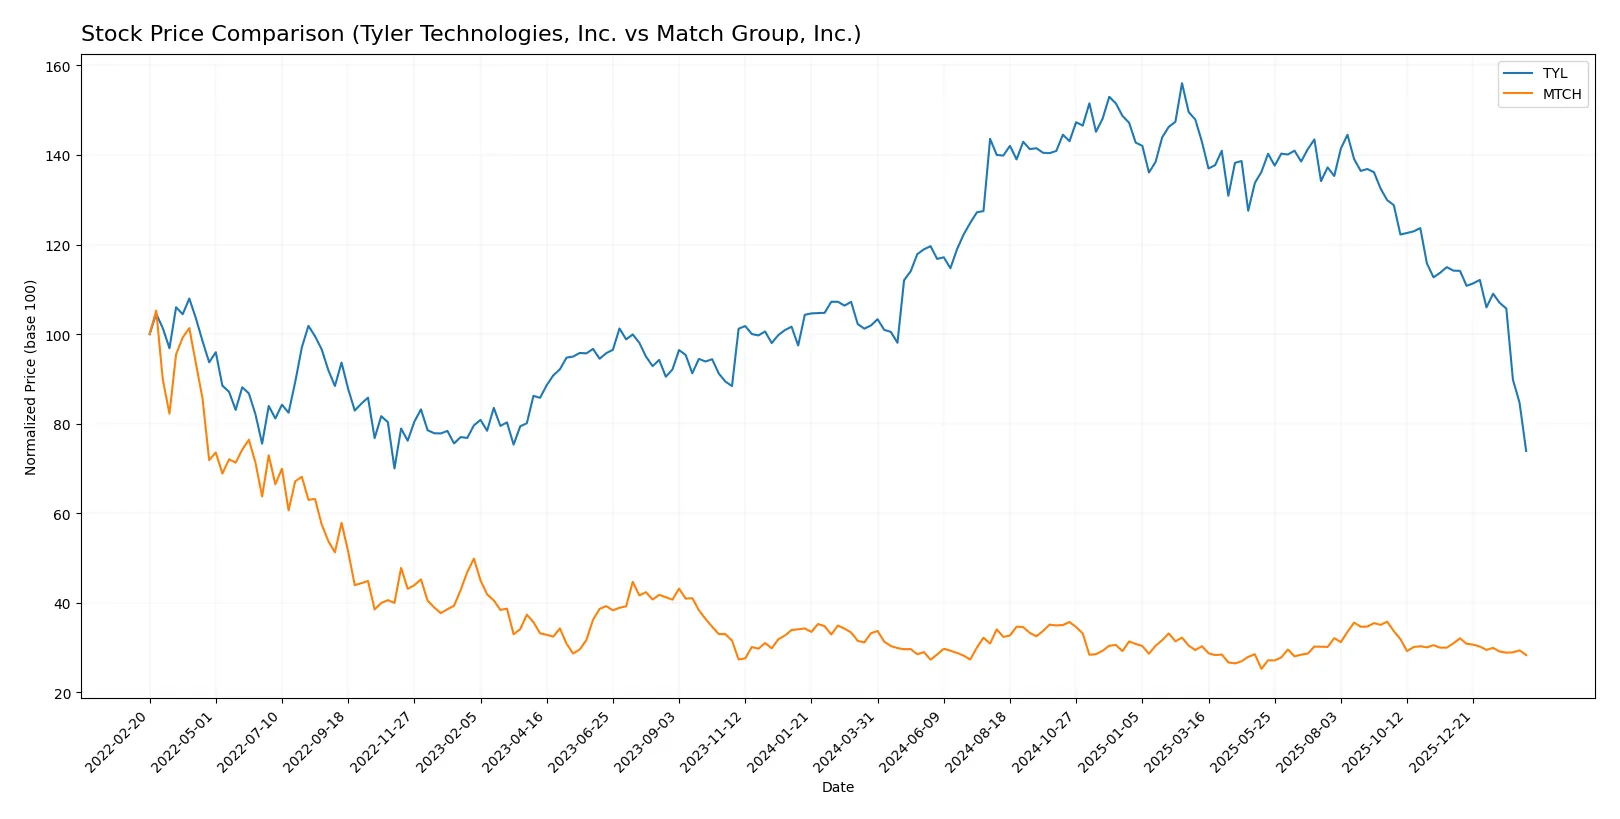
Trend Comparison
Tyler Technologies’ stock fell 27.51% over the past 12 months, showing a bearish trend with decelerating losses and high volatility, peaking at 641.7 and bottoming at 303.94.
Match Group’s stock dropped 14.69% over the same period, also bearish with deceleration, but much lower volatility, ranging from 38.51 to 27.18.
Tyler Technologies experienced the sharper decline, delivering weaker market performance than Match Group over the past year.
Target Prices
Analysts present a wide but clear consensus on target prices for Tyler Technologies and Match Group.
| Company | Target Low | Target High | Consensus |
|---|---|---|---|
| Tyler Technologies, Inc. | 325 | 675 | 474 |
| Match Group, Inc. | 33 | 43 | 36 |
Tyler’s consensus target of 474 implies a substantial upside from the current 304 price. Match Group’s 36 target also suggests moderate appreciation above its 30.5 price.

Don’t Let Luck Decide Your Entry Point
Optimize your entry points with our advanced ProRealTime indicators. You’ll get efficient buy signals with precise price targets for maximum performance. Start outperforming now!
How do institutions grade them?
Below is a comparison of institutional grades for Tyler Technologies, Inc. and Match Group, Inc.:
Tyler Technologies, Inc. Grades
This table shows recent grades from reputable analysts for Tyler Technologies, Inc.
| Grading Company | Action | New Grade | Date |
|---|---|---|---|
| Oppenheimer | Maintain | Outperform | 2026-02-13 |
| Piper Sandler | Maintain | Overweight | 2026-02-13 |
| Needham | Maintain | Buy | 2026-02-13 |
| TD Cowen | Maintain | Buy | 2026-02-13 |
| Evercore ISI Group | Maintain | In Line | 2026-02-13 |
| Wells Fargo | Maintain | Equal Weight | 2026-02-13 |
| Barclays | Maintain | Overweight | 2026-02-13 |
| Stifel | Maintain | Buy | 2026-02-13 |
| DA Davidson | Upgrade | Buy | 2026-02-11 |
| BTIG | Maintain | Buy | 2026-02-09 |
Match Group, Inc. Grades
This table shows recent grades from reputable analysts for Match Group, Inc.
| Grading Company | Action | New Grade | Date |
|---|---|---|---|
| TD Cowen | Maintain | Buy | 2026-02-05 |
| JP Morgan | Maintain | Neutral | 2026-02-04 |
| Truist Securities | Maintain | Hold | 2026-02-04 |
| Morgan Stanley | Maintain | Equal Weight | 2026-01-13 |
| Wells Fargo | Maintain | Equal Weight | 2025-11-05 |
| Evercore ISI Group | Maintain | In Line | 2025-11-05 |
| Truist Securities | Maintain | Hold | 2025-11-05 |
| Morgan Stanley | Maintain | Equal Weight | 2025-10-20 |
| Susquehanna | Maintain | Positive | 2025-08-07 |
| Evercore ISI Group | Maintain | In Line | 2025-08-06 |
Which company has the best grades?
Tyler Technologies holds consistently stronger grades, including multiple Buy and Outperform ratings. Match Group’s grades lean toward Hold and Equal Weight. Investors may view Tyler as having more favorable analyst sentiment.
Risks specific to each company
The following categories identify the critical pressure points and systemic threats facing both firms in the 2026 market environment:
1. Market & Competition
Tyler Technologies, Inc.
- Operates in public sector software with stable demand but faces slow growth and niche competition.
Match Group, Inc.
- Faces aggressive competition in the dating app market, requiring constant innovation and marketing spend.
2. Capital Structure & Debt
Tyler Technologies, Inc.
- Strong debt profile with favorable debt-to-equity and low leverage.
Match Group, Inc.
- High debt-to-assets ratio (89%), signaling elevated financial risk and potential refinancing challenges.
3. Stock Volatility
Tyler Technologies, Inc.
- Beta of 0.90 indicates lower volatility than the market, appealing to conservative investors.
Match Group, Inc.
- Beta of 1.32 shows higher volatility, increasing risk during market downturns.
4. Regulatory & Legal
Tyler Technologies, Inc.
- Exposed to public sector regulatory scrutiny, but stable due to long-term government contracts.
Match Group, Inc.
- Faces privacy and data protection regulations impacting global operations, with potential fines and compliance costs.
5. Supply Chain & Operations
Tyler Technologies, Inc.
- Relies on cloud infrastructure partnerships (e.g., AWS), which introduces dependency risk but ensures scalability.
Match Group, Inc.
- Operates digital products minimizing supply chain risks but depends heavily on platform stability and data centers.
6. ESG & Climate Transition
Tyler Technologies, Inc.
- Moderate ESG risk given public sector focus; must align with government sustainability mandates.
Match Group, Inc.
- Faces rising pressure to improve data privacy and diversity policies amid growing ESG investor demands.
7. Geopolitical Exposure
Tyler Technologies, Inc.
- Primarily US-focused, limiting geopolitical risks but also growth exposure internationally.
Match Group, Inc.
- Global footprint exposes it to geopolitical tensions, currency fluctuations, and regulatory variances.
Which company shows a better risk-adjusted profile?
Tyler Technologies’ strongest risk factor is its weak profitability and operational efficiency despite solid balance sheet metrics. Match Group’s largest risk stems from its heavy leverage and geopolitical exposure, but it boasts superior profitability and asset returns. Tyler offers lower volatility and financial stability. Match Group delivers higher returns but with amplified financial and regulatory risks. Recent data highlights Tyler’s unfavorable liquidity ratios as a red flag, while Match’s distressed Altman Z-Score signals bankruptcy risk despite a strong Piotroski score. Overall, Tyler Technologies presents a more conservative, risk-adjusted profile suited for defensive investors.
Final Verdict: Which stock to choose?
Tyler Technologies stands out for its steady revenue growth and strong cash flow generation, making it a reliable cash machine in the government software niche. However, its high valuation and weakening returns on invested capital warrant caution. It suits portfolios aiming for long-term growth with moderate risk tolerance.
Match Group’s strategic moat lies in its dominant position within the online dating ecosystem, supported by robust recurring revenues and efficient capital use. It offers better financial stability than Tyler, despite elevated debt levels. Ideal for investors seeking growth at a reasonable price with a higher income component.
If you prioritize consistent cash generation and long-term revenue expansion, Tyler Technologies presents a compelling scenario despite its valuation premium. However, if you seek a stronger moat combined with superior income stability, Match Group offers better resilience and value creation potential. Both require vigilance on their respective financial risks and market cycles.
Disclaimer: Investment carries a risk of loss of initial capital. The past performance is not a reliable indicator of future results. Be sure to understand risks before making an investment decision.
Go Further
I encourage you to read the complete analyses of Tyler Technologies, Inc. and Match Group, Inc. to enhance your investment decisions: