Home > Comparison > Technology > MSTR vs MTCH
The strategic rivalry between Strategy Inc and Match Group, Inc. shapes the Technology sector’s evolution. Strategy Inc operates as a bitcoin treasury and AI analytics provider, blending financial innovation with software applications. In contrast, Match Group dominates global dating platforms with a high-margin, consumer-focused software model. This analysis explores their divergent paths, weighing growth potential against risk to identify which offers superior risk-adjusted returns for a diversified portfolio.

Table of contents
Companies Overview
Strategy Inc and Match Group, Inc. both command significant market positions in the software application sector. Their distinct business models reflect divergent approaches to technology-driven revenue.
Strategy Inc: Bitcoin Treasury Innovator
Strategy Inc leads as a bitcoin treasury company with a global reach. It generates revenue by offering investors economic exposure to Bitcoin through equity and fixed income securities. In 2025, the company sharpened its focus on AI-powered enterprise analytics software, enabling non-technical users to derive actionable insights via its flagship products, Strategy One and Strategy Mosaic.
Match Group, Inc.: Global Dating Platform Leader
Match Group, Inc. dominates the online dating industry with a portfolio of well-known brands like Tinder and Hinge. It earns revenue primarily from subscription fees and advertising across its platforms. The company continues to prioritize expanding its user base and enhancing user engagement worldwide, solidifying its position as a market leader in digital dating.
Strategic Collision: Similarities & Divergences
Both companies operate in the technology sector but pursue vastly different philosophies: Strategy Inc embraces a data-driven, investment-centric model, while Match Group focuses on consumer engagement through digital platforms. Their primary battleground lies in leveraging software innovation—financial intelligence versus social connectivity. This divergence defines their unique risk-return profiles and investor appeal in 2026.
Income Statement Comparison
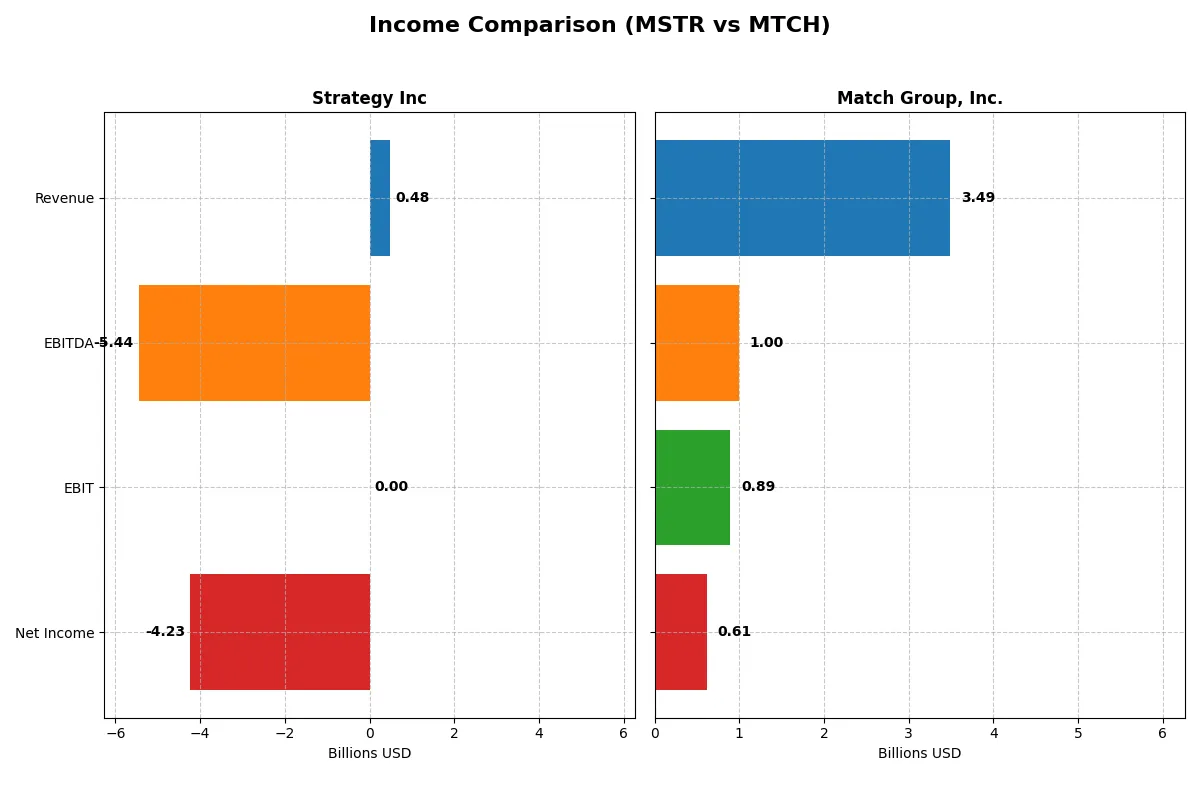
This data dissects the core profitability and scalability of both corporate engines to reveal who dominates the bottom line:
| Metric | Strategy Inc (MSTR) | Match Group, Inc. (MTCH) |
|---|---|---|
| Revenue | 477M | 3.49B |
| Cost of Revenue | 149M | 948M |
| Operating Expenses | 5.62B | 1.67B |
| Gross Profit | 328M | 2.54B |
| EBITDA | -5.44B | 999M |
| EBIT | 0 | 894M |
| Interest Expense | 65M | 148M |
| Net Income | -4.23B | 613M |
| EPS | -15.23 | 2.53 |
| Fiscal Year | 2025 | 2025 |
Income Statement Analysis: The Bottom-Line Duel
The income statement comparison reveals the true efficiency and profitability of Strategy Inc and Match Group, Inc. as corporate engines in 2025.
Strategy Inc Analysis
Strategy Inc’s revenue slightly increased to $477M in 2025 but net income plunged to a -$4.23B loss, signaling severe bottom-line pressure. Gross margin remains strong at 68.7%, yet net margin collapses to -886%, reflecting heavy expenses and impairments. The 2025 results highlight inefficiency and deteriorating profitability momentum.
Match Group, Inc. Analysis
Match Group, Inc. generated $3.49B revenue in 2025 with net income reaching $613M, sustaining solid profitability. Its gross margin of 72.8% and net margin of 17.6% demonstrate robust margin health. Modest revenue growth contrasts with improving net margin and EPS, indicating steady operational efficiency and positive momentum.
Margin Strength vs. Profitability Collapse
Match Group clearly outperforms Strategy Inc with consistent revenue growth and strong positive margins, while Strategy Inc struggles with mounting losses and margin erosion. For investors, Match Group offers a reliable earnings profile, whereas Strategy Inc’s results reflect high risk and operational distress.
Financial Ratios Comparison
These vital ratios act as a diagnostic tool to expose underlying fiscal health, valuation premiums, and capital efficiency across companies:
| Ratios | Strategy Inc (MSTR) | Match Group, Inc. (MTCH) |
|---|---|---|
| ROE | -6.40% (2024) | -2.42% (2025) |
| ROIC | -4.38% (2024) | 22.50% (2025) |
| P/E | -47.80 (2024) | 12.77 (2025) |
| P/B | 3.06 (2024) | -30.91 (2025) |
| Current Ratio | 0.71 (2024) | 1.42 (2025) |
| Quick Ratio | 0.71 (2024) | 1.42 (2025) |
| D/E | 0.40 (2024) | -15.67 (2025) |
| Debt-to-Assets | 28.09% (2024) | 89.06% (2025) |
| Interest Coverage | -29.92 (2024) | 5.91 (2025) |
| Asset Turnover | 0.018 (2024) | 0.78 (2025) |
| Fixed Asset Turnover | 5.73 (2024) | 26.59 (2025) |
| Payout ratio | 0% (2024) | 30.36% (2025) |
| Dividend yield | 0% (2024) | 2.38% (2025) |
| Fiscal Year | 2024 | 2025 |
Efficiency & Valuation Duel: The Vital Signs
Financial ratios serve as a company’s DNA, unveiling hidden risks and operational excellence that numbers alone cannot fully express.
Strategy Inc
Strategy Inc exhibits deeply negative profitability with ROE at -6.4% and net margin at -251.7%, signaling operational distress. Its P/E ratio is negative but labeled favorable due to earnings losses, while P/S is stretched at 3.06. The lack of dividends suggests reinvestment heavily leans on R&D, which accounts for over 25% of revenue, aiming for future growth despite current inefficiencies.
Match Group, Inc.
Match Group posts a positive net margin of 17.6% and strong ROIC at 22.5%, reflecting efficient capital use. The P/E of 12.8 and a P/B considered favorable indicate a fairly valued stock. Shareholders benefit from a 2.38% dividend yield, complementing solid free cash flow, while the company balances growth with disciplined capital allocation evidenced by moderate R&D spend near 13%.
Profitability Clarity vs. Growth Challenges
Match Group offers a robust profitability and valuation profile with shareholder returns through dividends, presenting a clearer operational strength. Strategy Inc’s negative returns and stretched valuation highlight riskier reinvestment bets. Investors favoring steady income and efficiency may lean toward Match, while those seeking growth potential must weigh Strategy’s pronounced operational challenges.
Which one offers the Superior Shareholder Reward?
I compare Strategy Inc (MSTR) and Match Group, Inc. (MTCH) on shareholder reward through dividends, payout ratios, and buyback intensity. MSTR pays no dividends and reports negative free cash flow (-114.98 per share in 2024), signaling no distribution via dividends or buybacks. MTCH offers a 2.38% dividend yield with a 30% payout ratio, supported by strong free cash flow of $4.22 per share in 2025 and consistent buybacks. MTCH’s healthy operating cash flow ratio (1.07 in 2025) contrasts MSTR’s weak liquidity (current ratio ~0.71). I see MTCH’s dividend and buyback combination as a sustainable model yielding superior total shareholder return. MSTR’s reinvestment strategy lacks free cash flow support, raising sustainability risks. For 2026 investors, MTCH offers a clearer, more attractive total return profile.
Comparative Score Analysis: The Strategic Profile
The radar chart reveals the fundamental DNA and trade-offs of Strategy Inc and Match Group, Inc., highlighting their financial strengths and valuation differences:
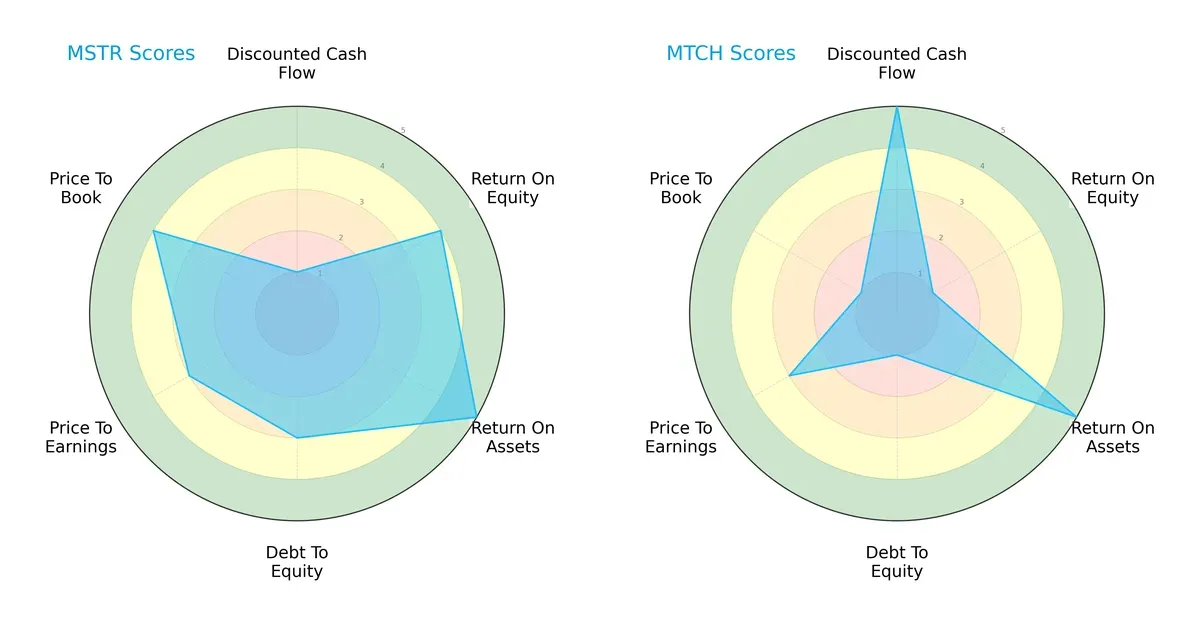
Strategy Inc shows a balanced profile with solid ROE (4) and ROA (5) scores, moderate debt-to-equity (3), and favorable valuation scores. Match Group relies heavily on a strong DCF score (5) and ROA (5), but suffers from weak equity returns and higher leverage risk, seen in low ROE (1) and debt-to-equity (1) scores.
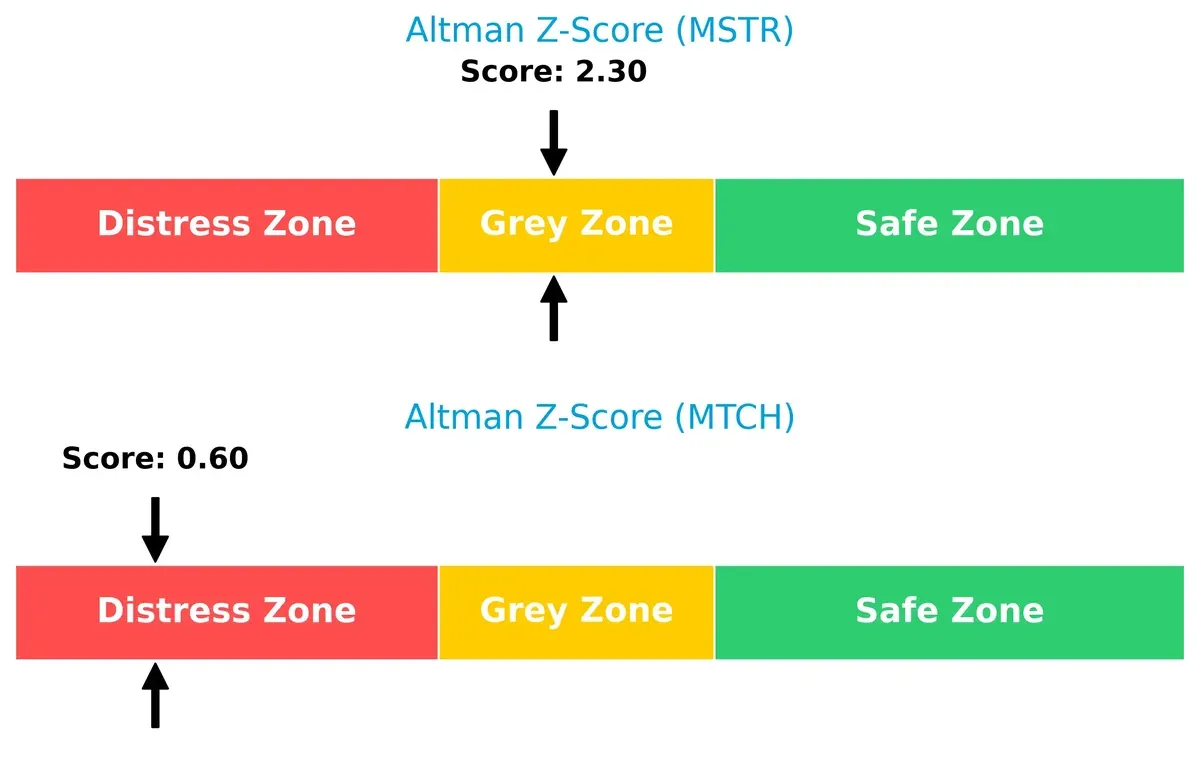
Bankruptcy Risk: Solvency Showdown
Strategy Inc’s Altman Z-Score of 2.3 places it in the grey zone, signaling moderate bankruptcy risk. Match Group’s 0.6 score lands in the distress zone, indicating elevated insolvency risk in this cycle:
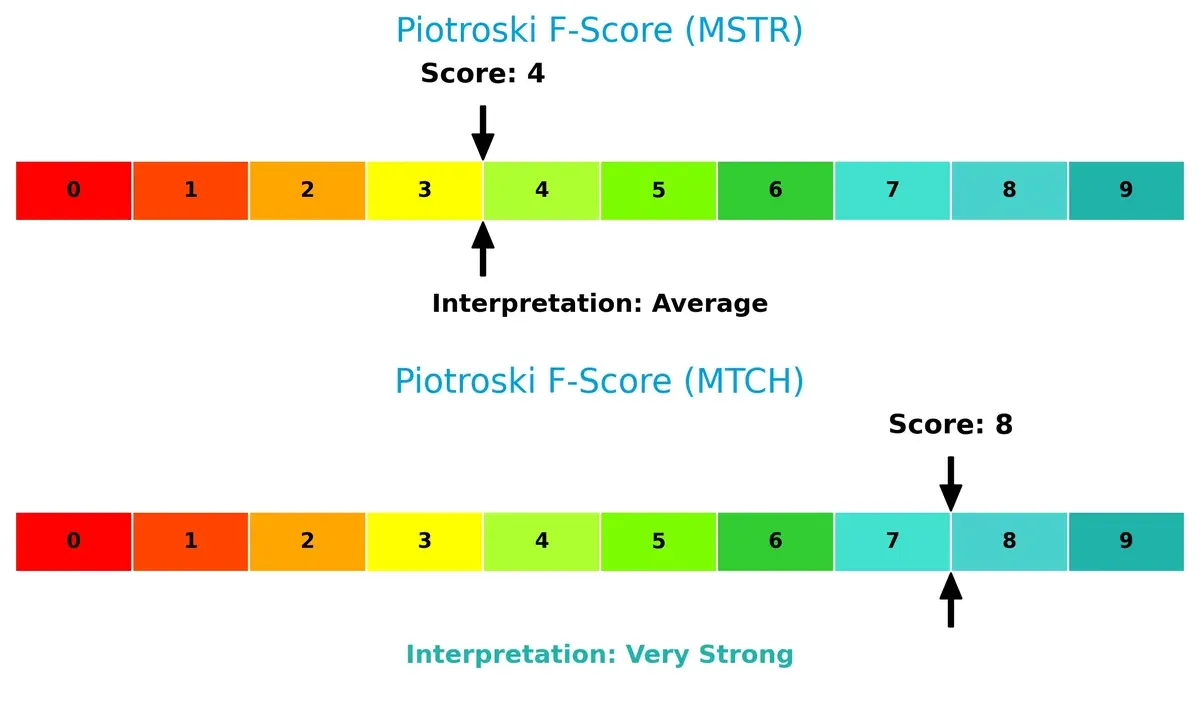
Financial Health: Quality of Operations
Match Group scores an impressive 8 on the Piotroski F-Score, reflecting strong internal financial health. Strategy Inc’s 4 signals average operational quality and potential red flags compared to its peer:
How are the two companies positioned?
This section dissects the operational DNA of Strategy Inc and Match Group by comparing their revenue distribution and internal dynamics. The goal is to confront their economic moats and identify which model offers the most resilient, sustainable competitive advantage today.
Revenue Segmentation: The Strategic Mix
This visual comparison dissects how Strategy Inc and Match Group, Inc. diversify their income streams and where their primary sector bets lie:
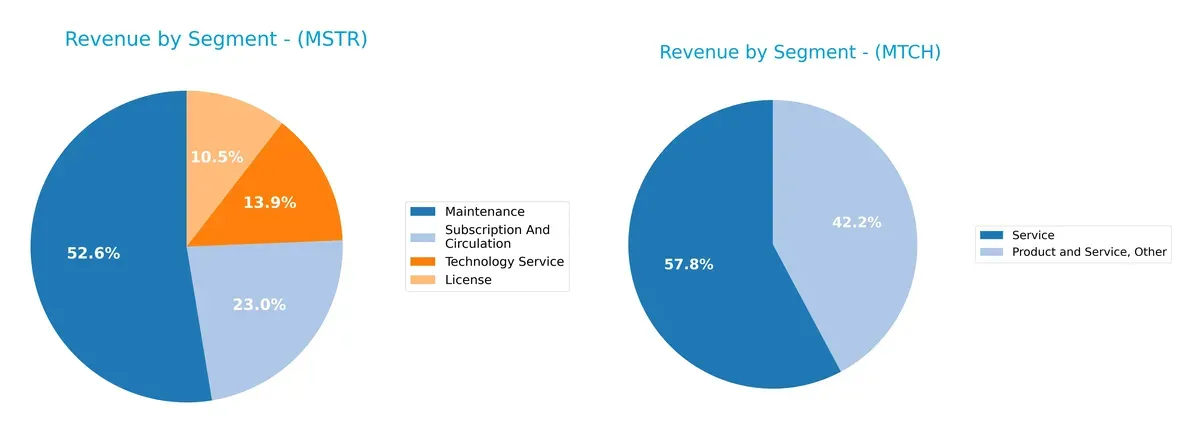
Strategy Inc’s revenue anchors on Maintenance at $244M in 2024, with smaller but steady contributions from Subscription ($107M) and Technology Services ($64M). This mix shows moderate diversification, reducing concentration risk. In contrast, Match Group relies heavily on its core Dating segment, which dwarfs all others historically, signaling strong ecosystem lock-in but heightened exposure to market shifts within online dating. Strategy Inc pivots on infrastructure and recurring fees, while Match Group’s dominance in one segment poses both opportunity and concentration risk.
Strengths and Weaknesses Comparison
This table compares the strengths and weaknesses of Strategy Inc and Match Group, Inc.:
Strategy Inc Strengths
- Diversified revenue streams across License, Maintenance, Subscription, and Technology Service
- Established global presence with significant North America and EMEA sales
- Favorable debt-to-equity and debt-to-assets ratios
- Strong fixed asset turnover ratio
Match Group, Inc. Strengths
- High net margin and ROIC indicate strong profitability
- Favorable WACC and interest coverage ratios support financial stability
- Solid global revenue with large US and Non-US markets
- Favorable PE and PB ratios suggest market confidence
- Generates dividend yield
Strategy Inc Weaknesses
- Negative net margin, ROE, and ROIC reflect profitability challenges
- Low current and quick ratios indicate liquidity concerns
- Negative interest coverage ratio signals financial risk
- High percentage of unfavorable ratios globally
- No dividend yield
Match Group, Inc. Weaknesses
- Negative ROE and very high debt-to-assets ratio raise financial concerns
- Moderate asset turnover ratio limits operational efficiency
- Some ratios neutral, indicating mixed financial health
Overall, Strategy Inc shows diversification and solid asset management but suffers from profitability and liquidity weaknesses. Match Group, Inc. demonstrates strong profitability and financial ratios but carries elevated leverage and some operational risks. These factors shape their strategic priorities.
The Moat Duel: Analyzing Competitive Defensibility
A structural moat is the only shield that protects long-term profits from relentless competition erosion. Let’s dissect how two tech leaders defend their turf:
Strategy Inc: Intangible Assets Powerhouse
Strategy Inc’s moat hinges on proprietary AI analytics and Bitcoin treasury expertise. This intangible asset base shows in its premium gross margins but struggles with volatile net margins. In 2026, expanding AI capabilities could deepen defensibility, yet crypto exposure remains a risk.
Match Group, Inc.: Network Effects Titan
Match Group dominates through massive network effects across dating platforms, driving stable, high ROIC well above WACC. Its diverse brand portfolio fuels margin expansion and global reach. New market features and international growth sustain this moat’s widening gap.
Proprietary AI vs. Network Effects: The Moat Face-Off
Match Group holds a wider and deeper moat, evidenced by strong ROIC growth and margin stability. Strategy Inc’s moat is narrower, vulnerable to market swings and tech disruption. Match Group is better equipped to defend and expand its market share in 2026.
Which stock offers better returns?
The past year reveals notable price declines for both Strategy Inc and Match Group, Inc., with distinct trading volumes and decelerating bearish trends.
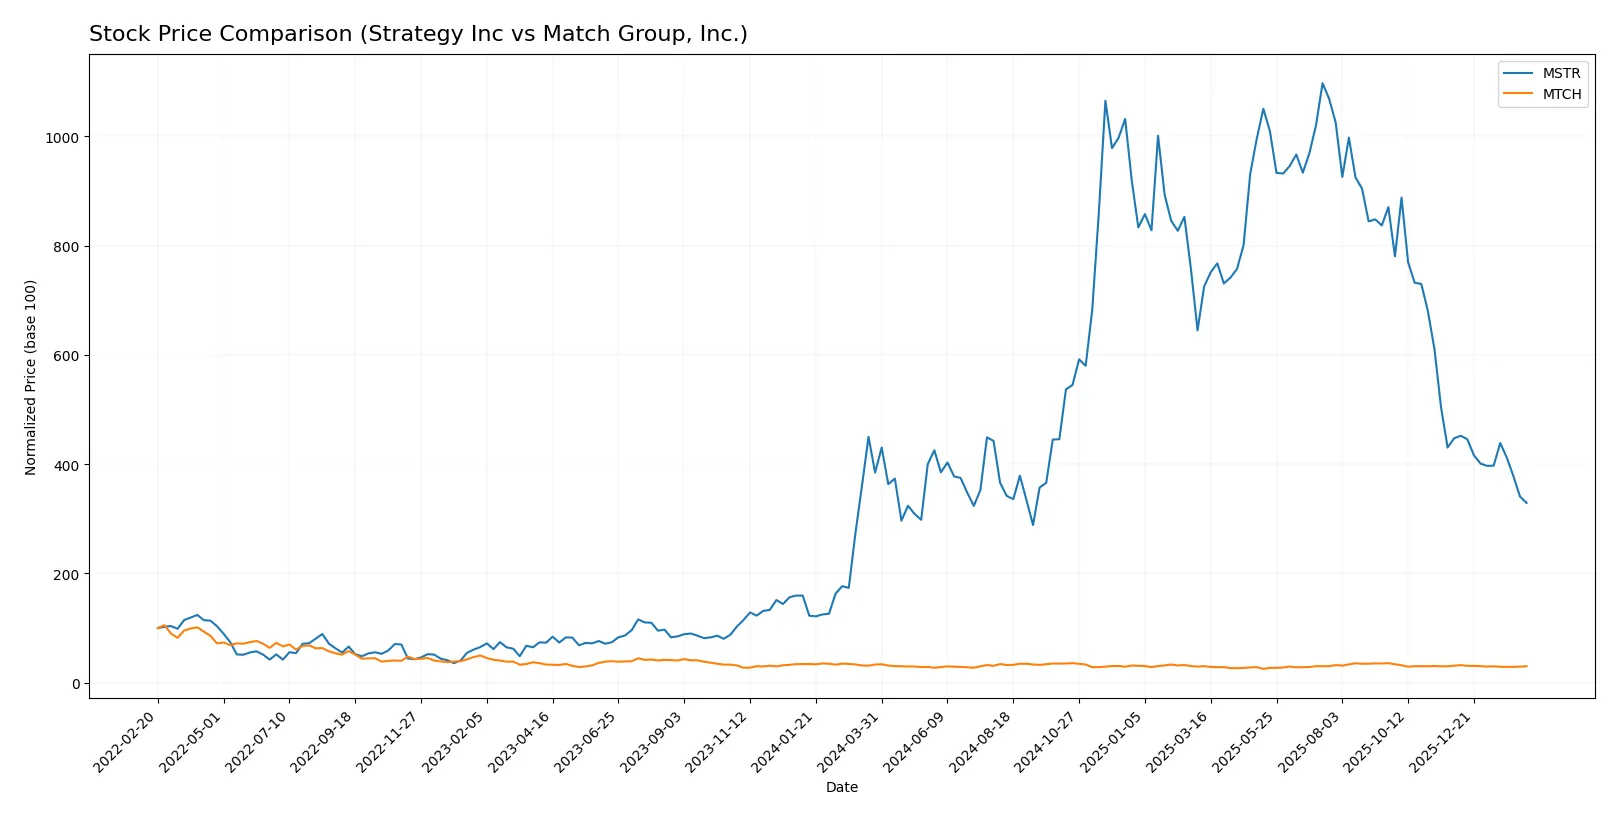
Trend Comparison
Strategy Inc’s stock fell 14.42% over the past year, showing a bearish trend with deceleration and high volatility. The recent period intensified the decline by 26.43%.
Match Group, Inc. experienced a 9.31% price drop over the same period, also bearish with deceleration but far lower volatility. The recent decline was milder at 2.67%.
Strategy Inc’s stock showed a sharper and more volatile decline than Match Group, delivering the weaker market performance overall.
Target Prices
Analysts present a wide but optimistic target consensus for Strategy Inc and Match Group, Inc.
| Company | Target Low | Target High | Consensus |
|---|---|---|---|
| Strategy Inc | 175 | 705 | 374.5 |
| Match Group, Inc. | 33 | 43 | 36 |
Strategy Inc’s target consensus at 374.5 vastly exceeds its current price of 127.62, implying significant upside. Match Group’s consensus target of 36 also suggests moderate appreciation from its 32.43 price.

Don’t Let Luck Decide Your Entry Point
Optimize your entry points with our advanced ProRealTime indicators. You’ll get efficient buy signals with precise price targets for maximum performance. Start outperforming now!
How do institutions grade them?
The following tables summarize the latest institutional grades for Strategy Inc and Match Group, Inc.:
Strategy Inc Grades
This table shows recent grades assigned by major firms to Strategy Inc shares.
| Grading Company | Action | New Grade | Date |
|---|---|---|---|
| BTIG | Maintain | Buy | 2026-02-06 |
| Canaccord Genuity | Maintain | Buy | 2026-02-04 |
| Mizuho | Maintain | Outperform | 2026-01-16 |
| TD Cowen | Maintain | Buy | 2026-01-15 |
| Citigroup | Maintain | Buy | 2025-12-22 |
| Bernstein | Maintain | Outperform | 2025-12-08 |
| Monness, Crespi, Hardt | Upgrade | Neutral | 2025-11-10 |
| Canaccord Genuity | Maintain | Buy | 2025-11-03 |
| HC Wainwright & Co. | Maintain | Buy | 2025-11-03 |
| TD Cowen | Maintain | Buy | 2025-10-31 |
Match Group, Inc. Grades
This table presents recent institutional grades for Match Group, Inc. shares.
| Grading Company | Action | New Grade | Date |
|---|---|---|---|
| TD Cowen | Maintain | Buy | 2026-02-05 |
| JP Morgan | Maintain | Neutral | 2026-02-04 |
| Truist Securities | Maintain | Hold | 2026-02-04 |
| Morgan Stanley | Maintain | Equal Weight | 2026-01-13 |
| Truist Securities | Maintain | Hold | 2025-11-05 |
| Evercore ISI Group | Maintain | In Line | 2025-11-05 |
| Wells Fargo | Maintain | Equal Weight | 2025-11-05 |
| Morgan Stanley | Maintain | Equal Weight | 2025-10-20 |
| Susquehanna | Maintain | Positive | 2025-08-07 |
| JP Morgan | Maintain | Neutral | 2025-08-06 |
Which company has the best grades?
Strategy Inc consistently earns buy and outperform ratings from top firms, indicating strong institutional confidence. Match Group, Inc. carries more neutral and hold grades, reflecting cautious sentiment. Investors may interpret Strategy Inc’s grades as a stronger endorsement.
Risks specific to each company
The following categories identify the critical pressure points and systemic threats facing both firms in the 2026 market environment:
1. Market & Competition
Strategy Inc
- Faces intense competition in bitcoin treasury and AI analytics sectors, with volatile crypto market dynamics.
Match Group, Inc.
- Operates in a crowded dating app market, competing against numerous global and niche platforms.
2. Capital Structure & Debt
Strategy Inc
- Maintains moderate debt-to-equity ratio (0.4), favorable leverage but weak interest coverage signals risk.
Match Group, Inc.
- Shows high debt-to-assets (89%) and unfavorable debt-to-equity score, increasing financial vulnerability.
3. Stock Volatility
Strategy Inc
- Exhibits very high beta (3.535), indicating significant stock price swings and investor uncertainty.
Match Group, Inc.
- Displays moderate beta (1.315), suggesting relatively lower stock volatility and market risk.
4. Regulatory & Legal
Strategy Inc
- Subject to evolving cryptocurrency regulations globally, posing compliance and operational risks.
Match Group, Inc.
- Faces privacy and data protection scrutiny in multiple jurisdictions, with ongoing class-action risks.
5. Supply Chain & Operations
Strategy Inc
- Relies on stable AI data infrastructure; any disruption could impact analytics delivery and client trust.
Match Group, Inc.
- Depends on digital infrastructure and platform uptime; cyberattacks or outages could severely affect user engagement.
6. ESG & Climate Transition
Strategy Inc
- Bitcoin exposure attracts ESG criticism due to energy consumption concerns, affecting investor sentiment.
Match Group, Inc.
- Increasing focus on social governance and data ethics, with pressure to enhance transparency and user safety.
7. Geopolitical Exposure
Strategy Inc
- Operates internationally with crypto assets, vulnerable to geopolitical shifts affecting digital currencies.
Match Group, Inc.
- Global user base exposes it to geopolitical tensions, especially in data regulation and censorship regimes.
Which company shows a better risk-adjusted profile?
Strategy Inc’s highest risk is extreme stock volatility compounded by negative profitability metrics. Match Group faces critical capital structure risks with high leverage and legal exposures. Despite this, Match Group’s stronger profitability and operational scores give it a better risk-adjusted profile. Notably, Strategy Inc’s beta above 3.5 signals outsized market swings, a red flag for cautious investors in 2026.
Final Verdict: Which stock to choose?
Strategy Inc’s superpower lies in its deep asset specialization and fixed asset efficiency. However, its persistent negative returns and weak liquidity ratios present clear risks. It fits a portfolio with a high tolerance for volatility and a focus on turnaround potential.
Match Group, Inc. boasts a robust economic moat fueled by strong recurring revenue and efficient capital deployment. It offers better cash flow stability and operational resilience than Strategy Inc. This stock suits investors seeking growth tempered by reasonable safety.
If you prioritize aggressive value creation amid uncertainty, Strategy Inc could appeal due to its fixed asset leverage. However, if you seek a more stable growth profile with a proven moat, Match Group outshines as the superior choice given its sustainable returns and healthier financial footing.
Disclaimer: Investment carries a risk of loss of initial capital. The past performance is not a reliable indicator of future results. Be sure to understand risks before making an investment decision.
Go Further
I encourage you to read the complete analyses of Strategy Inc and Match Group, Inc. to enhance your investment decisions: