In the dynamic world of technology, Snowflake Inc. and Match Group, Inc. stand out as influential players, each reshaping their respective markets through innovation. Snowflake leads in cloud-based data platforms, enabling businesses to harness data insights, while Match Group dominates the online dating industry with a diverse brand portfolio. This article will explore their growth strategies and market positions to help you decide which company offers the most compelling investment opportunity.

Table of contents
Companies Overview
I will begin the comparison between Snowflake Inc. and Match Group, Inc. by providing an overview of these two companies and their main differences.
Snowflake Inc. Overview
Snowflake Inc. operates a cloud-based data platform designed to consolidate data into a single source of truth, enabling customers to generate insights, build applications, and share data. Positioned in the software application industry, Snowflake serves a diverse range of industries and sizes globally. Founded in 2012 and based in Bozeman, Montana, it is led by CEO Sridhar Ramaswamy and trades on the NYSE with a market cap of approximately 70B USD.
Match Group, Inc. Overview
Match Group, Inc. provides online dating products worldwide through a portfolio of brands including Tinder, Match, and OkCupid. Established in 1986 and headquartered in Dallas, Texas, the company focuses on software applications for social connections and dating services. Under CEO Spencer Rascoff, Match Group is listed on NASDAQ, with a market cap near 7.4B USD and a workforce of about 2,500 employees.
Key similarities and differences
Both Snowflake and Match Group operate in the technology sector within the software application industry, serving global markets. However, Snowflake focuses on cloud-based data management solutions for businesses, while Match Group specializes in consumer-facing dating services. Snowflake’s market cap is significantly larger, reflecting its enterprise-oriented model, whereas Match Group’s revenue comes from a portfolio of social and dating platforms targeting individual consumers.
Income Statement Comparison
The table below presents a side-by-side comparison of key income statement metrics for Snowflake Inc. and Match Group, Inc. for their most recent fiscal years.
| Metric | Snowflake Inc. (SNOW) | Match Group, Inc. (MTCH) |
|---|---|---|
| Market Cap | 70.4B | 7.4B |
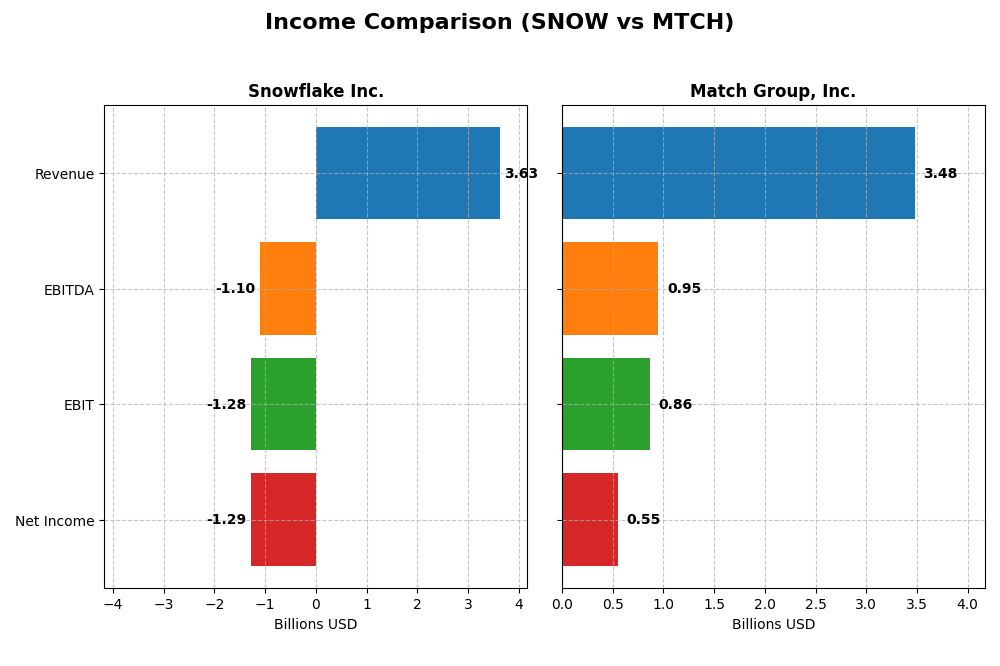
| Revenue | 3.63B | 3.48B |
| EBITDA | -1.10B | 952M |
| EBIT | -1.28B | 864M |
| Net Income | -1.29B | 564M |
| EPS | -3.86 | 2.02 |
| Fiscal Year | 2025 | 2024 |
Income Statement Interpretations
Snowflake Inc.
Snowflake Inc. has shown strong revenue growth from 2021 to 2025, increasing over 500% to $3.63B in 2025. Despite this, the company remains unprofitable with a net loss of $1.29B in 2025 and negative net margins around -35%. Gross margins are favorable at 66.5%, but EBIT and net margins deteriorated recently, reflecting increased operating expenses and slower profitability improvement.
Match Group, Inc.
Match Group’s revenues grew steadily by 45.5% over the 2020-2024 period, reaching $3.48B in 2024. The company maintained solid profitability with a positive net income of $551M and net margins of 15.8% in 2024. Margins remain strong, supported by a 71.5% gross margin and favorable EBIT margin near 25%, although recent growth rates and margin improvements have somewhat slowed.
Which one has the stronger fundamentals?
Match Group exhibits stronger fundamentals with consistent profitability, positive net income growth, and solid margin improvements over the period. Snowflake, while growing revenue rapidly, still faces substantial losses and negative margins, indicating challenges in operational efficiency and profitability. Match’s favorable margin profile and earnings growth contrast with Snowflake’s ongoing net losses and margin pressures.
Financial Ratios Comparison
The table below presents the latest key financial ratios for Snowflake Inc. and Match Group, Inc., allowing for a direct comparison of their financial performance and stability as of their most recent fiscal years.
| Ratios | Snowflake Inc. (2025) | Match Group, Inc. (2024) |
|---|---|---|
| ROE | -42.9% | -865.9% |
| ROIC | -25.2% | 16.4% |
| P/E | -47.0 | 15.4 |
| P/B | 20.1 | -133.7 |
| Current Ratio | 1.75 | 2.54 |
| Quick Ratio | 1.75 | 2.54 |
| D/E (Debt-to-Equity) | 0.90 | -62.1 |
| Debt-to-Assets | 29.7% | 88.5% |
| Interest Coverage | -527.7 | 5.14 |
| Asset Turnover | 0.40 | 0.78 |
| Fixed Asset Turnover | 5.53 | 22.0 |
| Payout Ratio | 0 | 0 |
| Dividend Yield | 0% | 0% |
Interpretation of the Ratios
Snowflake Inc.
Snowflake shows a mix of strengths and weaknesses in its ratios. Favorable liquidity ratios (current and quick ratios at 1.75) contrast with unfavorable profitability indicators, including a negative net margin of -35.45% and return on equity at -42.86%. Asset turnover is also low at 0.4, but fixed asset turnover is strong at 5.53. Snowflake does not pay dividends, reflecting its high investment in R&D and growth strategy.
Match Group, Inc.
Match Group’s ratios indicate predominantly favorable financial health with a net margin of 15.84% and a strong return on invested capital of 16.38%. Liquidity ratios are robust, with current and quick ratios at 2.54. However, the company faces an unfavorable debt to assets ratio at 88.51%. Match Group pays a dividend with a payout ratio supporting shareholder returns but has a zero dividend yield, suggesting limited income generation from dividends.
Which one has the best ratios?
Match Group presents a more favorable overall ratio profile, with 64.29% favorable ratios compared to Snowflake’s 35.71%. Despite some concerns over debt levels, Match Group’s profitability and liquidity metrics are stronger. Snowflake’s ratios reflect challenges in profitability and efficiency, offset partially by solid liquidity and growth investment, resulting in a slightly unfavorable rating.
Strategic Positioning
This section compares the strategic positioning of Snowflake Inc. and Match Group, Inc., focusing on market position, key segments, and exposure to technological disruption:
Snowflake Inc.
- Leading cloud-based data platform with strong competitive pressure in software applications.
- Key segment is cloud data platform products, driving majority of revenue, supported by professional services.
- Positioned in technology sector with cloud innovation focus; no explicit disruption risk detailed.
Match Group, Inc.
- Dominant dating products provider with diverse brand portfolio and competitive pressure in tech sector.
- Core business centers on dating services, including Tinder and Match, generating primary revenue streams.
- Operates in software applications with possible tech disruption but no explicit exposure mentioned.
Snowflake Inc. vs Match Group, Inc. Positioning
Snowflake displays a concentrated focus on cloud data platforms with high revenue growth, while Match Group maintains a diversified portfolio of dating brands. Snowflake’s positioning aligns with enterprise data needs; Match Group leverages consumer social trends.
Which has the best competitive advantage?
Match Group shows a slightly favorable moat with value creation despite declining profitability, whereas Snowflake has a very unfavorable moat, destroying value with declining returns on invested capital. Match Group holds the superior competitive advantage based on MOAT evaluation.
Stock Comparison
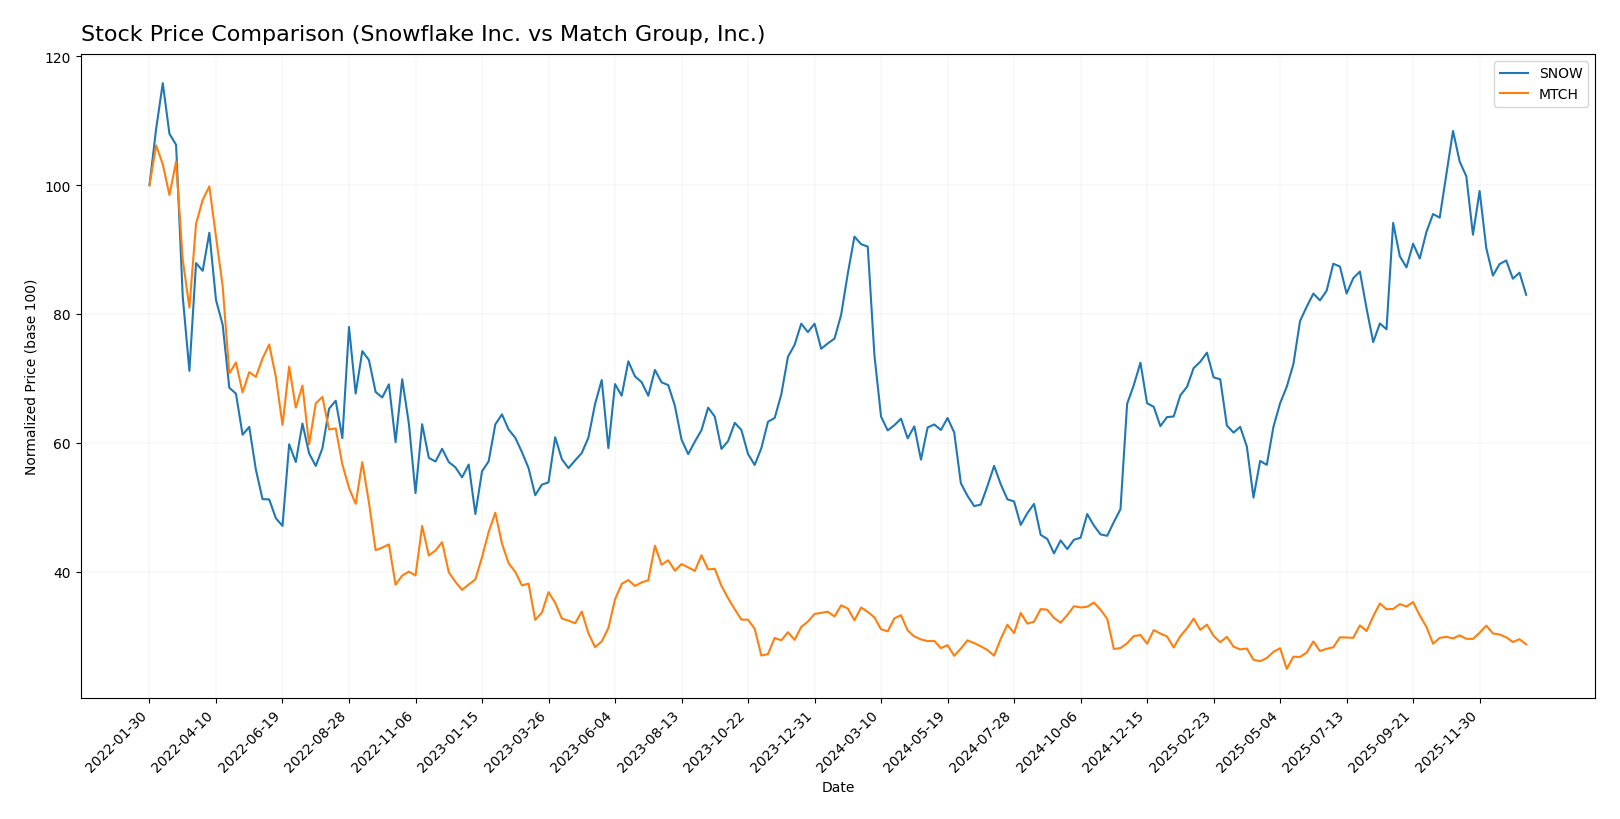
The past year saw both Snowflake Inc. and Match Group, Inc. stocks experiencing notable declines, with Snowflake showing higher volatility and larger price swings compared to Match Group’s more stable but still negative performance.
Trend Analysis
Snowflake Inc. (SNOW) experienced a bearish trend over the past 12 months with an 8.27% price decrease and decelerating losses. The stock showed high volatility, with a standard deviation of 42.6, peaking at 274.88 and bottoming at 108.56.
Match Group, Inc. (MTCH) also faced a bearish trend, declining 14.98% over the year. It exhibited lower volatility with a standard deviation of 2.64, hitting a high of 38.51 and a low of 27.18, with deceleration in its downward movement.
Comparing both stocks, Snowflake’s decline was less severe than Match Group’s, making SNOW the better performer in market terms despite higher volatility and recent sharper drops.
Target Prices
Analysts present a cautiously optimistic consensus on target prices for Snowflake Inc. and Match Group, Inc.
| Company | Target High | Target Low | Consensus |
|---|---|---|---|
| Snowflake Inc. | 325 | 237 | 281.86 |
| Match Group, Inc. | 43 | 33 | 36.29 |
Snowflake’s consensus target price of $281.86 is about 34% above its current $210.38, indicating significant upside potential. Match Group’s target consensus at $36.29 also suggests moderate upside from its current $31.34 price.
Analyst Opinions Comparison
This section compares analysts’ ratings and grades for Snowflake Inc. and Match Group, Inc.:
Rating Comparison
Snowflake Inc. Rating
- Rating: C-, indicating a very favorable evaluation overall.
- Discounted Cash Flow Score: Moderate at 3, suggesting neutral DCF prospects.
- Return on Equity Score: Very unfavorable at 1, reflecting low efficiency in profit generation.
- Return on Assets Score: Very unfavorable at 1, signaling poor asset utilization.
- Debt To Equity Score: Very unfavorable at 1, implying high financial risk.
- Overall Score: Very unfavorable at 1, reflecting generally weak financial health.
Match Group, Inc. Rating
- Rating: B, showing a very favorable overall evaluation.
- Discounted Cash Flow Score: Very favorable at 5, indicating strong cash flow outlook.
- Return on Equity Score: Very unfavorable at 1, showing similar inefficiency in equity use.
- Return on Assets Score: Very favorable at 5, indicating excellent asset efficiency.
- Debt To Equity Score: Very unfavorable at 1, also implying elevated financial risk.
- Overall Score: Moderate at 3, showing a comparatively stronger financial position.
Which one is the best rated?
Based strictly on the provided data, Match Group, Inc. is better rated overall with a B rating and a moderate overall score of 3, outperforming Snowflake Inc.’s C- rating and very unfavorable overall score of 1.
Scores Comparison
Here is a comparison of the Altman Z-Score and Piotroski Score for Snowflake Inc. and Match Group, Inc.:
Snowflake Inc. Scores
- Altman Z-Score: 5.36, indicating a safe zone with low bankruptcy risk.
- Piotroski Score: 4, reflecting average financial strength.
Match Group Scores
- Altman Z-Score: 0.52, indicating distress zone with high bankruptcy risk.
- Piotroski Score: 8, reflecting very strong financial strength.
Which company has the best scores?
Snowflake shows a strong Altman Z-Score, suggesting financial safety, while Match Group excels in Piotroski Score, indicating robust financial health. Each company leads in one score, reflecting different strengths.
Grades Comparison
Here is a comparison of the recent grades assigned to Snowflake Inc. and Match Group, Inc.:
Snowflake Inc. Grades
This table summarizes recent grades from verified grading companies for Snowflake Inc.:
| Grading Company | Action | New Grade | Date |
|---|---|---|---|
| Barclays | Downgrade | Equal Weight | 2026-01-12 |
| Argus Research | Upgrade | Buy | 2026-01-08 |
| Citigroup | Maintain | Buy | 2025-12-08 |
| Wells Fargo | Maintain | Overweight | 2025-12-04 |
| Keybanc | Maintain | Overweight | 2025-12-04 |
| Piper Sandler | Maintain | Overweight | 2025-12-04 |
| Morgan Stanley | Maintain | Overweight | 2025-12-04 |
| Wedbush | Maintain | Outperform | 2025-12-04 |
| Deutsche Bank | Maintain | Buy | 2025-12-04 |
| Cantor Fitzgerald | Maintain | Overweight | 2025-12-04 |
Overall, Snowflake’s grades mostly remain positive with strong buy and overweight ratings, despite a recent downgrade by Barclays.
Match Group, Inc. Grades
This table summarizes recent grades from verified grading companies for Match Group, Inc.:
| Grading Company | Action | New Grade | Date |
|---|---|---|---|
| Morgan Stanley | Maintain | Equal Weight | 2026-01-13 |
| Truist Securities | Maintain | Hold | 2025-11-05 |
| Evercore ISI Group | Maintain | In Line | 2025-11-05 |
| Wells Fargo | Maintain | Equal Weight | 2025-11-05 |
| Morgan Stanley | Maintain | Equal Weight | 2025-10-20 |
| Susquehanna | Maintain | Positive | 2025-08-07 |
| Evercore ISI Group | Maintain | In Line | 2025-08-06 |
| JP Morgan | Maintain | Neutral | 2025-08-06 |
| UBS | Maintain | Neutral | 2025-07-23 |
| Wells Fargo | Maintain | Equal Weight | 2025-06-27 |
Match Group’s grades are generally stable with equal weight or neutral ratings and no recent upgrades or downgrades.
Which company has the best grades?
Snowflake Inc. has received stronger and more positive grades overall, including multiple buy and overweight ratings, compared to Match Group’s more cautious equal weight and neutral assessments. This divergence may influence investor perceptions of growth potential and risk.
Strengths and Weaknesses
The following table compares key strengths and weaknesses of Snowflake Inc. and Match Group, Inc. based on recent financial and strategic data:
| Criterion | Snowflake Inc. (SNOW) | Match Group, Inc. (MTCH) |
|---|---|---|
| Diversification | Moderate product diversification with growing product revenue (3.46B in 2025) but limited service scope | Diversified services focused on dating and related segments; solid revenue base (~2.3B combined in recent years) |
| Profitability | Negative net margin (-35.45%), declining ROIC, value destroying (-34.26% ROIC vs WACC) | Positive net margin (15.84%), favorable ROIC (16.38%), value creating with some ROIC decline |
| Innovation | Strong technology-driven cloud data platform, but profitability challenges raise concerns | Innovative in digital dating platforms, maintaining competitive edge despite profitability fluctuations |
| Global presence | Growing global footprint typical for cloud services, but still scaling internationally | Established global user base in dating markets, strong international presence |
| Market Share | Rapid growth in cloud analytics but highly competitive market with pressure on margins | Leading position in online dating sector, steady market share retention |
In summary, Snowflake shows impressive growth and innovation in cloud data but struggles with profitability and value creation, indicating higher risk. Match Group maintains profitability and a strong market position despite some decline in returns, offering a more stable investment profile. Investors should weigh growth potential against financial health carefully.
Risk Analysis
The table below summarizes key risks for Snowflake Inc. (SNOW) and Match Group, Inc. (MTCH) based on their latest available financial and operational data for 2025 and 2024 respectively:
| Metric | Snowflake Inc. (SNOW) | Match Group, Inc. (MTCH) |
|---|---|---|
| Market Risk | Beta 1.144, moderate volatility | Beta 1.334, higher volatility |
| Debt level | Debt-to-Equity 0.9 (neutral) | Debt-to-Equity -62.09 (favorable but unusual negative value) |
| Regulatory Risk | Medium – tech sector compliance | Medium – global data privacy laws |
| Operational Risk | High – negative margins and ROE | Moderate – positive margins, some ROE concerns |
| Environmental Risk | Low – software sector | Low – primarily digital services |
| Geopolitical Risk | Moderate – US-based with global clients | Moderate – US-based with global reach |
Snowflake faces significant operational risk due to sustained negative profitability and unfavorable return metrics despite a strong balance sheet and safe Altman Z-Score. Match Group’s biggest risk is financial distress indicated by a low Altman Z-Score, despite strong cash flow and operational efficiency. Market volatility is higher for Match given its beta. Investors should weigh Snowflake’s growth potential against profitability challenges, while Match requires caution due to potential financial instability.
Which Stock to Choose?
Snowflake Inc. (SNOW) has shown strong revenue growth of 29.2% in the last year and 512.5% over five years, but profitability remains negative with a net margin of -35.45%. Its financial ratios reveal mixed signals, with favorable liquidity but unfavorable returns and valuation metrics. The company carries moderate debt and holds a very favorable rating despite value destruction indicated by its declining ROIC.
Match Group, Inc. (MTCH) presents steady income growth with a 3.4% increase last year and positive net margin of 15.84%. Its financial ratios are largely favorable, showing efficient asset use and solid liquidity, though with high debt-to-assets and an unfavorable return on equity. The rating is very favorable overall, supported by value creation despite a downward ROIC trend.
For investors seeking growth potential, Snowflake’s strong revenue expansion combined with its very favorable rating might appear attractive, though its profitability challenges and value destruction could signal higher risk. Conversely, Match Group may appeal to those prioritizing current profitability and financial stability, given its favorable ratios and value creation, despite a moderate rating and high leverage. Thus, the more favorable stock depends on the investor’s risk tolerance and strategic focus.
Disclaimer: Investment carries a risk of loss of initial capital. The past performance is not a reliable indicator of future results. Be sure to understand risks before making an investment decision.
Go Further
I encourage you to read the complete analyses of Snowflake Inc. and Match Group, Inc. to enhance your investment decisions: