Home > Comparison > Technology > SHOP vs MTCH
The strategic rivalry between Shopify Inc. and Match Group, Inc. shapes the evolving landscape of the technology sector. Shopify operates as a capital-intensive commerce platform enabling global merchants to sell across diverse channels. In contrast, Match Group focuses on high-margin dating services with a portfolio of leading brands. This analysis aims to identify which company’s business model offers superior risk-adjusted returns for diversified portfolios amid sector shifts.
Table of contents
Companies Overview
Shopify and Match Group dominate distinct niches within the software application market, influencing e-commerce and digital dating trends globally.
Shopify Inc.: Commerce Platform Innovator
Shopify Inc. leads as a commerce platform provider enabling merchants worldwide to manage sales across web, mobile, and physical channels. Its core revenue engine derives from subscription solutions and merchant services including payments, shipping, and financing. In 2026, Shopify focuses strategically on expanding multi-channel integration and enhancing merchant analytics to deepen customer engagement.
Match Group, Inc.: Global Dating Powerhouse
Match Group, Inc. operates as a leading dating products provider with a diverse brand portfolio including Tinder and Hinge. It generates revenue primarily through subscription fees and advertising across its platforms. In 2026, Match Group emphasizes user experience improvements and international market expansion to maintain dominance in the competitive digital dating space.
Strategic Collision: Similarities & Divergences
Both companies deploy software applications but differ radically in business philosophy: Shopify fosters an open commerce ecosystem, while Match Group builds closed, brand-specific communities. Their primary battleground is user engagement—Shopify targets merchants and buyers, Match Group targets daters. These distinctions create unique investment profiles: Shopify offers broad e-commerce exposure, whereas Match Group focuses on niche social interaction monetization.
Income Statement Comparison
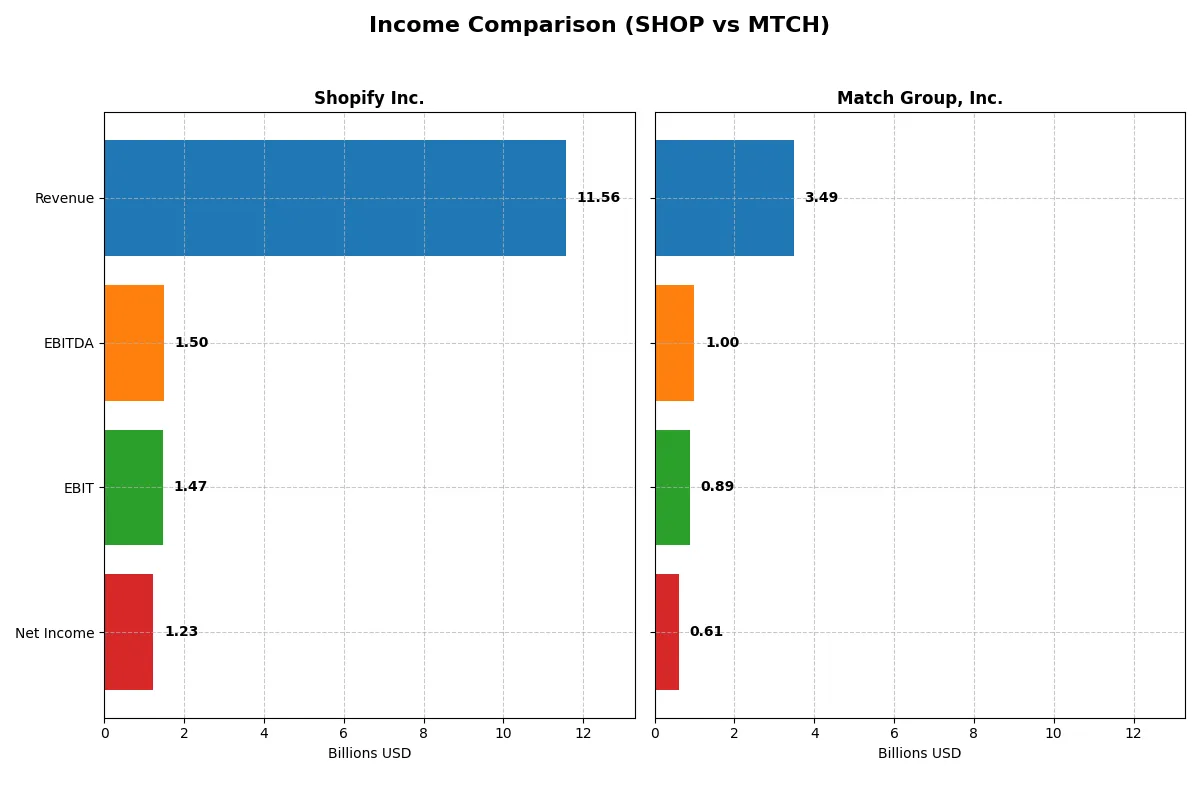
This data dissects the core profitability and scalability of both corporate engines to reveal who dominates the bottom line:
| Metric | Shopify Inc. (SHOP) | Match Group, Inc. (MTCH) |
|---|---|---|
| Revenue | 11.6B | 3.5B |
| Cost of Revenue | 6.0B | 948M |
| Operating Expenses | 4.1B | 1.7B |
| Gross Profit | 5.6B | 2.5B |
| EBITDA | 1.5B | 999M |
| EBIT | 1.5B | 894M |
| Interest Expense | 0 | 148M |
| Net Income | 1.2B | 613M |
| EPS | 0.95 | 2.53 |
| Fiscal Year | 2025 | 2025 |
Income Statement Analysis: The Bottom-Line Duel
This income statement comparison exposes the true efficiency and profitability of Shopify Inc. and Match Group, Inc. through their latest financial results.
Shopify Inc. Analysis
Shopify’s revenue surged 30% to 11.6B in 2025, yet net income fell sharply by 39% to 1.23B. The company maintains a solid gross margin of 48%, reflecting decent cost control. However, net margin compressed to 10.65%, signaling profitability pressure despite revenue growth. Momentum slowed as net income and EPS declined despite operational improvements.
Match Group, Inc. Analysis
Match Group’s revenue remained flat near 3.5B in 2025, but net income rose 11% to 613M, with net margin expanding to 17.6%. The firm sustains a robust gross margin of 72.8%, illustrating strong pricing power and efficiency. EPS growth of 18% underscores steady bottom-line momentum. Match’s income statement reveals consistent profitability gains amid mature revenue growth.
Margin Strength vs. Revenue Expansion
Match Group leads in profitability with higher margins and consistent net income growth, while Shopify impresses with rapid revenue expansion but weaker net income momentum. Match’s profile suits investors favoring steady profits and margin resilience. Shopify appeals more to those prioritizing aggressive top-line growth despite margin volatility.
Financial Ratios Comparison
These vital ratios act as a diagnostic tool to expose the underlying fiscal health, valuation premiums, and capital efficiency of the companies compared:
| Ratios | Shopify Inc. (SHOP) | Match Group, Inc. (MTCH) |
|---|---|---|
| ROE | 9.1% | -241.9% |
| ROIC | 15.7% | 18.5% |
| P/E | 170 | 12.8 |
| P/B | 15.5 | -30.9 |
| Current Ratio | 12.9 | 1.42 |
| Quick Ratio | 12.9 | 1.42 |
| D/E | 0.014 | -15.7 |
| Debt-to-Assets | 1.24% | 89.1% |
| Interest Coverage | 0 | 5.91 |
| Asset Turnover | 0.76 | 0.78 |
| Fixed Asset Turnover | 82 | 26.6 |
| Payout Ratio | 0% | 30.4% |
| Dividend Yield | 0% | 2.38% |
| Fiscal Year | 2025 | 2025 |
Efficiency & Valuation Duel: The Vital Signs
Financial ratios act as a company’s DNA, revealing hidden risks and operational strengths that shape investment decisions.
Shopify Inc.
Shopify displays moderate profitability with a 9.14% ROE and a 10.65% net margin. Its valuation is stretched, with a P/E at 170 and P/B at 15.5, signaling high market expectations. The firm pays no dividends, instead channeling resources into R&D, supporting growth but increasing capital intensity.
Match Group, Inc.
Match Group shows higher profitability, with a 17.59% net margin and efficient capital returns at 18.5% ROIC. Its valuation is attractive, featuring a P/E of 12.8 and a favorable P/B ratio. The company returns cash to shareholders via a 2.38% dividend yield, balancing income with ongoing operations.
Premium Valuation vs. Operational Safety
Match Group offers a better balance of valuation and profitability, with stronger cash returns and more favorable capital metrics. Shopify’s premium multiples reflect growth ambitions but introduce elevated risk. Income-focused investors may prefer Match’s steady dividends, while growth seekers might tolerate Shopify’s stretched profile.
Which one offers the Superior Shareholder Reward?
I see Shopify (SHOP) adopts a zero-dividend policy, reinvesting nearly all free cash flow (1.54/share in 2025) into growth and innovation. Buybacks are minimal or absent, reflecting a growth-first strategy. Match Group (MTCH) pays a 2.38% dividend yield with a 30% payout ratio, balancing income with steady buybacks, boosting total shareholder return. MTCH’s free cash flow of 4.22/share supports both distributions sustainably, while SHOP’s high valuation multiples (P/E ~170) imply greater growth expectations but less immediate reward. I judge Match Group’s balanced dividend and buyback approach offers a more attractive and sustainable total return profile for 2026 investors focused on shareholder reward.
Comparative Score Analysis: The Strategic Profile
The radar chart reveals the fundamental DNA and trade-offs of Shopify Inc. and Match Group, Inc., highlighting their financial strengths and valuation challenges:
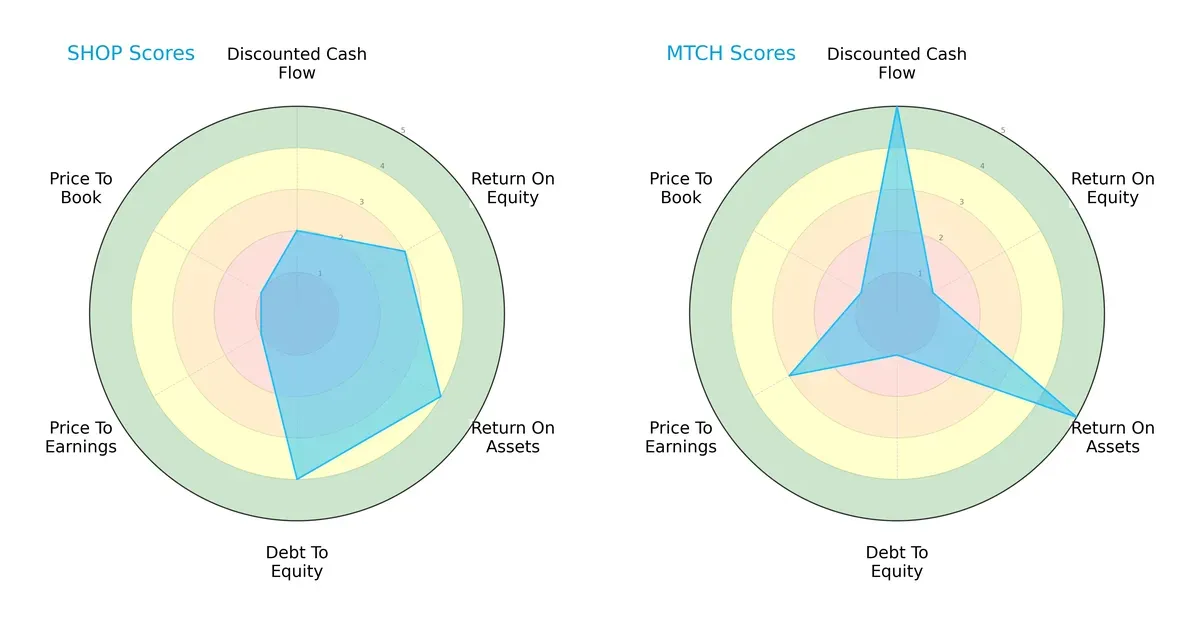
Shopify shows strength in asset utilization and conservative debt levels but suffers from poor valuation scores (P/E and P/B both very unfavorable). Match Group excels in discounted cash flow and asset returns but carries higher financial risk with weak debt-to-equity metrics. Shopify presents a balanced risk profile, while Match relies heavily on operational efficiency and growth potential.
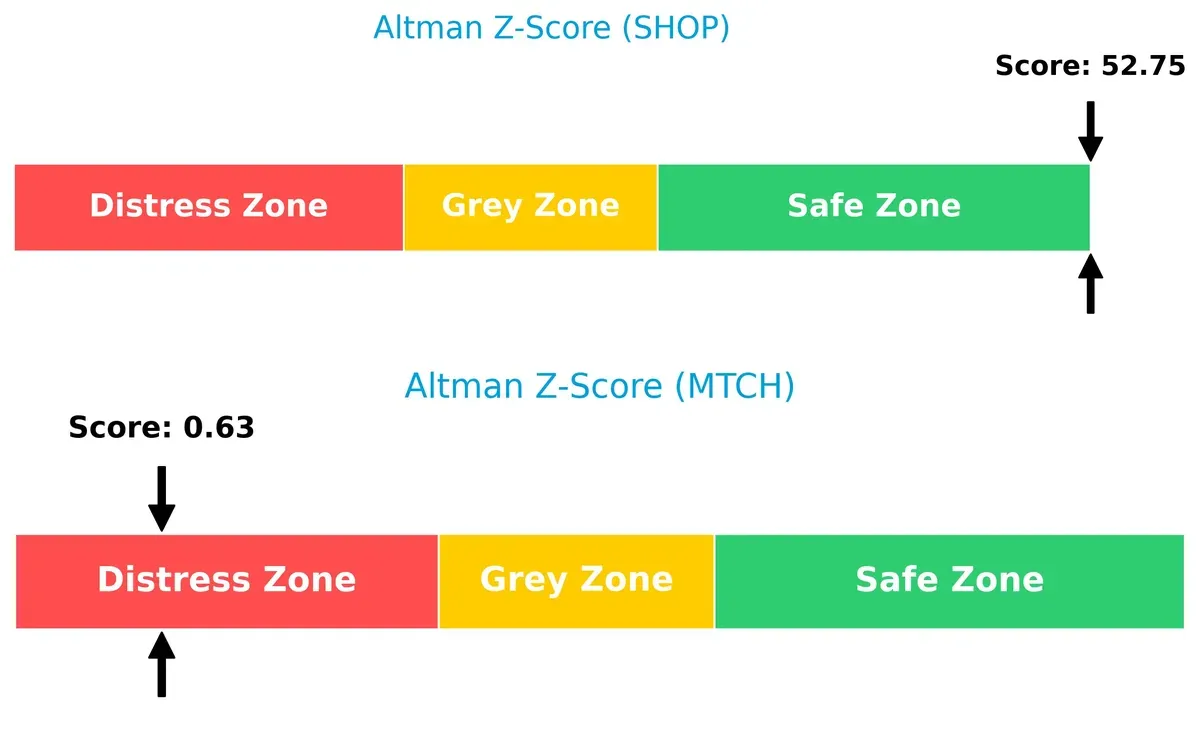
Bankruptcy Risk: Solvency Showdown
Shopify’s Altman Z-Score of 52.75 signals robust financial health, dwarfing Match Group’s distress zone score of 0.63, implying a stark contrast in bankruptcy risk:
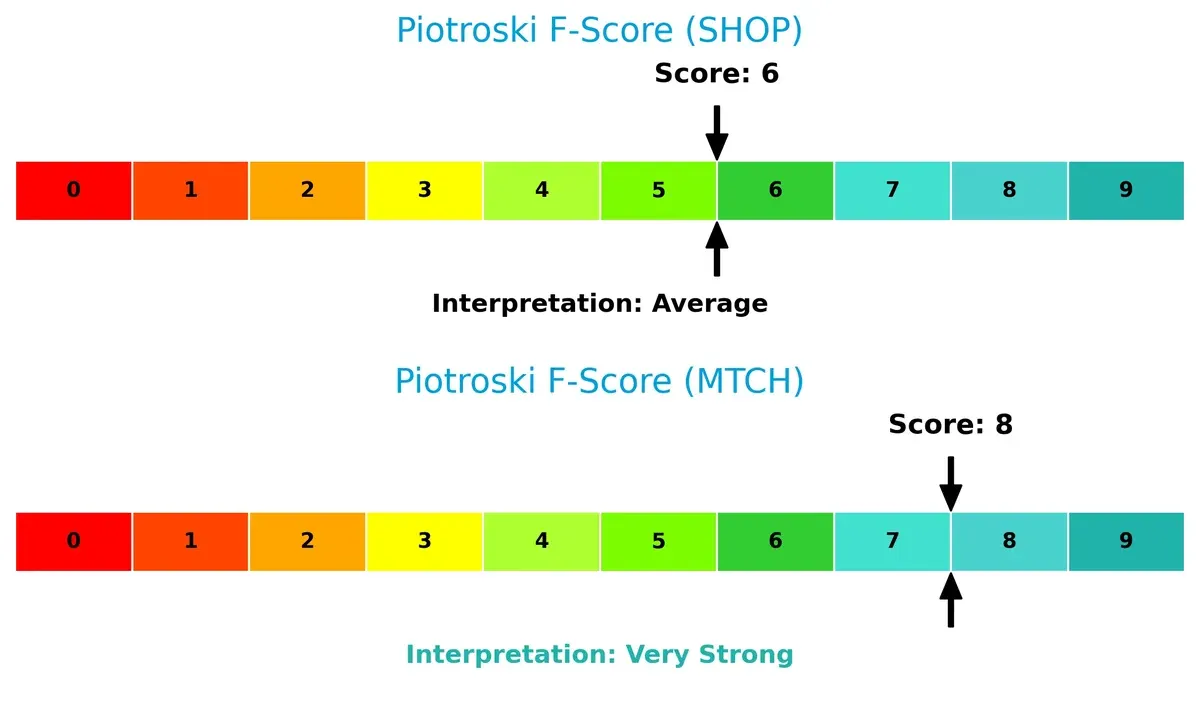
Financial Health: Quality of Operations
Match Group’s Piotroski F-Score of 8 indicates very strong financial health, surpassing Shopify’s average score of 6, which suggests some internal operational red flags:
How are the two companies positioned?
This section dissects the operational DNA of Shopify and Match Group by comparing their revenue distribution and internal dynamics. The goal is to confront their economic moats to identify which model offers the most resilient competitive advantage today.
Revenue Segmentation: The Strategic Mix
This comparison dissects how Shopify Inc. and Match Group, Inc. diversify their income streams and reveal their primary sector bets:
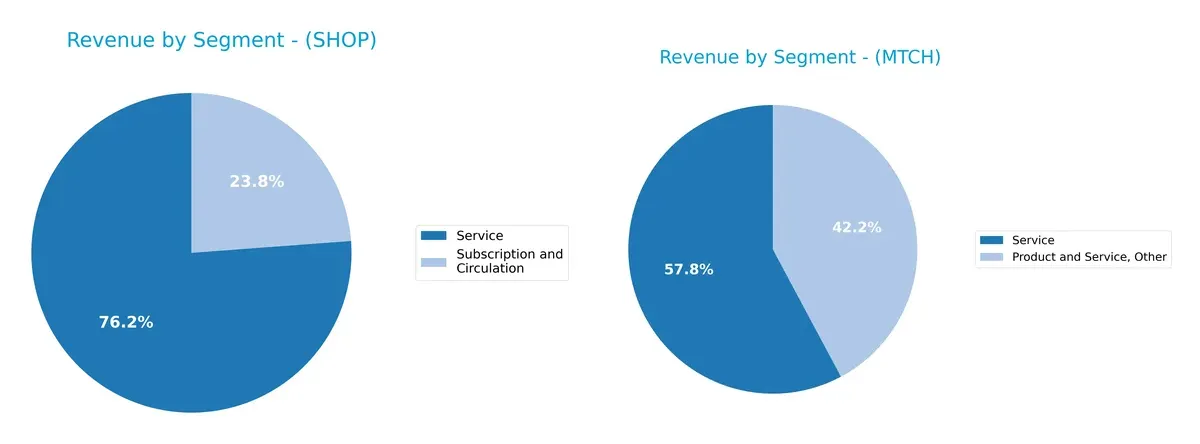
Shopify’s 2025 revenue anchors heavily on Services at $8.8B, with Subscription and Circulation contributing $2.75B, showing a balanced but Service-focused mix. Match Group’s latest data shows a dominant single segment approach, with “Match Group” or core dating services driving over $2B in earlier years, but recent figures lack clear diversification. Shopify’s broader base reduces concentration risk, while Match Group’s reliance on dating platforms heightens exposure to market shifts in user preferences.
Strengths and Weaknesses Comparison
This table compares the Strengths and Weaknesses of Shopify Inc. and Match Group, Inc.:
Shopify Inc. Strengths
- High net margin at 10.65%
- Very strong quick ratio at 12.86
- Very low debt-to-equity at 0.01
- Debt-to-assets very low at 1.24%
- Infinite interest coverage
- Strong fixed asset turnover at 81.96
Match Group, Inc. Strengths
- Higher net margin at 17.59%
- ROIC exceeds WACC at 18.5% vs. 7.65%
- Favorable P/E at 12.77
- Favorable P/B despite negative value
- Moderate current and quick ratios at 1.42
- Interest coverage solid at 6.06
- Dividend yield 2.38%
Shopify Inc. Weaknesses
- ROE at 9.14% below expectation
- ROIC below WACC (15.66% vs. 16.91%)
- Extremely high P/E at 169.86
- Very high P/B at 15.52
- Very high current ratio at 12.86 may indicate inefficient asset use
- No dividend yield
- Global ratios evaluation slightly unfavorable
Match Group, Inc. Weaknesses
- Negative ROE at -241.99%
- Extremely high debt-to-assets at 89.06%
- Negative debt-to-equity ratio
- Global ratios evaluation favorable but risks from leverage
Shopify’s strengths lie in its conservative leverage and strong liquidity, yet its valuation metrics and return on capital ratios raise concerns. Match Group shows robust profitability and capital efficiency but carries significant financial risk due to its high leverage and negative equity returns. Each faces distinct strategic challenges related to capital structure and market valuation.
The Moat Duel: Analyzing Competitive Defensibility
A structural moat is the only reliable shield against competitive erosion of profits over the long term. Here is how Shopify and Match Group defend their turf:
Shopify Inc.: Platform Network Effects
Shopify’s moat stems from powerful network effects linking merchants and consumers. This drives high revenue growth—30% in 2025—and margin stability. However, a negative ROIC vs. WACC signals current value destruction, though a rising ROIC trend hints at potential recovery in 2026.
Match Group, Inc.: Brand Portfolio and Intangible Assets
Match Group relies on a strong brand portfolio with leading dating apps securing customer loyalty. Its high ROIC, 10.9% above WACC, and robust net margin of 17.6% reflect efficient capital use. Despite a slight ROIC decline, expanding global reach in 2026 could deepen its moat.
Verdict: Network Effects vs. Brand Power
Match Group’s wider and deeper moat outperforms Shopify’s nascent network effects. Match converts invested capital into profits more efficiently. I see Match better equipped to defend and grow market share amid intensifying competition.
Which stock offers better returns?
The past year shows Shopify Inc. gaining strong momentum despite recent pullbacks. Match Group, Inc. declines steadily with subdued trading activity.
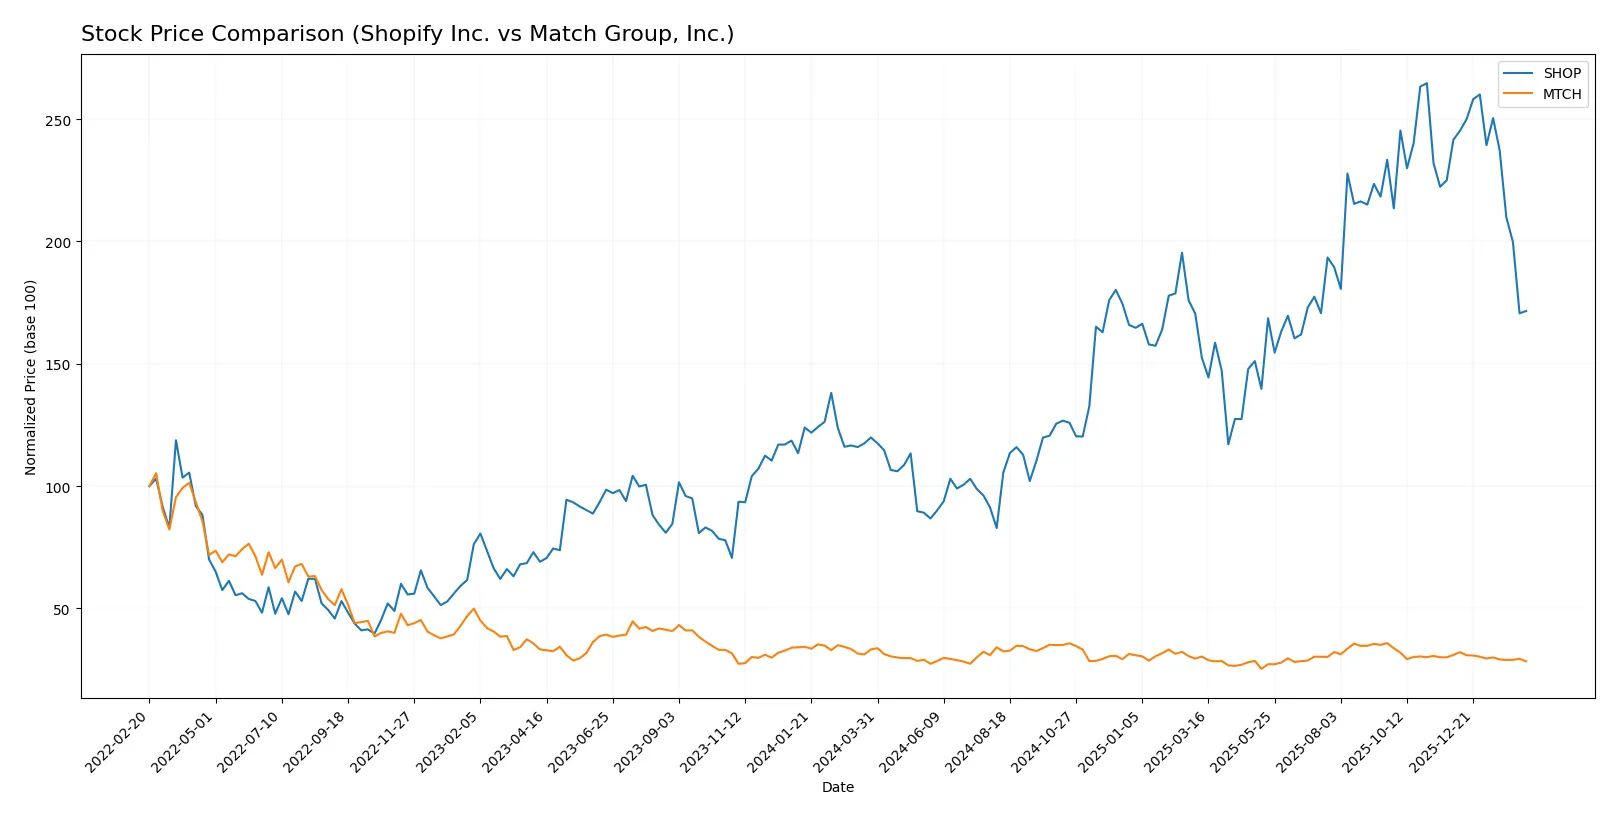
Trend Comparison
Shopify’s stock rose 43.17% over the last 12 months, marking a bullish trend with decelerating momentum and a high volatility of 33.42%. It peaked at 173.86 and bottomed at 54.43.
Match Group’s stock fell 14.69% over the same period, signaling a bearish trend with decelerating decline and low volatility of 2.63%. Its highest price was 38.51 and lowest 27.18.
Shopify outperformed Match Group with a significantly higher price gain and stronger overall market performance during the past year.
Target Prices
Analysts show a clear bullish consensus on both Shopify Inc. and Match Group, Inc.
| Company | Target Low | Target High | Consensus |
|---|---|---|---|
| Shopify Inc. | 115 | 200 | 167.04 |
| Match Group, Inc. | 33 | 43 | 36 |
Shopify’s target consensus at 167.04 suggests 48% upside from the current 112.7 price, reflecting strong growth expectations. Match Group’s 36 target offers a moderate 18% premium over its 30.5 price, signaling cautious optimism.

Don’t Let Luck Decide Your Entry Point
Optimize your entry points with our advanced ProRealTime indicators. You’ll get efficient buy signals with precise price targets for maximum performance. Start outperforming now!
How do institutions grade them?
The following tables summarize recent institutional grades for Shopify Inc. and Match Group, Inc.:
Shopify Inc. Grades
This table presents recent grades and actions from leading financial institutions for Shopify Inc.
| Grading Company | Action | New Grade | Date |
|---|---|---|---|
| Citigroup | Maintain | Buy | 2026-02-13 |
| Wells Fargo | Maintain | Overweight | 2026-02-12 |
| Truist Securities | Maintain | Hold | 2026-02-12 |
| UBS | Maintain | Neutral | 2026-02-12 |
| Mizuho | Upgrade | Outperform | 2026-02-12 |
| Citizens | Maintain | Market Outperform | 2026-02-12 |
| RBC Capital | Maintain | Outperform | 2026-02-12 |
| BMO Capital | Maintain | Outperform | 2026-02-12 |
| Cantor Fitzgerald | Maintain | Neutral | 2026-02-12 |
| Barclays | Maintain | Equal Weight | 2026-02-12 |
Match Group, Inc. Grades
This table shows recent grades and actions from recognized grading firms for Match Group, Inc.
| Grading Company | Action | New Grade | Date |
|---|---|---|---|
| TD Cowen | Maintain | Buy | 2026-02-05 |
| JP Morgan | Maintain | Neutral | 2026-02-04 |
| Truist Securities | Maintain | Hold | 2026-02-04 |
| Morgan Stanley | Maintain | Equal Weight | 2026-01-13 |
| Wells Fargo | Maintain | Equal Weight | 2025-11-05 |
| Evercore ISI Group | Maintain | In Line | 2025-11-05 |
| Truist Securities | Maintain | Hold | 2025-11-05 |
| Morgan Stanley | Maintain | Equal Weight | 2025-10-20 |
| Susquehanna | Maintain | Positive | 2025-08-07 |
| Evercore ISI Group | Maintain | In Line | 2025-08-06 |
Which company has the best grades?
Shopify Inc. has generally stronger grades, including multiple Outperform and Buy ratings. Match Group mostly receives Hold or Neutral grades. Investors may view Shopify as having relatively higher endorsement and growth potential.
Risks specific to each company
The following categories identify the critical pressure points and systemic threats facing both firms in the 2026 market environment:
1. Market & Competition
Shopify Inc.
- Faces intense competition in global e-commerce software with high innovation demands.
Match Group, Inc.
- Operates in a highly competitive dating app market with evolving consumer preferences.
2. Capital Structure & Debt
Shopify Inc.
- Extremely low debt levels, signaling conservative leverage and strong financial flexibility.
Match Group, Inc.
- High debt-to-assets ratio at 89%, increasing financial risk despite favorable interest coverage.
3. Stock Volatility
Shopify Inc.
- High beta of 2.82 indicates significant stock price volatility relative to the market.
Match Group, Inc.
- More moderate beta of 1.32 suggests lower relative stock volatility.
4. Regulatory & Legal
Shopify Inc.
- Subject to global e-commerce regulations and data privacy laws, increasing compliance complexity.
Match Group, Inc.
- Faces regulatory scrutiny on data privacy and content moderation across multiple jurisdictions.
5. Supply Chain & Operations
Shopify Inc.
- Relies on third-party logistics, exposing it to supply chain disruptions and fulfillment delays.
Match Group, Inc.
- Primarily digital service delivery limits supply chain risks but requires reliable platform uptime.
6. ESG & Climate Transition
Shopify Inc.
- Growing pressure to demonstrate sustainable practices in operations and carbon footprint reduction.
Match Group, Inc.
- ESG risks lower due to digital focus but must manage data ethics and social responsibility.
7. Geopolitical Exposure
Shopify Inc.
- Wide international footprint exposes it to trade tensions, tariffs, and currency risks.
Match Group, Inc.
- Mostly US-based but with global users, sensitive to international data laws and political risks.
Which company shows a better risk-adjusted profile?
Match Group’s most impactful risk is its high leverage, which raises solvency concerns despite strong profitability and a very strong Piotroski score. Shopify’s biggest risk lies in its extreme stock volatility and high valuation multiples, which could amplify market shocks. Overall, Match Group shows a better risk-adjusted profile thanks to favorable financial ratios and a safer valuation. Shopify’s elevated beta and expensive price-to-earnings ratio heighten its risk profile amid uncertain market conditions.
Final Verdict: Which stock to choose?
Shopify Inc. shines with unmatched operational efficiency and a rapidly growing ROIC, signaling improving profitability despite currently shedding value. Its robust liquidity is a cushion but also points to potential capital underutilization. This stock suits aggressive growth portfolios willing to embrace volatility for long-term gains.
Match Group, Inc. boasts a strong strategic moat through its recurring revenue and efficient capital use, consistently creating value above its cost of capital. It offers a safer profile with favorable valuation metrics and solid free cash flow yield, fitting well within GARP portfolios balancing growth and reasonable price.
If you prioritize aggressive growth and can tolerate high multiples and short-term earnings pressure, Shopify outshines due to its expanding operational returns and market opportunity. However, if you seek better stability and value with a moat-supported business model, Match Group offers superior capital efficiency and a more attractive risk-return balance.
Disclaimer: Investment carries a risk of loss of initial capital. The past performance is not a reliable indicator of future results. Be sure to understand risks before making an investment decision.
Go Further
I encourage you to read the complete analyses of Shopify Inc. and Match Group, Inc. to enhance your investment decisions: