Home > Comparison > Technology > CRM vs MTCH
The strategic rivalry between Salesforce, Inc. and Match Group, Inc. shapes the technology sector’s software-application landscape. Salesforce operates as a capital-intensive platform powerhouse delivering enterprise CRM solutions globally. Match Group focuses on high-margin, consumer-facing dating services with a diversified brand portfolio. This head-to-head pits broad enterprise integration against niche consumer engagement. This analysis will reveal which model offers a superior risk-adjusted outlook for a diversified portfolio in today’s dynamic tech environment.
Table of contents
Companies Overview
Salesforce and Match Group both wield significant influence in the software application industry, shaping customer engagement in distinct ways.
Salesforce, Inc.: Customer Relationship Management Powerhouse
Salesforce dominates the customer relationship management sector by offering a comprehensive Customer 360 platform. It generates revenue through subscription services for sales, service, marketing, commerce, and analytics solutions. In 2026, Salesforce strategically focuses on expanding its Slack integration and enhancing platform flexibility to unify customer experiences across industries.
Match Group, Inc.: Global Dating Platform Leader
Match Group leads the online dating software market with a portfolio of popular brands like Tinder and Hinge. Its core revenue stems from subscription and advertising fees across its diverse dating apps. In 2026, Match Group prioritizes user engagement and international market expansion to solidify its competitive position in the social connection space.
Strategic Collision: Similarities & Divergences
Both companies operate platform-driven business models but diverge sharply in scope—Salesforce targets enterprise customer ecosystems while Match Group focuses on consumer dating networks. Their primary market battlegrounds differ: Salesforce competes in enterprise software integration, whereas Match Group battles for user attention in social matchmaking. This contrast yields distinct investment profiles—Salesforce’s breadth suggests stability; Match Group’s niche offers growth through user monetization.
Income Statement Comparison
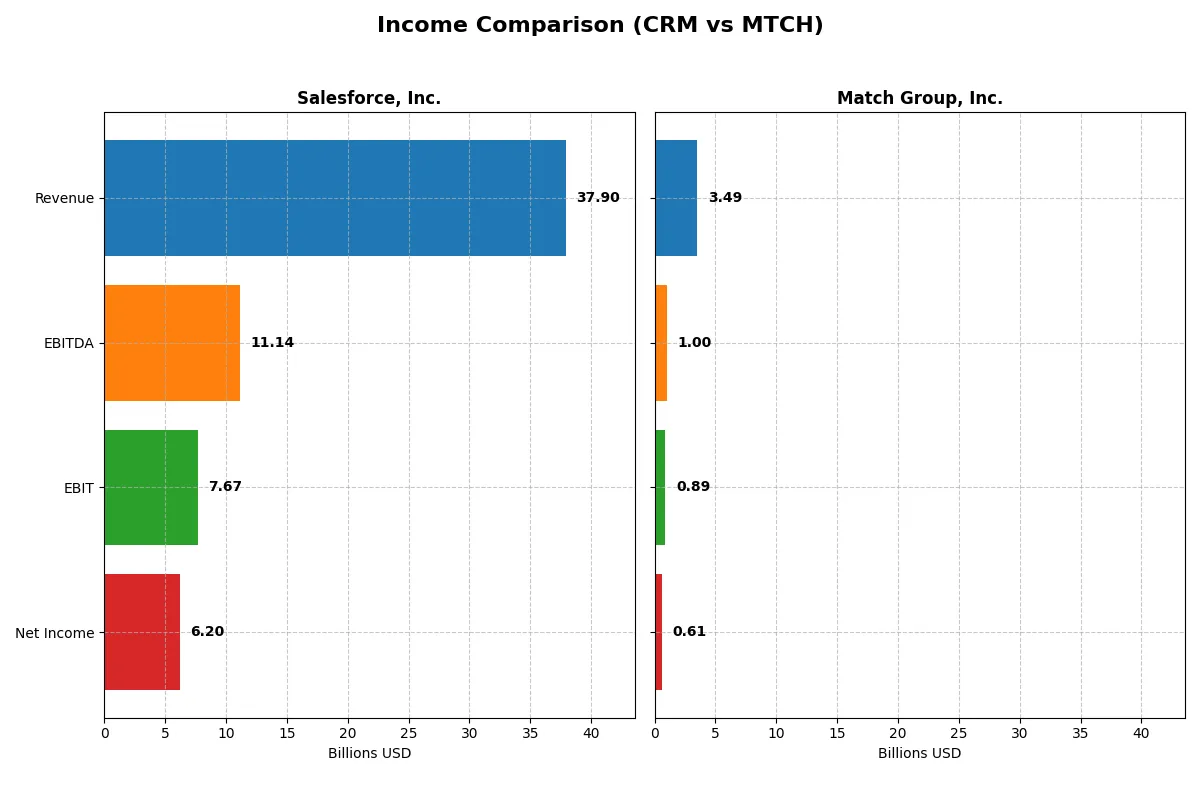
This data dissects the core profitability and scalability of both corporate engines to reveal who dominates the bottom line:
| Metric | Salesforce, Inc. (CRM) | Match Group, Inc. (MTCH) |
|---|---|---|
| Revenue | 37.9B | 3.49B |
| Cost of Revenue | 8.64B | 948M |
| Operating Expenses | 22.0B | 1.67B |
| Gross Profit | 29.3B | 2.54B |
| EBITDA | 11.1B | 999M |
| EBIT | 7.67B | 894M |
| Interest Expense | 272M | 148M |
| Net Income | 6.20B | 613M |
| EPS | 6.44 | 2.53 |
| Fiscal Year | 2025 | 2025 |
Income Statement Analysis: The Bottom-Line Duel
This income statement comparison exposes which company converts revenue into profit most efficiently, revealing their true corporate strength.
Salesforce, Inc. Analysis
Salesforce grew revenue from $21.3B in 2021 to $37.9B in 2025, with net income surging from $4.07B to $6.2B. Its gross margin remains robust at 77.2%, reflecting disciplined cost control. The net margin expanded to 16.4% in 2025, showing strong profit conversion amid solid operating leverage and a 27.8% EBIT growth last year.
Match Group, Inc. Analysis
Match Group’s revenue increased modestly from $3.0B in 2021 to $3.49B in 2025, with net income doubling from $283M to $613M. Despite a smaller scale, it sustains a healthy gross margin of 72.8% and outperforms Salesforce on EBIT margin at 25.6%. Its net margin improved to 17.6%, driven by steady earnings growth and disciplined expense management.
Scale and Margin Efficiency: Salesforce vs. Match Group
Salesforce dominates in scale and absolute profit, leveraging a vast revenue base and strong margin expansion. Match Group, while smaller, delivers superior EBIT margins and faster net income growth percentage-wise. Investors seeking growth with margin efficiency may favor Match Group’s leaner model, whereas those prioritizing scale and steady profit gains might lean toward Salesforce.
Financial Ratios Comparison
These vital ratios act as a diagnostic tool to expose the underlying fiscal health, valuation premiums, and capital efficiency of the companies compared below:
| Ratios | Salesforce, Inc. (CRM) | Match Group, Inc. (MTCH) |
|---|---|---|
| ROE | 10.13% | -2.42% |
| ROIC | 7.95% | 22.50% |
| P/E | 53.04 | 12.77 |
| P/B | 5.37 | -30.91 |
| Current Ratio | 1.06 | 1.42 |
| Quick Ratio | 1.06 | 1.42 |
| D/E | 0.19 | -15.67 |
| Debt-to-Assets | 11.07% | 89.06% |
| Interest Coverage | 26.49 | 5.91 |
| Asset Turnover | 0.37 | 0.78 |
| Fixed Asset Turnover | 7.03 | 26.59 |
| Payout Ratio | 24.80% | 30.36% |
| Dividend Yield | 0.47% | 2.38% |
| Fiscal Year | 2025 | 2025 |
Efficiency & Valuation Duel: The Vital Signs
Ratios act as a company’s DNA, uncovering hidden risks and operational strengths that define long-term viability and shareholder value.
Salesforce, Inc.
Salesforce shows moderate profitability with a 10.13% ROE and a favorable 16.35% net margin. However, its P/E of 53.04 signals a stretched valuation relative to earnings. The company returns value modestly through a low 0.47% dividend yield, favoring reinvestment in R&D and growth initiatives to sustain future expansion.
Match Group, Inc.
Match Group posts a strong 17.59% net margin and an impressive 22.5% ROIC, reflecting efficient capital use. Its P/E of 12.77 suggests the stock is attractively valued. Despite a negative ROE, it supports shareholders with a 2.38% dividend yield, balancing income distribution with growth capital allocation in a competitive sector.
Valuation Stretch vs. Capital Efficiency
Match Group offers a more balanced risk-reward profile with superior capital returns and attractive valuation metrics. Salesforce, while operationally sound, trades at a premium that demands continued growth execution. Income-focused investors may prefer Match’s dividend, while growth-oriented profiles fit Salesforce’s reinvestment strategy.
Which one offers the Superior Shareholder Reward?
Salesforce (CRM) pays a modest 0.47% dividend with a sustainable 25% payout ratio, supported by strong free cash flow of 12.9/share and buybacks. Match Group (MTCH) yields 2.38% with a 30% payout ratio but carries heavy debt and volatile equity. I see CRM’s disciplined buybacks and conservative dividend as a more sustainable, long-term shareholder reward in 2026.
Comparative Score Analysis: The Strategic Profile
The radar chart reveals the fundamental DNA and trade-offs of Salesforce, Inc. and Match Group, Inc., highlighting their core financial strengths and weaknesses:
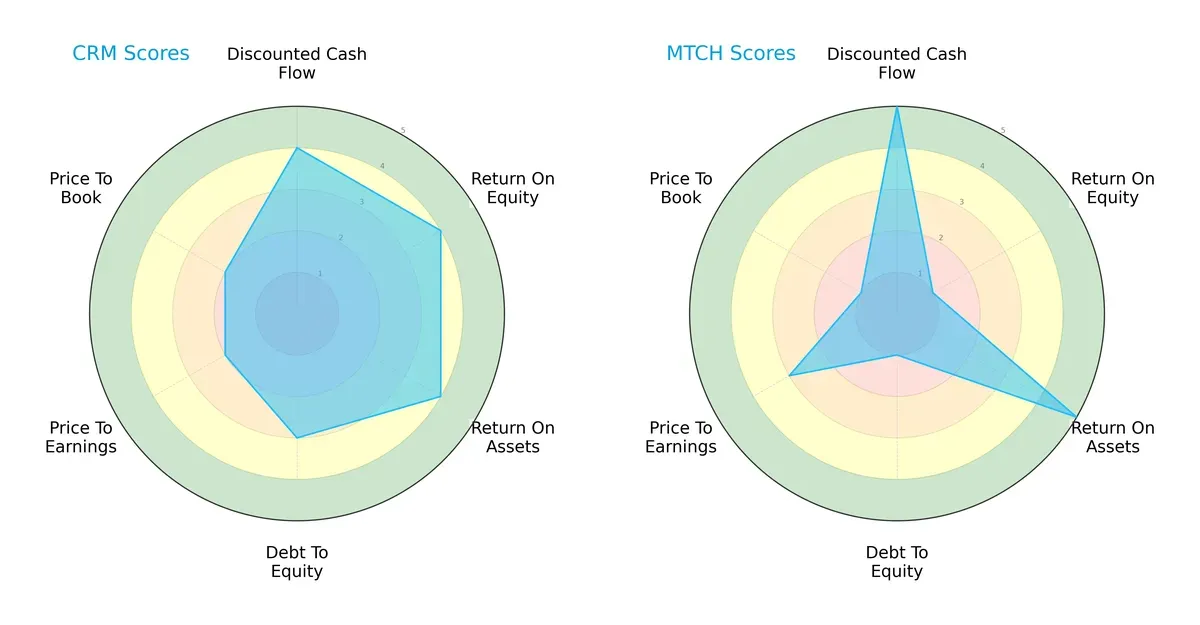
Salesforce shows balanced strengths in ROE (4), ROA (4), and DCF (4), with moderate debt management (3) but weaker valuation scores (PE/PB at 2). Match Group excels in DCF (5) and ROA (5) but suffers from low ROE (1) and poor debt control (1), signaling reliance on asset efficiency rather than equity returns. Salesforce presents a more balanced profile, while Match Group depends heavily on its cash flow and asset utilization edge.
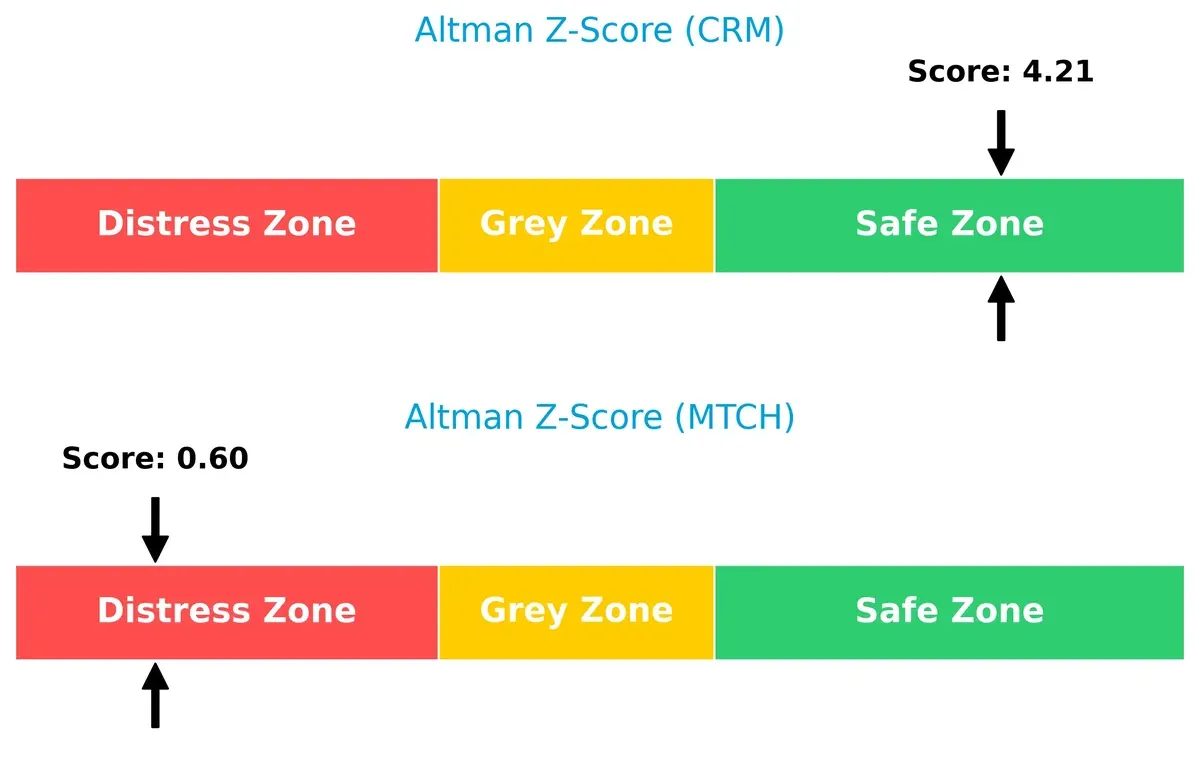
Bankruptcy Risk: Solvency Showdown
Salesforce’s Altman Z-Score of 4.21 places it firmly in the safe zone, indicating strong solvency. Match Group’s 0.60 score signals distress and a high bankruptcy risk. This stark contrast underlines Salesforce’s superior long-term survival prospects and financial stability in this cycle:
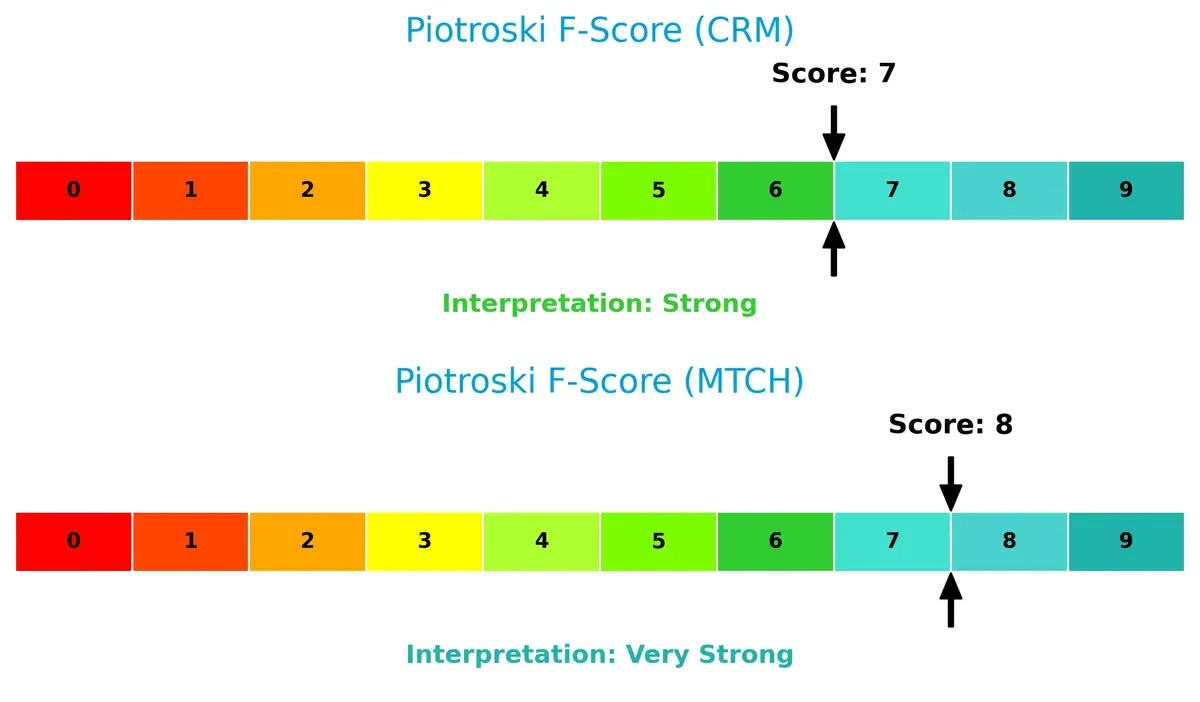
Financial Health: Quality of Operations
Match Group posts a very strong Piotroski F-Score of 8, slightly outperforming Salesforce’s strong 7. Both firms show robust internal financial metrics, but Salesforce’s marginally lower score suggests minor operational red flags compared to Match Group’s peak financial health:
How are the two companies positioned?
This section dissects the operational DNA of Salesforce and Match Group by comparing their revenue distribution and internal dynamics. The goal is to confront their economic moats and identify which model delivers the most resilient competitive advantage today.
Revenue Segmentation: The Strategic Mix
This visual comparison dissects how Salesforce, Inc. and Match Group, Inc. diversify their income streams and where their primary sector bets lie:
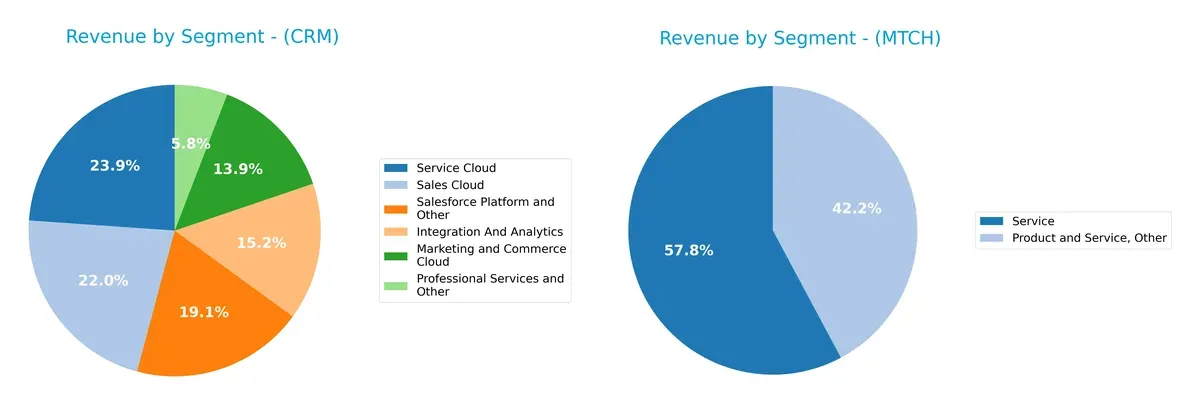
Salesforce boasts a highly diversified revenue base, with no single segment dominating. Its Service Cloud leads at $9B, followed closely by Sales Cloud at $8.3B. In contrast, Match Group relies heavily on its Dating segment, anchoring most revenue with limited diversification. Salesforce’s broad portfolio reduces concentration risk and builds ecosystem lock-in. Match Group’s focus heightens exposure but leverages its infrastructure dominance in online dating.
Strengths and Weaknesses Comparison
This table compares the Strengths and Weaknesses of Salesforce, Inc. and Match Group, Inc.:
Salesforce Strengths
- Diversified revenue streams across six segments
- Strong global presence with significant Americas and Europe sales
- Favorable net margin and interest coverage
- Low debt-to-assets ratio supports financial stability
Match Group Strengths
- Favorable net margin and high ROIC exceeding WACC
- Attractive valuation metrics (PE and PB ratios)
- Favorable debt metrics despite high debt-to-assets
- Global presence with nearly balanced US and Non-US revenue
Salesforce Weaknesses
- Unfavorable high valuation multiples (PE and PB)
- Neutral ROIC below WACC indicating capital efficiency concerns
- Asset turnover below sector average signals efficiency challenges
- Low dividend yield may deter income-focused investors
Match Group Weaknesses
- Severely negative ROE highlights profitability issues
- High debt-to-assets ratio poses financial risk
- Asset turnover only neutral, indicating moderate efficiency
- Negative equity position reflected in debt-to-equity ratio
Overall, Salesforce shows a broad and balanced business model with solid financial health but faces valuation and efficiency challenges. Match Group achieves strong profitability and valuation but carries significant financial leverage risks that could impact its strategic flexibility.
The Moat Duel: Analyzing Competitive Defensibility
A structural moat is the only reliable shield protecting long-term profits from relentless competitive erosion:
Salesforce, Inc.: Platform Ecosystem with Intangible Asset Moat
Salesforce leverages its vast customer 360 platform and Slack integration, creating high switching costs and margin stability. Despite current value shedding, growing ROIC signals deepening moat potential in 2026.
Match Group, Inc.: Network Effects with User Base Moat
Match Group’s extensive dating brands generate powerful network effects, driving superior ROIC above WACC and solid margin expansion. Its moat strengthens steadily, positioning it well for market expansion and disruption.
Platform Integration vs. Network Dominance: The Moat Showdown
Match Group’s network effect moat proves wider and more sustainable than Salesforce’s intangible asset moat. Match’s consistent value creation and profitability growth better defend its market share in 2026.
Which stock offers better returns?
The past year shows significant price declines for both Salesforce and Match Group, with varied volatility and shifting buyer-seller dynamics shaping trading behavior.
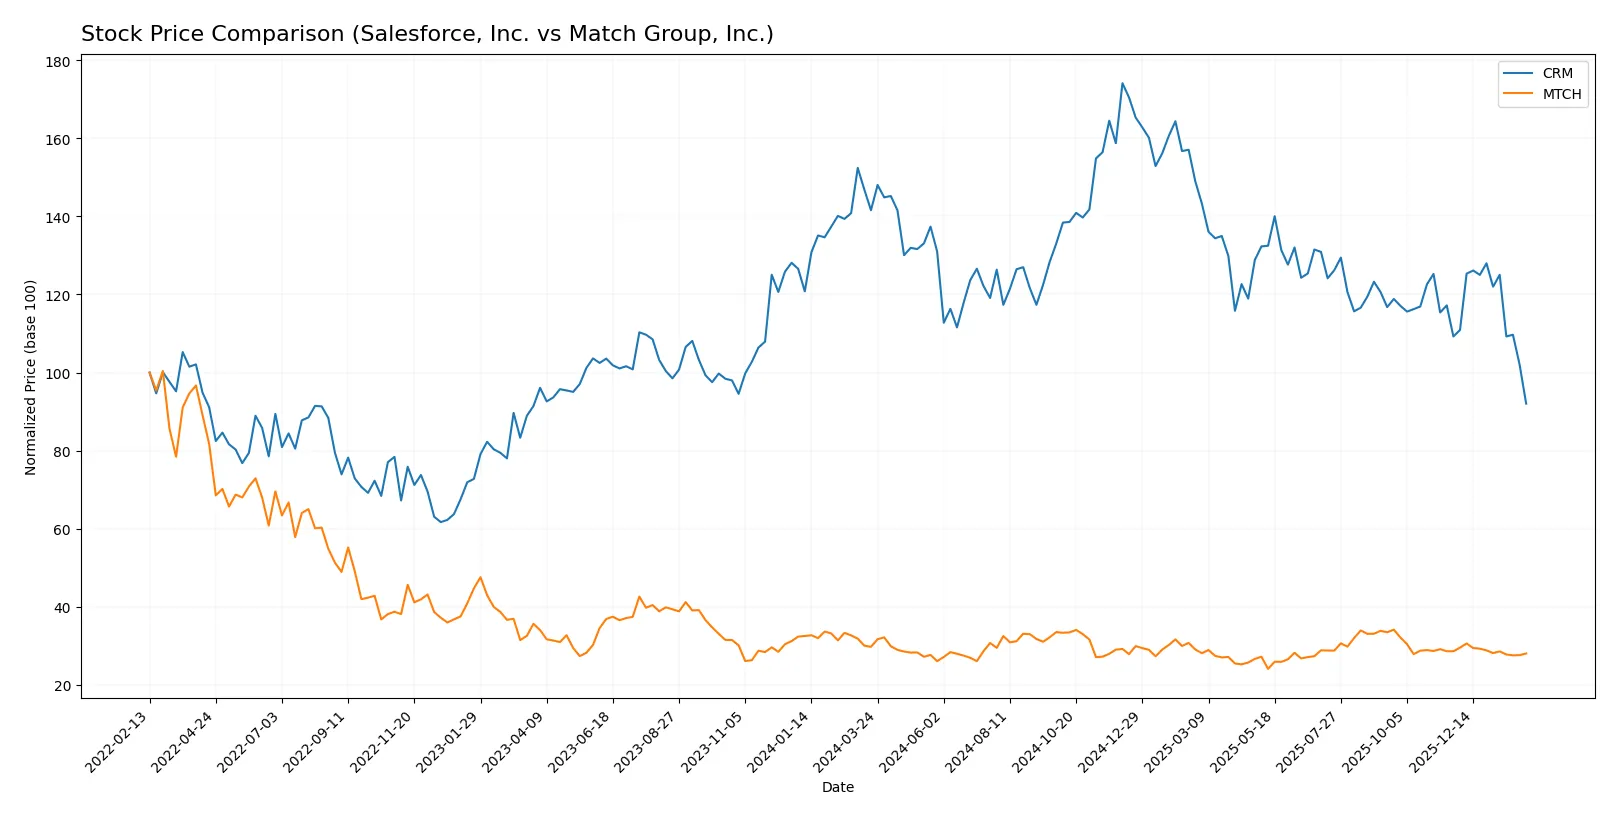
Trend Comparison
Salesforce, Inc. (CRM) exhibits a strong bearish trend with a -35.0% price drop over 12 months and a decelerating downward momentum. Volatility remains high, with a standard deviation of 33.28.
Match Group, Inc. (MTCH) also shows a bearish trend, down -5.7% over the same period, with deceleration and low volatility at 2.61 standard deviation, indicating more stable price movement.
Salesforce’s steeper decline and higher volatility contrast with Match Group’s milder fall and steadier trading, making Match Group the better performer by market price retention.
Target Prices
Analyst consensus reveals a bullish outlook for both Salesforce, Inc. and Match Group, Inc.
| Company | Target Low | Target High | Consensus |
|---|---|---|---|
| Salesforce, Inc. | 250 | 400 | 324.17 |
| Match Group, Inc. | 33 | 43 | 36 |
Salesforce’s target consensus of 324.17 is significantly above its current 191.35 price, indicating potential upside. Match Group’s consensus at 36 also suggests room for appreciation from 31.63 today.

Don’t Let Luck Decide Your Entry Point
Optimize your entry points with our advanced ProRealTime indicators. You’ll get efficient buy signals with precise price targets for maximum performance. Start outperforming now!
How do institutions grade them?
Salesforce, Inc. Grades
The following table summarizes recent institutional grades for Salesforce, Inc.:
| Grading Company | Action | New Grade | Date |
|---|---|---|---|
| Piper Sandler | Maintain | Overweight | 2026-02-03 |
| Barclays | Maintain | Overweight | 2026-01-12 |
| RBC Capital | Maintain | Sector Perform | 2026-01-05 |
| Morgan Stanley | Maintain | Overweight | 2025-12-09 |
| Citigroup | Maintain | Neutral | 2025-12-08 |
| DA Davidson | Maintain | Neutral | 2025-12-05 |
| Northland Capital Markets | Maintain | Market Perform | 2025-12-04 |
| Canaccord Genuity | Maintain | Buy | 2025-12-04 |
| Truist Securities | Maintain | Buy | 2025-12-04 |
| Baird | Maintain | Outperform | 2025-12-04 |
Match Group, Inc. Grades
The following table summarizes recent institutional grades for Match Group, Inc.:
| Grading Company | Action | New Grade | Date |
|---|---|---|---|
| TD Cowen | Maintain | Buy | 2026-02-05 |
| JP Morgan | Maintain | Neutral | 2026-02-04 |
| Truist Securities | Maintain | Hold | 2026-02-04 |
| Morgan Stanley | Maintain | Equal Weight | 2026-01-13 |
| Truist Securities | Maintain | Hold | 2025-11-05 |
| Evercore ISI Group | Maintain | In Line | 2025-11-05 |
| Wells Fargo | Maintain | Equal Weight | 2025-11-05 |
| Morgan Stanley | Maintain | Equal Weight | 2025-10-20 |
| Susquehanna | Maintain | Positive | 2025-08-07 |
| JP Morgan | Maintain | Neutral | 2025-08-06 |
Which company has the best grades?
Salesforce consistently earns higher grades such as Overweight and Buy compared to Match Group’s Neutral and Equal Weight consensus. This suggests stronger institutional confidence in Salesforce, potentially influencing investor perception and demand.
Risks specific to each company
The following risk categories highlight critical pressure points and systemic threats both Salesforce, Inc. and Match Group, Inc. face in the 2026 market environment:
1. Market & Competition
Salesforce, Inc.
- Operates in highly competitive SaaS with pressure from cloud giants and niche startups.
Match Group, Inc.
- Faces intense competition from emerging dating apps and shifting consumer preferences.
2. Capital Structure & Debt
Salesforce, Inc.
- Low debt-to-equity (0.19), strong interest coverage (28.18), signaling conservative leverage.
Match Group, Inc.
- High debt-to-assets (89.06%) and negative debt-to-equity ratio indicate heavy leverage risk.
3. Stock Volatility
Salesforce, Inc.
- Beta at 1.276 suggests moderate sensitivity to market swings.
Match Group, Inc.
- Slightly higher beta of 1.315 implies greater stock price volatility.
4. Regulatory & Legal
Salesforce, Inc.
- Subject to data privacy regulations impacting cloud and CRM operations globally.
Match Group, Inc.
- Faces scrutiny on user data privacy and content moderation in multiple jurisdictions.
5. Supply Chain & Operations
Salesforce, Inc.
- Relies on robust cloud infrastructure and global partner ecosystems, potential tech disruptions.
Match Group, Inc.
- Dependence on app store platforms and digital infrastructure exposes operational risks.
6. ESG & Climate Transition
Salesforce, Inc.
- Strong ESG initiatives and integration into cloud operations reduce environmental risk.
Match Group, Inc.
- ESG risks moderate but lag Salesforce in climate and social governance practices.
7. Geopolitical Exposure
Salesforce, Inc.
- Global operations vulnerable to trade tensions and regulatory divergence.
Match Group, Inc.
- International footprint exposes it to geopolitical risks, especially in privacy laws.
Which company shows a better risk-adjusted profile?
Salesforce’s most impactful risk lies in fierce market competition and high valuation multiples. Match Group’s key risk is its heavy debt load, evidenced by elevated leverage ratios and distress-zone Altman Z-score. Despite higher volatility, Match Group’s favorable operational scores contrast with financial distress signals. Salesforce’s stronger balance sheet and safer Altman Z-score yield a better risk-adjusted profile amid 2026 uncertainties. I note Match Group’s Altman Z-score below 1.8 signals bankruptcy risk, justifying heightened caution.
Final Verdict: Which stock to choose?
Salesforce, Inc. demonstrates a superpower in sustained revenue growth and strong income quality, driven by its unmatched efficiency in capital allocation. Its key point of vigilance lies in a valuation premium and moderate asset turnover, which might limit near-term upside. It fits well in aggressive growth portfolios seeking innovation leaders.
Match Group, Inc. offers a strategic moat through its high return on invested capital and robust free cash flow yield, underpinned by its recurring revenue safety in the digital dating space. It appears financially favorable with a stronger margin of safety versus Salesforce. This makes it suitable for GARP investors balancing growth and valuation discipline.
If you prioritize growth backed by market leadership and expanding profitability, Salesforce is the compelling choice due to its scale and innovation engine. However, if you seek superior capital efficiency and better stability at a reasonable valuation, Match Group outshines with its sustainable competitive advantage and attractive cash flow profile.
Disclaimer: Investment carries a risk of loss of initial capital. The past performance is not a reliable indicator of future results. Be sure to understand risks before making an investment decision.
Go Further
I encourage you to read the complete analyses of Salesforce, Inc. and Match Group, Inc. to enhance your investment decisions: