PTC Inc. and Match Group, Inc. are two prominent players in the software application industry, each carving distinct niches with innovative approaches. PTC focuses on advanced digital transformation tools and product lifecycle management, while Match Group leads in online dating platforms with a diverse brand portfolio. This comparison highlights their market strategies and growth potential, guiding investors toward the most compelling opportunity for their portfolios. Let’s explore which company stands out for your investment.
Table of contents
Companies Overview
I will begin the comparison between PTC Inc. and Match Group, Inc. by providing an overview of these two companies and their main differences.
PTC Inc. Overview
PTC Inc. is a software and services company headquartered in Boston, Massachusetts, operating globally across the Americas, Europe, and Asia Pacific. Its mission focuses on enabling enterprises to digitally transform their business through platforms like ThingWorx for industrial innovation, Vuforia for augmented reality, and Onshape for product development. PTC serves clients with a broad software portfolio including product lifecycle management and application lifecycle management solutions.
Match Group, Inc. Overview
Match Group, based in Dallas, Texas, operates in the technology sector providing dating products worldwide. Its portfolio includes prominent brands such as Tinder, Match, OkCupid, and Hinge. The company’s mission centers on connecting people through its diverse dating platforms, leveraging technology to facilitate social interactions and relationships globally. Match Group employs around 2,500 full-time staff and serves a consumer-facing market.
Key similarities and differences
Both PTC and Match Group operate in the application software industry within the technology sector, but their business models differ significantly. PTC focuses on enterprise clients with software solutions for product design, lifecycle, and digital transformation, emphasizing industrial and professional services. In contrast, Match Group targets individual consumers with social and dating platforms, prioritizing user engagement and brand diversity. Their scale also varies, with PTC employing over 7,500 people versus Match’s 2,500.
Income Statement Comparison
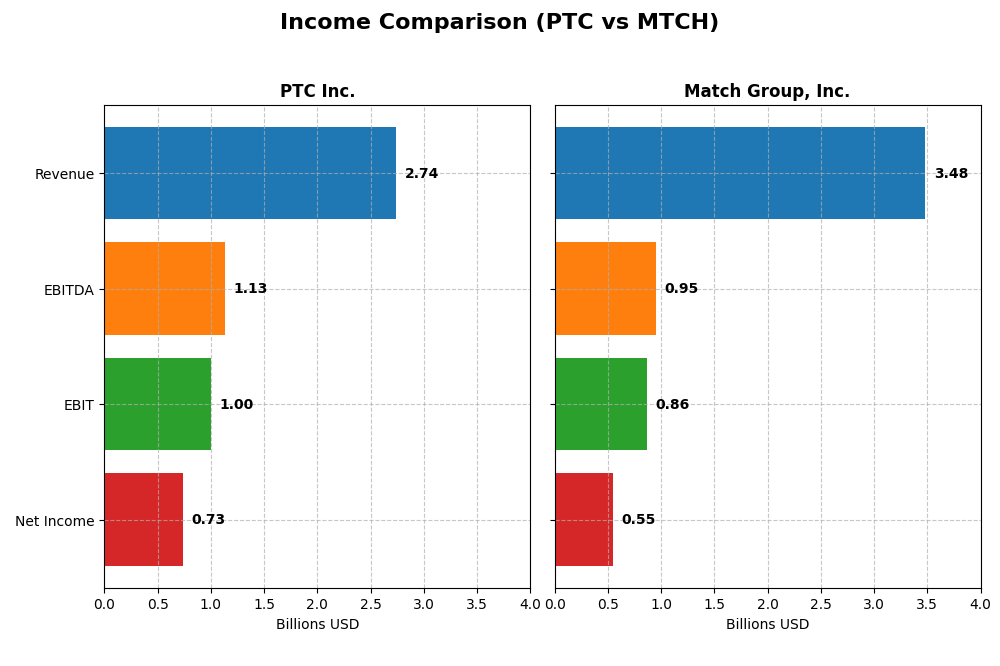
The table below compares the most recent full fiscal year income statement metrics for PTC Inc. and Match Group, Inc., providing a clear financial snapshot for investors evaluating these technology companies.
| Metric | PTC Inc. | Match Group, Inc. |
|---|---|---|
| Market Cap | 19.9B | 7.4B |
| Revenue | 2.74B | 3.48B |
| EBITDA | 1.13B | 952M |
| EBIT | 997M | 864M |
| Net Income | 734M | 551M |
| EPS | 6.18 | 2.12 |
| Fiscal Year | 2025 | 2024 |
Income Statement Interpretations
PTC Inc.
PTC Inc. demonstrated strong revenue growth from 2021 to 2025, increasing from 1.81B to 2.74B, with net income rising from 477M to 734M. Margins remained robust and stable, with a gross margin of 83.76% and a net margin of 26.8%. The latest fiscal year showed a significant acceleration in growth rates and margin improvement, reflecting favorable operational efficiency and profitability.
Match Group, Inc.
Match Group’s revenue grew steadily from 2.39B in 2020 to 3.48B in 2024, with net income climbing from 168M to 551M. Margins were lower than PTC’s, with a gross margin of 71.51% and a net margin of 15.84%, but generally favorable. However, the most recent year showed a slowdown in revenue growth to 3.41% and declines in EBIT, net margin, and EPS, indicating some operational challenges.
Which one has the stronger fundamentals?
PTC Inc. exhibits stronger fundamentals with higher and more consistent margin levels, substantial recent growth acceleration, and favorable evaluations across nearly all income statement metrics. Match Group, while showing strong long-term growth, experienced recent margin compression and profit declines, making its fundamentals comparatively less robust despite positive overall trends.
Financial Ratios Comparison
Below is a comparative overview of key financial ratios for PTC Inc. and Match Group, Inc. based on their most recent fiscal year data, illustrating their profitability, liquidity, leverage, and market valuation metrics.
| Ratios | PTC Inc. (2025) | Match Group, Inc. (2024) |
|---|---|---|
| ROE | 19.2% | -865.9% |
| ROIC | 14.4% | 16.4% |
| P/E | 33.2 | 15.4 |
| P/B | 6.37 | -133.7 |
| Current Ratio | 1.12 | 2.54 |
| Quick Ratio | 1.12 | 2.54 |
| D/E (Debt-to-Equity) | 0.36 | -62.1 |
| Debt-to-Assets | 20.7% | 88.5% |
| Interest Coverage | 12.8 | 5.14 |
| Asset Turnover | 0.41 | 0.78 |
| Fixed Asset Turnover | 15.6 | 22.0 |
| Payout Ratio | 0% | 0% |
| Dividend Yield | 0% | 0% |
Interpretation of the Ratios
PTC Inc.
PTC shows mostly strong financial ratios, with favorable net margin at 26.8%, ROE at 19.18%, and ROIC at 14.43%, indicating efficient profitability and capital use. Concerns include an unfavorable high P/E of 33.19 and P/B of 6.37, plus a neutral current ratio of 1.12. PTC does not pay dividends, likely reinvesting earnings for growth, as reflected by the zero dividend yield and absence of payout.
Match Group, Inc.
Match Group presents a mixed ratio profile with favorable net margin (15.84%) and ROIC (16.38%), but a significantly negative ROE (-865.98%) and unfavorable debt-to-assets ratio at 88.51%, pointing to high leverage risks. Its current and quick ratios are strong at 2.54. Match Group pays dividends, but dividend yield is zero, possibly due to reinvestment strategies or cash flow constraints despite a last dividend of 0.76.
Which one has the best ratios?
Both companies have a favorable overall ratio profile, but PTC’s ratios lean toward profitability and moderate leverage with fewer concerns about debt, while Match Group faces substantial leverage risk and negative equity returns. PTC’s higher valuation multiples may concern investors, whereas Match Group’s dividend and liquidity strengths contrast its financial risk.
Strategic Positioning
This section compares the strategic positioning of PTC and Match Group, including Market position, Key segments, and Exposure to technological disruption:
PTC
- Strong market cap of 19.9B in software with moderate beta, facing typical tech competitive pressure.
- Diversified software segments: License, Support & Cloud Services, and Technology Services drive revenue growth.
- Invests in advanced digital transformation platforms and AR, indicating exposure and adaptation to tech disruption.
Match Group
- Smaller market cap of 7.4B in dating apps with higher beta, exposed to intense competition in digital services.
- Concentrated portfolio focused on dating platforms like Tinder, Match, and Hinge as main business drivers.
- Operates primarily digital dating products, exposed to fast-evolving consumer tech trends and platform innovation.
PTC vs Match Group Positioning
PTC pursues a diversified approach across software products and services, supporting stable growth, while Match Group focuses on a niche dating market with multiple brands. PTC’s broader portfolio may reduce segment risk compared to Match Group’s concentrated exposure.
Which has the best competitive advantage?
PTC shows a very favorable moat with growing ROIC and strong value creation, indicating durable competitive advantage. Match Group creates value but faces a slightly favorable moat with declining profitability, suggesting less stable competitive positioning.
Stock Comparison
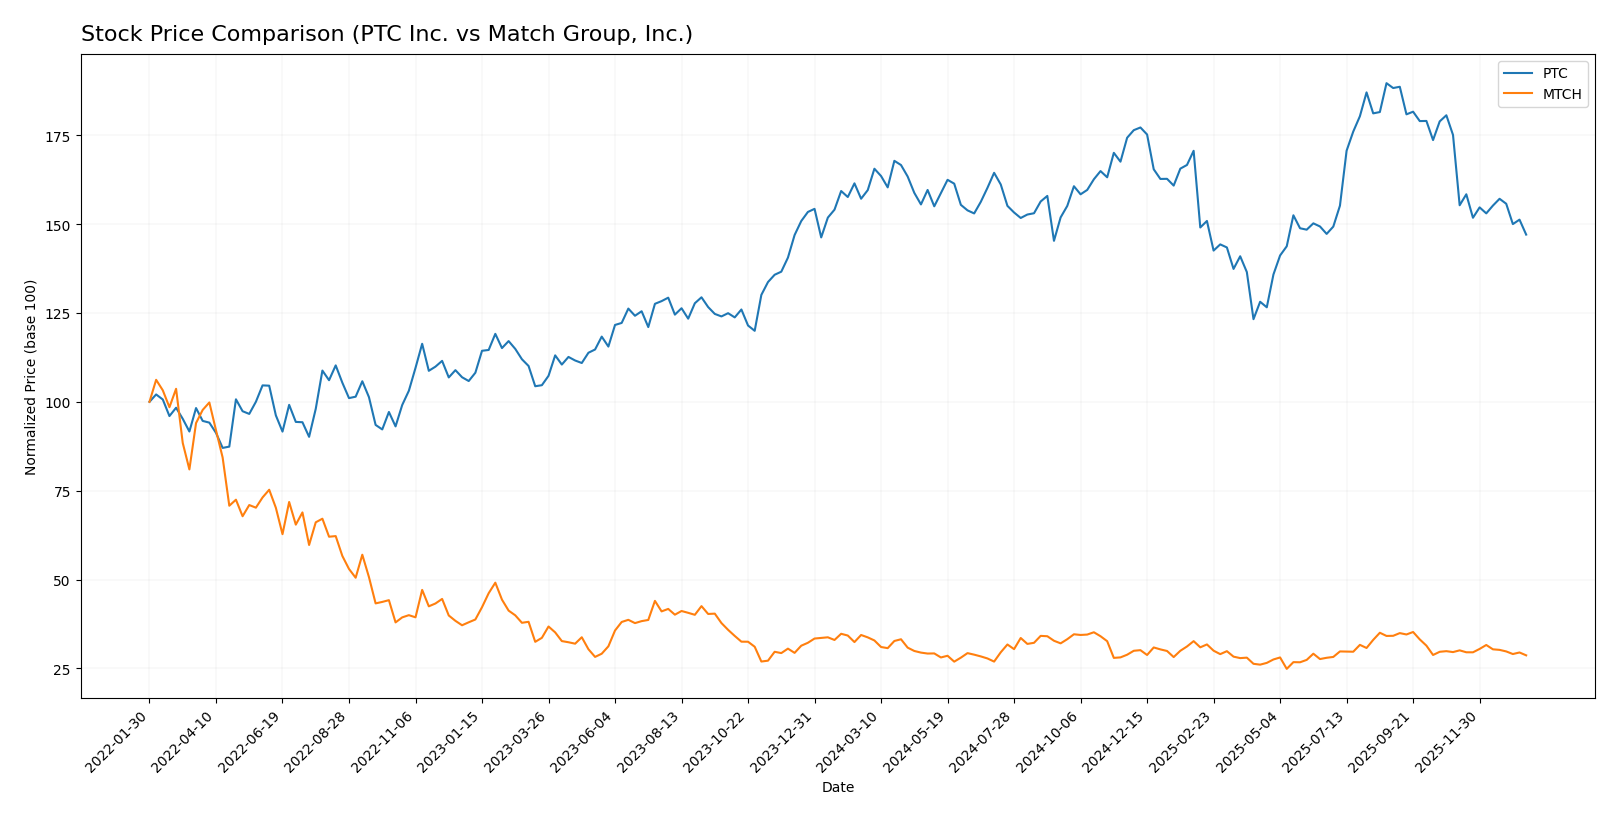
The stock prices of PTC Inc. and Match Group, Inc. have exhibited notable bearish trends with decelerating price declines over the past 12 months, reflecting contrasting volatility and trading volume dynamics.
Trend Analysis
PTC Inc.’s stock showed a bearish trend over the past year, declining by 7.84% with a high volatility marked by a 15.47 std deviation and a deceleration in the downtrend. The stock ranged between 139.77 and 215.05.
Match Group, Inc. experienced a steeper bearish trend, falling 14.98% over the same period with lower volatility at 2.64 std deviation and also a deceleration in the price decline. The price fluctuated between 27.18 and 38.51.
Comparing the two, Match Group delivered the largest market performance loss, with a 14.98% decrease versus PTC’s 7.84% decline, indicating a more pronounced downtrend in its stock price.
Target Prices
The current analyst consensus presents a positive outlook for both PTC Inc. and Match Group, Inc.
| Company | Target High | Target Low | Consensus |
|---|---|---|---|
| PTC Inc. | 255 | 120 | 213.25 |
| Match Group, Inc. | 43 | 33 | 36.29 |
Analysts expect PTC’s stock to appreciate significantly above its current price of $166.75, while Match Group’s consensus target is moderately above its current price of $31.34, indicating cautious optimism.
Analyst Opinions Comparison
This section compares analysts’ ratings and grades for PTC Inc. and Match Group, Inc.:
Rating Comparison
PTC Rating
- Rating: B+, considered very favorable by analysts.
- Discounted Cash Flow Score: 4, favorable valuation.
- ROE Score: 4, favorable indication of profit efficiency.
- ROA Score: 5, very favorable asset utilization.
- Debt To Equity Score: 2, moderate financial risk.
- Overall Score: 3, moderate overall financial standing.
MTCH Rating
- Rating: B, also rated very favorable by analysts.
- Discounted Cash Flow Score: 5, very favorable rating.
- ROE Score: 1, very unfavorable profit efficiency.
- ROA Score: 5, very favorable asset utilization.
- Debt To Equity Score: 1, very unfavorable financial risk.
- Overall Score: 3, moderate overall financial standing.
Which one is the best rated?
PTC holds a higher rating (B+) with stronger ROE and debt-to-equity scores, showing better financial efficiency and stability. MTCH excels in discounted cash flow and ROA but scores poorly in ROE and debt metrics.
Scores Comparison
The comparison of PTC and Match Group scores highlights their financial health and bankruptcy risk:
PTC Scores
- Altman Z-Score: 5.67, indicating a safe zone with low bankruptcy risk.
- Piotroski Score: 8, classified as very strong financial health.
MTCH Scores
- Altman Z-Score: 0.52, indicating distress zone and high bankruptcy risk.
- Piotroski Score: 8, also classified as very strong financial health.
Which company has the best scores?
PTC shows a significantly stronger Altman Z-Score in the safe zone, while both have equally strong Piotroski Scores. Based solely on bankruptcy risk, PTC has better scores.
Grades Comparison
The following presents a detailed comparison of the latest reliable grades for PTC Inc. and Match Group, Inc.:
PTC Inc. Grades
This table summarizes recent grades assigned to PTC Inc. by verified grading companies.
| Grading Company | Action | New Grade | Date |
|---|---|---|---|
| Piper Sandler | Maintain | Neutral | 2025-11-07 |
| Rosenblatt | Maintain | Buy | 2025-11-06 |
| Rosenblatt | Maintain | Buy | 2025-10-30 |
| Oppenheimer | Maintain | Outperform | 2025-07-31 |
| Rosenblatt | Maintain | Buy | 2025-07-31 |
| Barclays | Maintain | Overweight | 2025-07-31 |
| Stifel | Maintain | Buy | 2025-07-31 |
| Keybanc | Maintain | Overweight | 2025-07-31 |
| RBC Capital | Maintain | Outperform | 2025-07-31 |
| Piper Sandler | Maintain | Neutral | 2025-07-31 |
PTC Inc.’s grades predominantly indicate a positive outlook, with most firms maintaining Buy, Outperform, or Overweight ratings and a few Neutral assessments.
Match Group, Inc. Grades
This table summarizes recent grades assigned to Match Group, Inc. by verified grading companies.
| Grading Company | Action | New Grade | Date |
|---|---|---|---|
| Morgan Stanley | Maintain | Equal Weight | 2026-01-13 |
| Truist Securities | Maintain | Hold | 2025-11-05 |
| Evercore ISI Group | Maintain | In Line | 2025-11-05 |
| Wells Fargo | Maintain | Equal Weight | 2025-11-05 |
| Morgan Stanley | Maintain | Equal Weight | 2025-10-20 |
| Susquehanna | Maintain | Positive | 2025-08-07 |
| Evercore ISI Group | Maintain | In Line | 2025-08-06 |
| JP Morgan | Maintain | Neutral | 2025-08-06 |
| UBS | Maintain | Neutral | 2025-07-23 |
| Wells Fargo | Maintain | Equal Weight | 2025-06-27 |
Match Group’s ratings generally reflect a neutral to moderately positive stance, with most grades at Equal Weight, Hold, or Neutral levels and a few Positive ratings.
Which company has the best grades?
PTC Inc. has received generally stronger grades with multiple Buy and Outperform ratings, while Match Group, Inc.’s grades cluster around Hold and Equal Weight. This difference may influence investors’ perceptions of growth potential and risk profiles.
Strengths and Weaknesses
Below is a comparison of key strengths and weaknesses for PTC Inc. and Match Group, Inc. based on the most recent financial and operational data.
| Criterion | PTC Inc. | Match Group, Inc. |
|---|---|---|
| Diversification | Strong diversification with License, Technology Service, and Support & Cloud Services revenue streams totaling over $2.9B in 2025 | Less diversified, primarily focused on dating and related services with ~$2.3B revenue in 2020 |
| Profitability | High net margin at 26.8%, ROIC 14.43%, favorable profitability metrics | Moderate net margin at 15.84%, ROIC 16.38%, but negative ROE due to recent challenges |
| Innovation | Demonstrates durable competitive advantage with growing ROIC (+42%) indicating strong innovation and value creation | Creating value but with declining ROIC (-40%), signaling challenges in sustaining innovation |
| Global presence | Extensive global operations supported by cloud and technology service platforms | Global user base for dating services but higher debt and asset leverage may limit expansion flexibility |
| Market Share | Solid market presence in industrial software and services with efficient capital use | Leading player in online dating but facing profitability and leverage pressures |
Key takeaways: PTC Inc. displays a strong and growing competitive edge with diversified revenue and robust profitability, suitable for investors seeking stability and innovation. Match Group, while profitable and a market leader, faces declining profitability trends and higher financial leverage, requiring cautious evaluation.
Risk Analysis
Below is a comparison table of key risks affecting PTC Inc. and Match Group, Inc. in 2026:
| Metric | PTC Inc. | Match Group, Inc. |
|---|---|---|
| Market Risk | Moderate (Beta 1.01) | High (Beta 1.33) |
| Debt level | Low (D/E 0.36, Debt/Assets 20.7%) | High (D/E negative, Debt/Assets 88.5%) |
| Regulatory Risk | Moderate (Tech sector compliance) | High (Data privacy and content regulations) |
| Operational Risk | Moderate (Global service delivery) | Moderate (Platform stability, user retention) |
| Environmental Risk | Low (Software-focused, minimal footprint) | Low (Digital services, limited direct impact) |
| Geopolitical Risk | Moderate (Global presence in Americas, Europe, Asia) | Moderate (Operating in multiple countries with varying laws) |
The most impactful and likely risks are Match Group’s high leverage and regulatory challenges tied to data privacy and content moderation, which could affect profitability and reputation. PTC presents a safer debt profile but faces operational risks from its global software deployment and moderate market volatility. Investors should weigh Match’s financial distress signals against its strong operational scores.
Which Stock to Choose?
PTC Inc. shows a strong income evolution with a 19.18% revenue growth in 2025 and consistently favorable profitability metrics, including a 26.8% net margin. Financial ratios are mostly favorable, with solid returns on equity (19.18%) and invested capital (14.43%), low debt levels, and a very favorable rating of B+. The company demonstrates a very favorable moat with growing ROIC exceeding WACC, indicating durable competitive advantage.
Match Group, Inc. presents moderate income growth with 3.41% revenue increase in 2024 and some unfavorable trends in recent profitability, including a negative return on equity and declining EBIT. Financial ratios are mixed but generally favorable, especially return on invested capital (16.38%) and liquidity ratios, though debt to assets is high. Its rating is slightly lower at B, and the moat evaluation is slightly favorable due to a declining ROIC trend.
Investors focused on stability and durable profitability might find PTC’s very favorable rating and strong income growth appealing, whereas those more tolerant of risk and seeking value creation despite some profitability challenges could view Match Group’s favorable ratios and value metrics as attractive. The choice could depend on whether an investor prioritizes consistent financial strength or potential turnaround opportunities.
Disclaimer: Investment carries a risk of loss of initial capital. The past performance is not a reliable indicator of future results. Be sure to understand risks before making an investment decision.
Go Further
I encourage you to read the complete analyses of PTC Inc. and Match Group, Inc. to enhance your investment decisions: