In today’s dynamic tech landscape, Match Group, Inc. and Perfect Corp. stand out as innovative players within the software application industry. Match Group dominates the global dating market with a diverse brand portfolio, while Perfect Corp. pioneers AI-driven beauty and fashion tech solutions. Despite their distinct niches, both companies leverage cutting-edge technology to disrupt traditional markets. This article will help you decide which company offers the most compelling investment opportunity in 2026.

Table of contents
Companies Overview
I will begin the comparison between Match Group and Perfect Corp by providing an overview of these two companies and their main differences.
Match Group Overview
Match Group, Inc. operates globally in the dating software application sector, managing a portfolio of brands such as Tinder, Match, and OkCupid. Founded in 1986 and headquartered in Dallas, Texas, its mission centers on connecting people worldwide through its diverse dating platforms. The company is a significant player in the technology sector with a market cap of approximately 7.4B USD and employs around 2,500 people.
Perfect Corp Overview
Perfect Corp. specializes in SaaS artificial intelligence and augmented reality solutions for the beauty and fashion tech industries. Established in 2015 and based in New Taipei City, Taiwan, it develops virtual try-on apps and AI-powered beauty tools. As a smaller entity with a 179M USD market cap and 342 employees, it focuses on innovative AR and AI applications to enhance consumer experiences in fashion and cosmetics.
Key similarities and differences
Both companies operate in the software application industry within the technology sector, leveraging digital innovation to serve consumer markets. Match Group focuses on social and dating platforms, while Perfect Corp. targets beauty and fashion tech through AI and AR. They differ significantly in market capitalization, geographic base, and product specialization, with Match Group having a more extensive global dating presence and Perfect Corp. emphasizing niche AI-driven virtual try-on technologies.
Income Statement Comparison
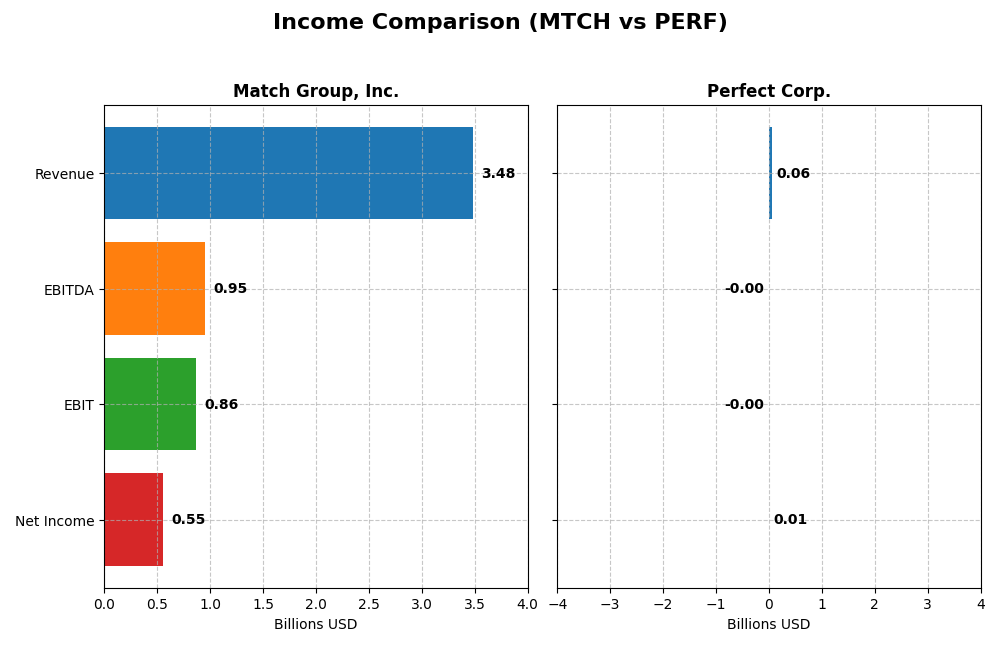
Below is a side-by-side comparison of key income statement metrics for Match Group, Inc. and Perfect Corp. for the fiscal year 2024.
| Metric | Match Group, Inc. (MTCH) | Perfect Corp. (PERF) |
|---|---|---|
| Market Cap | 7.4B | 179M |
| Revenue | 3.48B | 60.2M |
| EBITDA | 952M | -2.0M |
| EBIT | 864M | -2.8M |
| Net Income | 551M | 5.0M |
| EPS | 2.12 | 0.05 |
| Fiscal Year | 2024 | 2024 |
Income Statement Interpretations
Match Group, Inc.
Match Group’s revenue rose steadily from $2.39B in 2020 to $3.48B in 2024, with net income surging from $168M to $564M over the same period. Gross and net margins improved notably, reaching 71.5% and 15.8% respectively in 2024. However, despite revenue growth slowing to 3.4% in 2024, margins remained favorable though operating expenses rose slightly.
Perfect Corp.
Perfect Corp. doubled its revenue from $29.9M in 2020 to $60.2M in 2024, with net income turning positive after prior losses, reaching $5M in 2024. Gross margin stayed strong at 78%, but EBIT margin remained negative at -4.7%. The latest year showed decent revenue growth of 12.5%, though EBIT declined sharply, reflecting ongoing profitability challenges.
Which one has the stronger fundamentals?
Both companies show favorable income statement trends, but Match Group exhibits stronger profitability with positive EBIT and net margins, and consistent net income growth. Perfect Corp. demonstrates rapid revenue growth and improving net income but struggles with negative EBIT margin and volatile earnings. Match Group’s fundamentals appear more robust and stable based on margin and income metrics.
Financial Ratios Comparison
This table presents a side-by-side comparison of the most recent financial ratios for Match Group, Inc. and Perfect Corp., based on their fiscal year 2024 data.
| Ratios | Match Group, Inc. (MTCH) | Perfect Corp. (PERF) |
|---|---|---|
| ROE | -8.66% | 3.42% |
| ROIC | 16.38% | -2.10% |
| P/E | 15.44 | 56.6 |
| P/B | -133.75 | 1.93 |
| Current Ratio | 2.54 | 5.52 |
| Quick Ratio | 2.54 | 5.52 |
| D/E | -62.09 | 0.0035 |
| Debt-to-Assets | 88.51% | 0.28% |
| Interest Coverage | 5.14 | -449 |
| Asset Turnover | 0.78 | 0.33 |
| Fixed Asset Turnover | 22.00 | 57.94 |
| Payout ratio | 0 | 0 |
| Dividend yield | 0 | 0 |
Interpretation of the Ratios
Match Group, Inc.
Match Group shows a majority of favorable ratios, including a strong net margin of 15.84% and a solid return on invested capital at 16.38%. However, the negative return on equity of -865.98% and high debt to assets ratio of 88.51% raise concerns about financial leverage and shareholder returns. The company pays dividends, but with a zero dividend yield, indicating limited current income distribution.
Perfect Corp.
Perfect Corp. presents a mixed ratio profile with a neutral net margin of 8.34% and favorable weighted average cost of capital at 5.96%. Yet, the company’s return on invested capital is negative at -2.1%, and it suffers from an unfavorable interest coverage ratio. It does not pay dividends, likely reflecting its reinvestment focus in R&D and growth, as indicated by high research and development expenses.
Which one has the best ratios?
Match Group exhibits a more favorable ratio profile overall, with a higher proportion of positive metrics, notably in profitability and leverage management, despite some risks tied to debt levels and negative ROE. Perfect Corp.’s ratios lean toward a slightly unfavorable assessment due to weaker profitability and capital efficiency, reflecting its growth-stage characteristics.
Strategic Positioning
This section compares the strategic positioning of Match Group, Inc. and Perfect Corp., focusing on market position, key segments, and exposure to technological disruption:
Match Group, Inc.
- Leading dating software provider with strong competitive pressure in global markets.
- Focused on dating products including Tinder, Match, and others driving revenue growth.
- Exposure to disruption through evolving digital dating platforms and app innovation.
Perfect Corp.
- Smaller market cap with niche focus in beauty and fashion tech SaaS solutions.
- Specializes in AI and AR beauty and fashion tech applications and virtual try-ons.
- Faces disruption risks tied to rapid AI and AR technology advancements in beauty tech.
Match Group, Inc. vs Perfect Corp. Positioning
Match Group shows a diversified portfolio centered on digital dating, benefiting from scale but facing intense competition. Perfect Corp. is more concentrated in AI/AR beauty tech, offering specialized solutions but with a narrower market scope and smaller scale.
Which has the best competitive advantage?
Match Group holds a slightly favorable moat with value creation despite declining profitability, while Perfect Corp. shows a slightly unfavorable moat, shedding value but improving profitability, indicating differing competitive advantages.
Stock Comparison
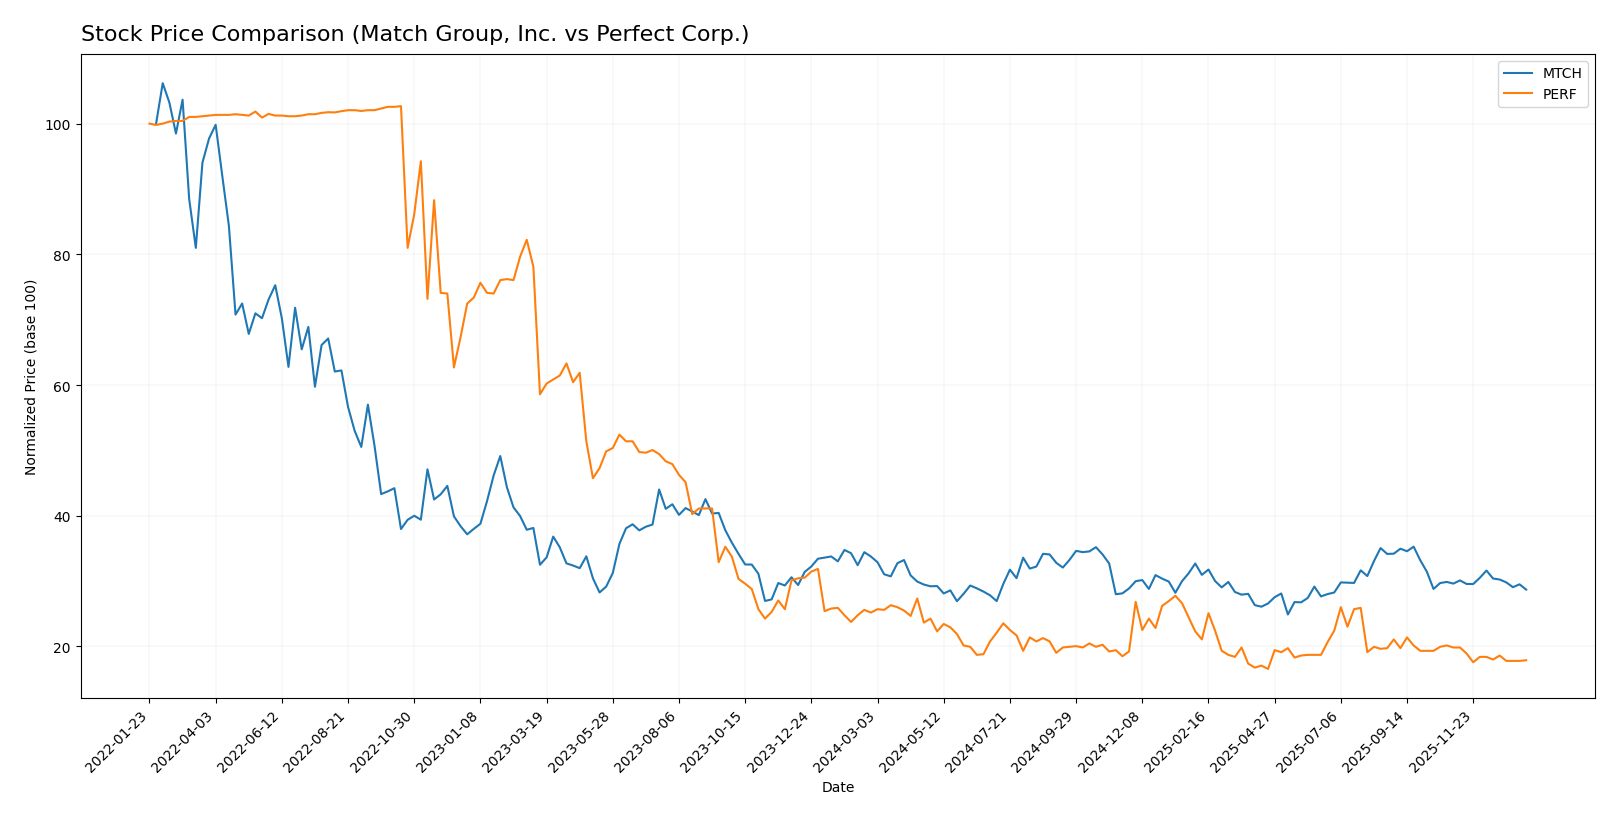
Over the past year, both Match Group, Inc. and Perfect Corp. exhibited notable price declines, with decelerating bearish trends and shifting trading dynamics marked by seller dominance and contrasting volume patterns.
Trend Analysis
Match Group, Inc. (MTCH) experienced a bearish trend over the past 12 months with a -14.98% price decrease and decelerating downward momentum. The stock fluctuated between a high of 38.51 and a low of 27.18, showing moderate volatility (std deviation 2.64).
Perfect Corp. (PERF) showed a more pronounced bearish trend, declining by -28.98% over the same period with deceleration and low volatility (std deviation 0.27). The stock’s price ranged from 2.70 to 1.61, reflecting weaker market performance.
Comparing both stocks, Match Group delivered a higher market performance than Perfect Corp., with a smaller percentage decline and greater price volatility over the past year.
Target Prices
The current analyst consensus provides a clear outlook on target prices for Match Group, Inc. and Perfect Corp.
| Company | Target High | Target Low | Consensus |
|---|---|---|---|
| Match Group, Inc. | 43 | 33 | 36.29 |
| Perfect Corp. | 7 | 7 | 7 |
Analysts expect Match Group’s stock to trade moderately above its current price of 31.34 USD, indicating potential upside. Perfect Corp.’s consensus target is significantly higher than its current price of 1.74 USD, suggesting strong growth expectations.
Analyst Opinions Comparison
This section compares analysts’ ratings and grades for Match Group, Inc. and Perfect Corp.:
Rating Comparison
Match Group, Inc. Rating
- Rating: B, assessed as Very Favorable by analysts.
- Discounted Cash Flow Score: 5, indicating very favorable cash flow projections.
- ROE Score: 1, rated very unfavorable for profit generation efficiency.
- ROA Score: 5, very favorable asset utilization.
- Debt To Equity Score: 1, very unfavorable, indicating higher financial risk.
- Overall Score: 3, moderate overall financial standing.
Perfect Corp. Rating
- Rating: A-, also rated Very Favorable.
- Discounted Cash Flow Score: 5, equally very favorable outlook.
- ROE Score: 2, moderate efficiency in generating profit.
- ROA Score: 3, moderate effectiveness in asset use.
- Debt To Equity Score: 4, favorable, suggesting lower financial risk.
- Overall Score: 4, favorable overall financial position.
Which one is the best rated?
Based strictly on the provided data, Perfect Corp. holds a stronger overall rating and better scores for ROE, ROA, debt-to-equity, and overall financial standing compared to Match Group, Inc., which has mixed evaluations.
Scores Comparison
Here is a comparison of the Altman Z-Score and Piotroski Score for both companies:
MTCH Scores
- Altman Z-Score: 0.52, indicating financial distress and high bankruptcy risk.
- Piotroski Score: 8, reflecting very strong financial health and investment potential.
PERF Scores
- Altman Z-Score: 1.31, also in distress zone with high bankruptcy risk.
- Piotroski Score: 6, showing average financial strength and moderate investment appeal.
Which company has the best scores?
Based on the provided data, MTCH has a much stronger Piotroski Score than PERF, suggesting better financial health. However, both companies are in the Altman Z-Score distress zone, indicating elevated bankruptcy risk for each.
Grades Comparison
Here is a comparison of recent grades assigned to Match Group, Inc. and Perfect Corp. by recognized grading companies:
Match Group, Inc. Grades
The following table summarizes recent grades from established financial firms for Match Group, Inc.:
| Grading Company | Action | New Grade | Date |
|---|---|---|---|
| Morgan Stanley | Maintain | Equal Weight | 2026-01-13 |
| Truist Securities | Maintain | Hold | 2025-11-05 |
| Evercore ISI Group | Maintain | In Line | 2025-11-05 |
| Wells Fargo | Maintain | Equal Weight | 2025-11-05 |
| Morgan Stanley | Maintain | Equal Weight | 2025-10-20 |
| Susquehanna | Maintain | Positive | 2025-08-07 |
| Evercore ISI Group | Maintain | In Line | 2025-08-06 |
| JP Morgan | Maintain | Neutral | 2025-08-06 |
| UBS | Maintain | Neutral | 2025-07-23 |
| Wells Fargo | Maintain | Equal Weight | 2025-06-27 |
The grades for Match Group, Inc. predominantly indicate a stable or neutral outlook, with no upgrades or downgrades recently.
Perfect Corp. Grades
The following table summarizes recent grades from reputable grading companies for Perfect Corp.:
| Grading Company | Action | New Grade | Date |
|---|---|---|---|
| Piper Sandler | Maintain | Neutral | 2024-02-29 |
| Goldman Sachs | Maintain | Neutral | 2023-10-26 |
| Piper Sandler | Maintain | Neutral | 2023-10-25 |
| Piper Sandler | Maintain | Neutral | 2023-07-26 |
| Piper Sandler | Maintain | Neutral | 2023-07-25 |
| Piper Sandler | Maintain | Neutral | 2023-04-27 |
| Oppenheimer | Downgrade | Perform | 2023-04-20 |
| Oppenheimer | Downgrade | Perform | 2023-04-19 |
| Oppenheimer | Downgrade | Perform | 2023-04-18 |
| Piper Sandler | Maintain | Neutral | 2023-03-08 |
Grades for Perfect Corp. mainly reflect a neutral stance, with a prior downgrade from Outperform to Perform in early 2023.
Which company has the best grades?
Match Group, Inc. has received a more favorable consensus with 17 buys and 15 holds, compared to Perfect Corp.’s unanimous hold ratings. This suggests Match Group may be viewed as having a better growth or stability outlook, potentially attracting investors seeking moderate risk with positive momentum.
Strengths and Weaknesses
Below is a comparison of key strengths and weaknesses for Match Group, Inc. (MTCH) and Perfect Corp. (PERF) based on the most recent financial and operational data.
| Criterion | Match Group, Inc. (MTCH) | Perfect Corp. (PERF) |
|---|---|---|
| Diversification | Moderate; primarily dating services with some other revenue streams | Limited; lacks diversified revenue segments |
| Profitability | Strong net margin (15.84%), favorable ROIC (16.38%), but declining overall ROIC trend | Lower net margin (8.34%), negative ROIC (-2.1%), improving ROIC trend |
| Innovation | Established market leader with consistent innovation in dating apps | Innovation potential high, reflected by growing ROIC but yet to translate into profitability |
| Global presence | Significant global footprint in online dating market | Smaller scale, global reach less pronounced |
| Market Share | Leading position in dating industry | Emerging player, market share not yet substantial |
Key takeaway: Match Group shows strong profitability and global presence but faces declining efficiency in capital use, signaling caution. Perfect Corp. is improving operationally with growing profitability indicators but still struggles with value creation and scale.
Risk Analysis
Below is a comparison of key risk factors for Match Group, Inc. (MTCH) and Perfect Corp. (PERF) based on the most recent data from 2024.
| Metric | Match Group, Inc. (MTCH) | Perfect Corp. (PERF) |
|---|---|---|
| Market Risk | Beta 1.33 indicates moderate volatility | Beta 0.45 shows lower volatility |
| Debt level | High debt-to-assets at 88.5% (unfavorable) | Very low debt-to-assets at 0.28% (favorable) |
| Regulatory Risk | US-based, subject to stringent data privacy and dating app regulations | Taiwan-based, subject to tech and AI regulations in Asia |
| Operational Risk | Managing multiple dating platforms globally; risk of platform disruptions | AI and AR tech reliance; risks in technology adoption and innovation |
| Environmental Risk | Low direct environmental impact; tech sector typical | Low direct environmental impact; software-focused |
| Geopolitical Risk | Moderate, US market exposure and international user base | Elevated due to Taiwan location amid regional tensions |
The most impactful risks are Match Group’s high leverage, which could strain financial flexibility, and Perfect Corp.’s geopolitical risk stemming from its Taiwan base amid regional uncertainties. Market volatility affects Match Group more due to its higher beta, while Perfect’s operational risk centers on rapid tech innovation demands. Investors should weigh these factors carefully alongside each company’s financial health.
Which Stock to Choose?
Match Group, Inc. (MTCH) shows favorable income evolution with strong gross and net margins, though recent declines in EBIT and EPS growth. Its financial ratios are predominantly favorable, indicating solid profitability and liquidity despite high debt levels. The company holds a very favorable overall rating with a moderate score, reflecting mixed but generally positive fundamentals.
Perfect Corp. (PERF) demonstrates favorable income growth overall, with strong revenue increases and gross margin, yet faces challenges in EBIT margin and interest coverage. Its financial ratios are mixed, with several unfavorable metrics despite good liquidity and low debt. The firm has a very favorable rating with a favorable overall score, though some key profitability ratios remain under pressure.
Considering ratings and financial performance, MTCH might appeal to investors prioritizing stable profitability and value creation despite debt concerns, while PERF could be more attractive to those favoring growth potential amid ongoing profitability recovery. The choice could depend on whether an investor prefers established value creation or potential growth with some risk.
Disclaimer: Investment carries a risk of loss of initial capital. The past performance is not a reliable indicator of future results. Be sure to understand risks before making an investment decision.
Go Further
I encourage you to read the complete analyses of Match Group, Inc. and Perfect Corp. to enhance your investment decisions: