Home > Comparison > Technology > PAYC vs MTCH
The strategic rivalry between Paycom Software, Inc. and Match Group, Inc. defines the current trajectory of the technology sector’s software application industry. Paycom operates a capital-intensive human capital management platform focused on comprehensive workforce solutions. Match Group leads as a high-margin provider of global dating services with a diversified brand portfolio. This analysis explores which company offers a superior risk-adjusted return, balancing growth potential against operational resilience for a diversified portfolio.
Table of contents
Companies Overview
Paycom Software and Match Group represent significant players in the U.S. technology sector, each dominating distinct digital service domains.
Paycom Software, Inc.: Human Capital Management Innovator
Paycom stands as a leader in cloud-based human capital management (HCM) solutions for small to mid-sized U.S. firms. Its core revenue derives from subscription fees for a comprehensive SaaS platform managing recruitment, payroll, and workforce analytics. In 2026, Paycom emphasizes integrated data analytics and mobile management tools to enhance employer-employee engagement and operational efficiency.
Match Group, Inc.: Global Dating Platform Powerhouse
Match Group commands a diverse portfolio of leading dating services like Tinder and OkCupid, generating revenue primarily through subscriptions and in-app purchases. The company focuses on expanding its user base worldwide while investing in brand differentiation and technology upgrades to sustain engagement. Match Group’s 2026 strategy centers on innovation to capture shifting consumer preferences in digital matchmaking.
Strategic Collision: Similarities & Divergences
Both companies leverage software-as-a-service models but serve fundamentally different markets—Paycom targets enterprise HR, while Match Group focuses on consumer dating platforms. Their primary battleground is digital user engagement, yet Paycom emphasizes operational efficiency and compliance, whereas Match Group prioritizes social connectivity and brand loyalty. This difference shapes distinct investment profiles: Paycom offers steady growth tied to business spending; Match Group’s fortunes hinge on consumer trends and platform innovation.
Income Statement Comparison
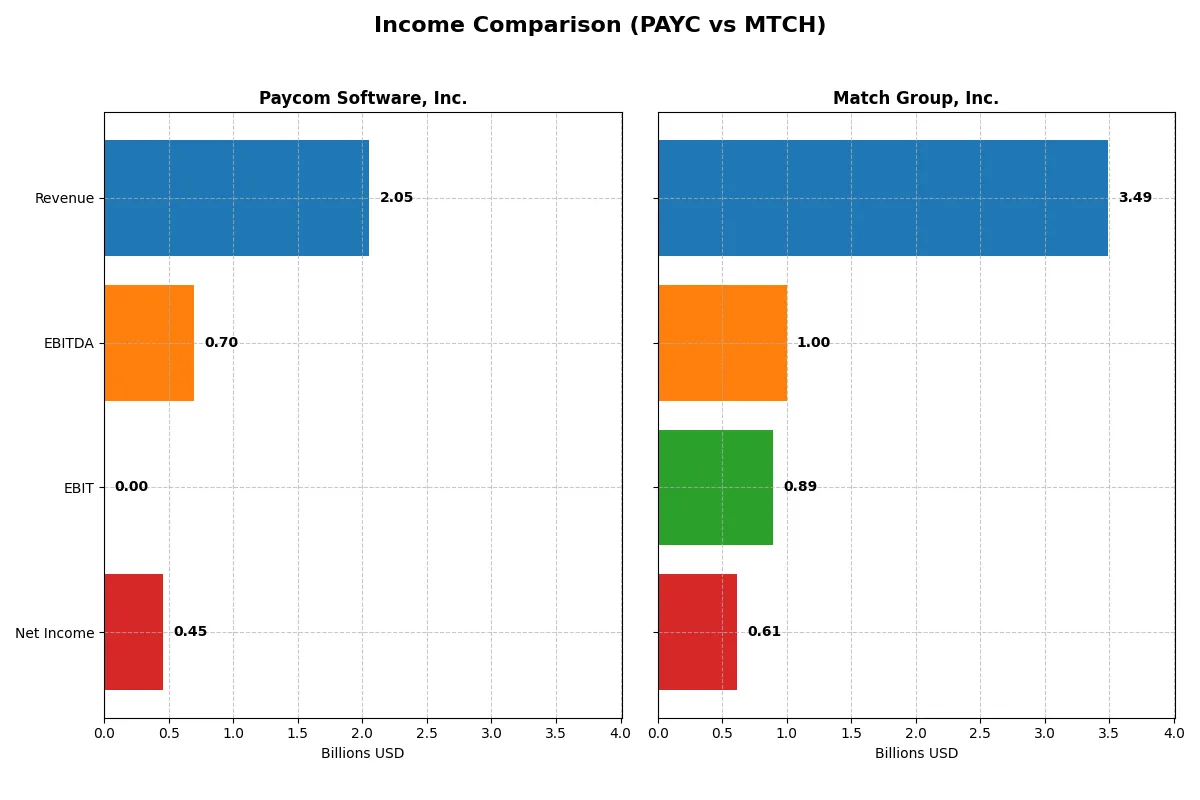
This table dissects the core profitability and scalability of Paycom Software, Inc. and Match Group, Inc. to reveal who dominates the bottom line:
| Metric | Paycom Software, Inc. (PAYC) | Match Group, Inc. (MTCH) |
|---|---|---|
| Revenue | 2.05B | 3.49B |
| Cost of Revenue | 345.4M | 948.4M |
| Operating Expenses | 1.05B | 1.67B |
| Gross Profit | 1.71B | 2.54B |
| EBITDA | 698.4M | 999.2M |
| EBIT | – | 893.6M |
| Interest Expense | 3.4M | 147.6M |
| Net Income | 453.4M | 613.4M |
| EPS | 8.13 | 2.53 |
| Fiscal Year | 2025 | 2025 |
Income Statement Analysis: The Bottom-Line Duel
This income statement comparison reveals which company operates with superior efficiency and profitability through recent fiscal trends.
Paycom Software, Inc. Analysis
Paycom’s revenue nearly doubled from 2021 to 2025, reaching $2.05B in 2025. Net income grew impressively to $453M despite a dip from the prior year’s $502M. Its gross margin remains robust at 83%, but the EBIT margin fell sharply, signaling operational challenges. The net margin of 22.1% still reflects solid profitability.
Match Group, Inc. Analysis
Match Group’s revenue grew modestly to $3.49B by 2025, with net income rising to $613M. Gross margin stands healthy at 72.8% and EBIT margin strong at 25.6%. The company improved net margin by 11% year-over-year to 17.6%. Earnings per share surged 18%, indicating efficient capital use and momentum.
Margin Strength vs. Scale and Momentum
Match Group leads with higher absolute revenue and superior EBIT margin, demonstrating efficient operations at scale. Paycom excels in gross margin and net margin but shows signs of margin pressure recently. For investors prioritizing steady margin strength and earnings momentum, Match Group’s profile appears more attractive.
Financial Ratios Comparison
These vital ratios act as a diagnostic tool to expose the underlying fiscal health, valuation premiums, and capital efficiency of the companies compared below:
| Ratios | Paycom Software, Inc. (PAYC) | Match Group, Inc. (MTCH) |
|---|---|---|
| ROE | 31.85% (2024) | -2.42% (2025) |
| ROIC | 24.86% (2024) | 18.50% (2025) |
| P/E | 22.95 (2024) | 12.77 (2025) |
| P/B | 7.31 (2024) | -30.91 (2025) |
| Current Ratio | 1.10 (2024) | 1.42 (2025) |
| Quick Ratio | 1.10 (2024) | 1.42 (2025) |
| D/E | 0.05 (2024) | -15.67 (2025) |
| Debt-to-Assets | 1.42% (2024) | 89.06% (2025) |
| Interest Coverage | 187 (2024) | 5.91 (2025) |
| Asset Turnover | 0.32 (2024) | 0.78 (2025) |
| Fixed Asset Turnover | 2.93 (2024) | 26.59 (2025) |
| Payout ratio | 16.89% (2024) | 30.36% (2025) |
| Dividend yield | 0.74% (2024) | 2.38% (2025) |
| Fiscal Year | 2024 | 2025 |
Efficiency & Valuation Duel: The Vital Signs
Financial ratios act as the company’s DNA, revealing hidden risks and operational excellence critical for investment decisions.
Paycom Software, Inc.
Paycom shows a strong net margin of 22.1%, highlighting profitable operations, but lacks return on equity and invested capital data, which raises caution. The stock trades at a neutral P/E of 19.6, suggesting fair valuation. Dividend yield is low at 0.95%, reflecting limited shareholder returns amid reinvestment in growth.
Match Group, Inc.
Match Group delivers a solid net margin of 17.6% and an impressive ROIC of 18.5%, signaling operational efficiency. Its P/E of 12.8 appears attractive compared to peers, indicating undervaluation. The company offers a 2.38% dividend yield, balancing income with a favorable capital structure and strong interest coverage.
Valuation Discipline vs. Operational Strength
Match Group outperforms Paycom in ratio favorability, combining efficient capital use with shareholder returns and a lower valuation multiple. Paycom’s profitability is robust but overshadowed by unanswered equity returns. Investors seeking balanced risk and reward may find Match Group’s profile more aligned with stable income and valuation discipline.
Which one offers the Superior Shareholder Reward?
I compare Paycom Software, Inc. (PAYC) and Match Group, Inc. (MTCH) on their shareholder return strategies. PAYC pays a modest dividend yield near 0.95% with a payout ratio around 18%, supported by strong free cash flow (FCF) coverage above 60%. Its buyback program is moderate but consistent, emphasizing sustainable capital allocation. MTCH offers a higher dividend yield of about 2.38%, but with a payout ratio over 30%, reflecting a more aggressive distribution approach. MTCH’s free cash flow conversion is robust at approximately 95%, fueling both dividends and a significant buyback effort. However, MTCH’s heavy debt load and negative equity raise concerns about long-term sustainability. I judge PAYC’s balanced dividend and buyback strategy more sustainable and attractive for total shareholder return in 2026, especially given its cleaner balance sheet and consistent FCF generation. PAYC offers superior risk-adjusted shareholder reward in this comparison.
Comparative Score Analysis: The Strategic Profile
The radar chart reveals the fundamental DNA and trade-offs of Paycom Software, Inc. and Match Group, Inc., highlighting their financial strengths and vulnerabilities:
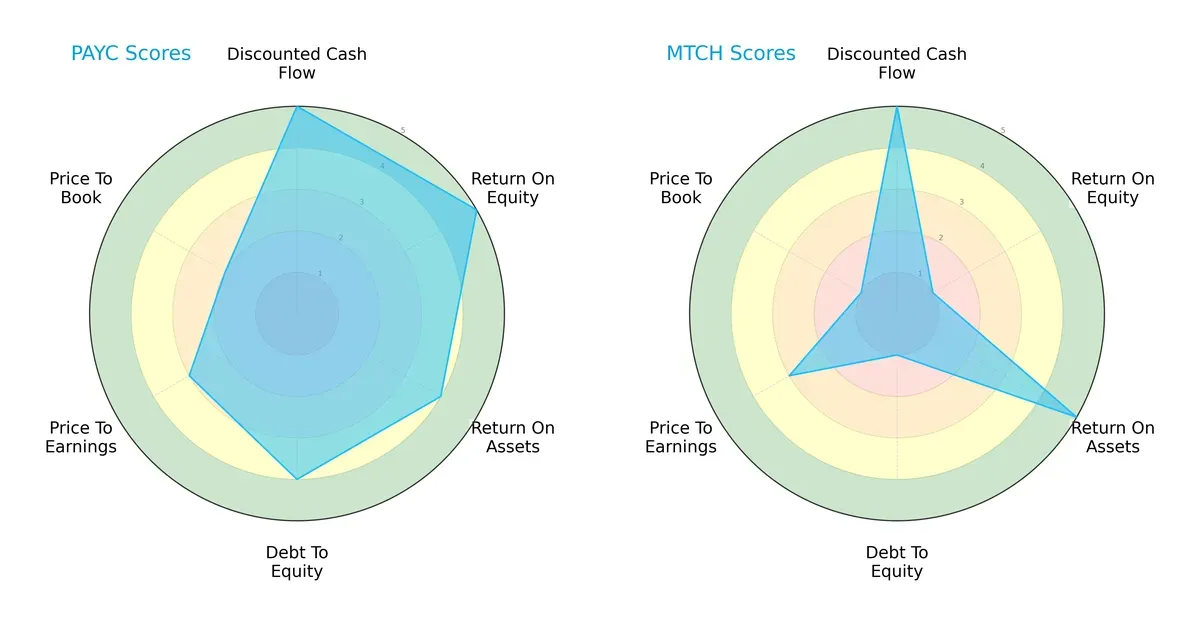
Paycom shows a balanced profile with top scores in ROE (5) and DCF (5), reflecting strong profitability and cash flow. Match Group excels in ROA (5) and DCF (5) but suffers from low ROE (1) and high debt risk (Debt/Equity score 1). Paycom’s moderate valuation scores indicate some premium pricing, while Match Group appears undervalued but riskier due to leverage. Overall, Paycom presents a steadier, well-rounded financial position, whereas Match relies on asset efficiency but faces solvency concerns.
Bankruptcy Risk: Solvency Showdown
Paycom’s Altman Z-Score of 9.07 versus Match’s 0.63 signals a stark contrast in bankruptcy risk:
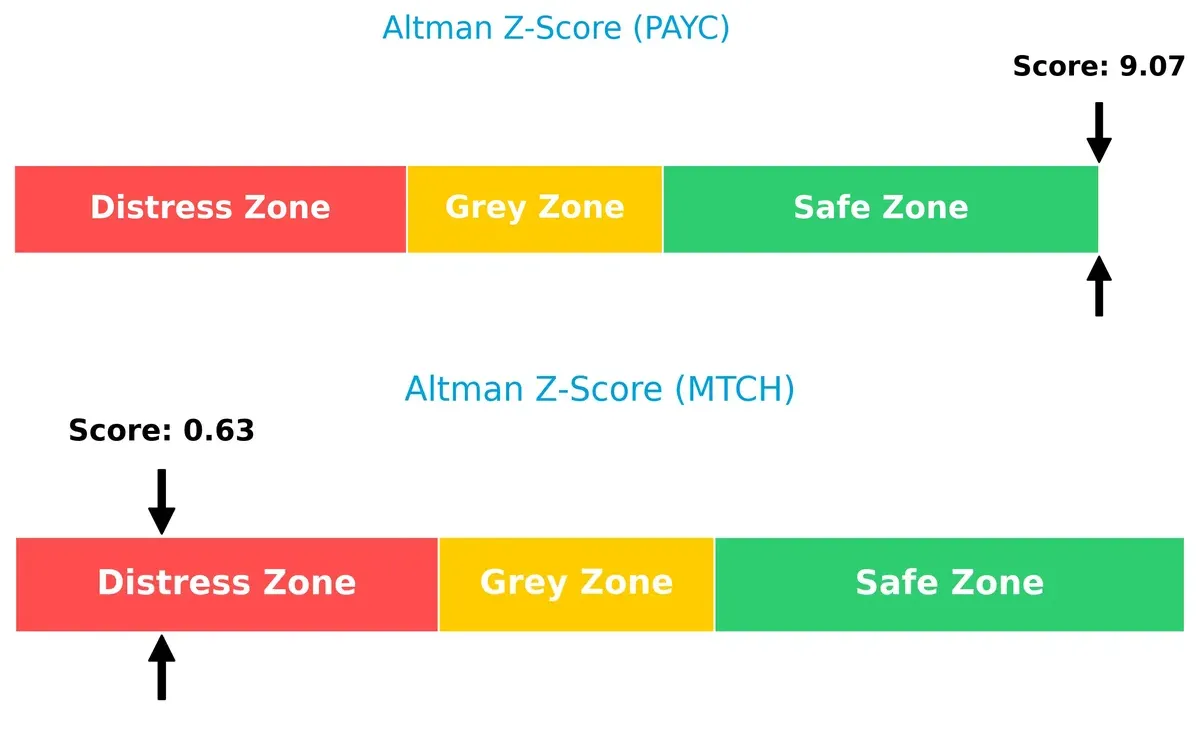
Paycom resides comfortably in the safe zone, indicating robust financial health and minimal default risk. Match Group’s score places it deep in the distress zone, warning investors of significant solvency challenges in this market cycle. This gap underscores Paycom’s superior balance sheet strength and crisis resilience.
Financial Health: Quality of Operations
Paycom’s Piotroski F-Score of 7 versus Match’s 8 highlights nuanced differences in operational quality:
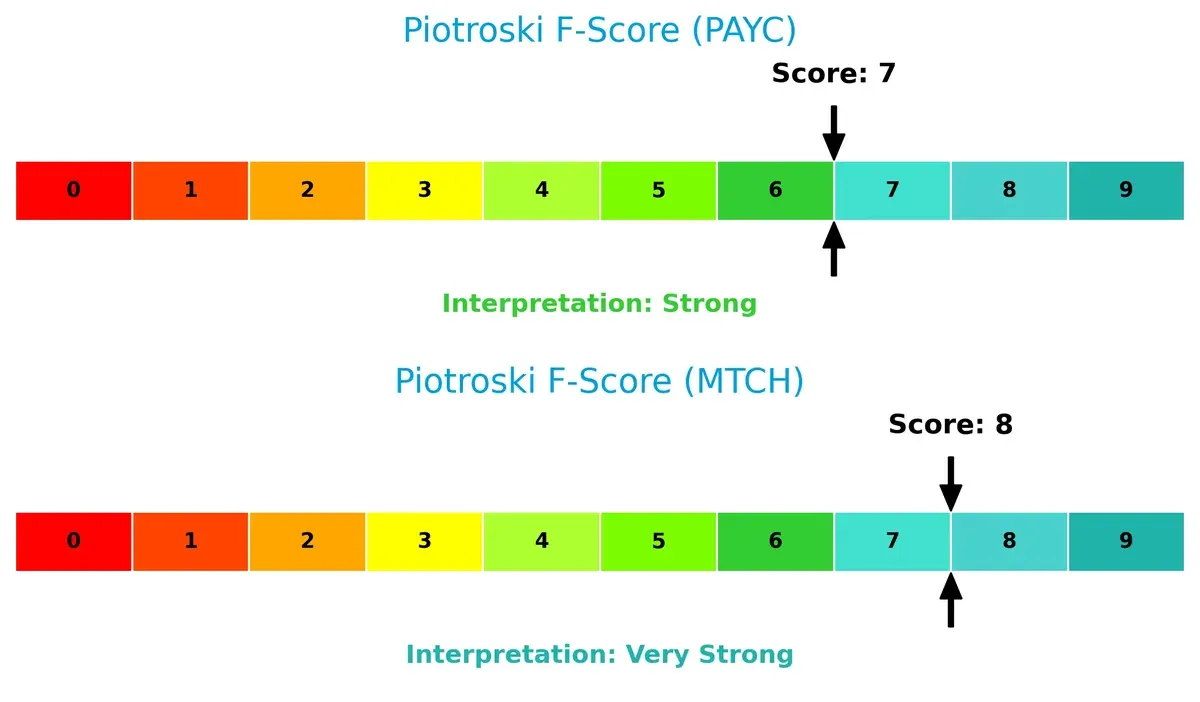
Both companies demonstrate strong financial health, but Match edges out slightly with a very strong score, reflecting excellent profitability and efficiency metrics. Paycom’s strong score is solid but suggests room for improvement in internal fundamentals. Neither company shows immediate red flags, though Match’s distress-zone Z-score warrants caution despite operational strength.
How are the two companies positioned?
This section dissects the operational DNA of Paycom and Match Group by comparing their revenue distribution and internal dynamics. The goal is to confront their economic moats and identify which model offers the most resilient competitive advantage today.
Revenue Segmentation: The Strategic Mix
This visual comparison dissects how Paycom Software, Inc. and Match Group, Inc. diversify their income streams and where their primary sector bets lie:
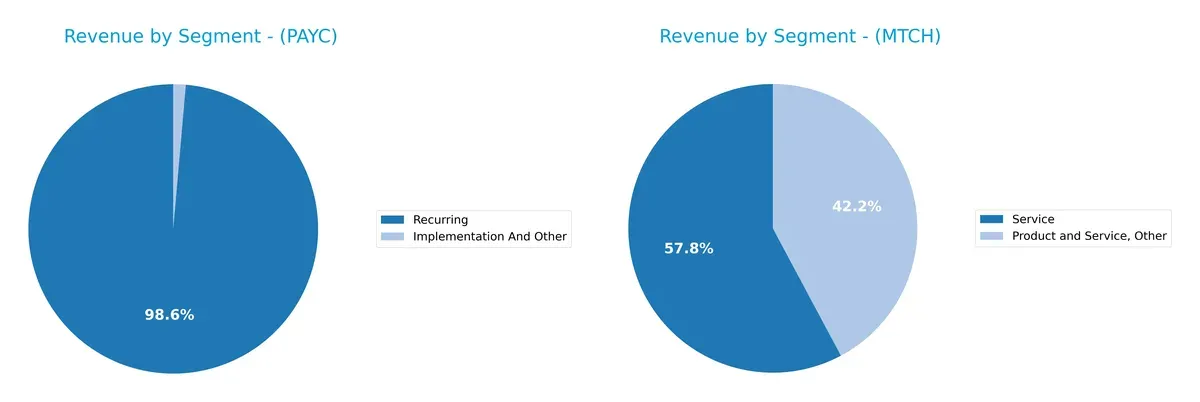
Paycom anchors its revenue in a highly concentrated model: $1.73B in Recurring versus just $24M in Implementation and Other for 2024. Match Group shows a more fragmented mix across segments, with $2B in Match Group revenue in 2019 and substantial contributions from Product and Service, Other ($989M) and Service ($1.36B) in 2020. Paycom’s focus on recurring revenue reduces volatility but risks customer churn, while Match’s diversified portfolio supports resilience but demands broader operational focus.
Strengths and Weaknesses Comparison
This table compares the strengths and weaknesses of Paycom Software, Inc. and Match Group, Inc.:
Paycom Software, Inc. Strengths
- High net margin of 22.1%
- Favorable debt-to-assets ratio at 0%
- Strong recurring revenue stream over $1.7B
- Low debt levels support financial stability
Match Group, Inc. Strengths
- Favorable ROIC of 18.5% indicating efficient capital use
- Solid net margin of 17.6%
- Diverse revenue streams exceeding $3B total
- Global presence with significant non-US revenue near $1.9B
- Strong interest coverage ratio of 6.06
Paycom Software, Inc. Weaknesses
- Unfavorable ROE and ROIC at 0%
- Poor liquidity ratios with current and quick ratios at 0
- Negative interest coverage
- Unfavorable asset turnover and fixed asset turnover
- Dividend yield considered low at 0.95%
Match Group, Inc. Weaknesses
- Negative ROE at -241.99% signals profitability issues
- High debt-to-assets ratio of 89.1% raises leverage concerns
- Moderate current ratio at 1.42 neutral for liquidity
- Negative PB ratio and volatile equity metrics
Both companies exhibit clear financial strengths but also distinct weaknesses. Paycom excels in profitability and low leverage but struggles with liquidity and returns. Match Group shows strong capital efficiency and global diversification but faces high leverage and negative equity returns. These factors shape strategic priorities around improving financial health and sustaining growth.
The Moat Duel: Analyzing Competitive Defensibility
A structural moat remains the only true shield preventing long-term profits from relentless competition erosion:
Paycom Software, Inc.: Intangible Asset Powerhouse
Paycom’s moat stems from its comprehensive, integrated HCM platform, creating high switching costs. Margins remain robust, but a declining ROIC trend signals looming risks to its competitive edge in 2026.
Match Group, Inc.: Network Effects Dominator
Match Group commands a global dating ecosystem fueled by strong network effects, sustaining solid margins and value creation. Despite a modest ROIC decline, international expansion offers avenues to deepen its moat.
Moat Battle: Intangible Assets vs. Network Effects
Match Group’s wider moat leverages network effects and global scale, enabling stronger value creation than Paycom’s intangible assets. Match is better positioned to defend market share amid intensifying competition.
Which stock offers better returns?
The past year shows clear downward momentum in both stocks, with Paycom Software, Inc. facing sharper declines and Match Group, Inc. experiencing a more moderate decrease in price.
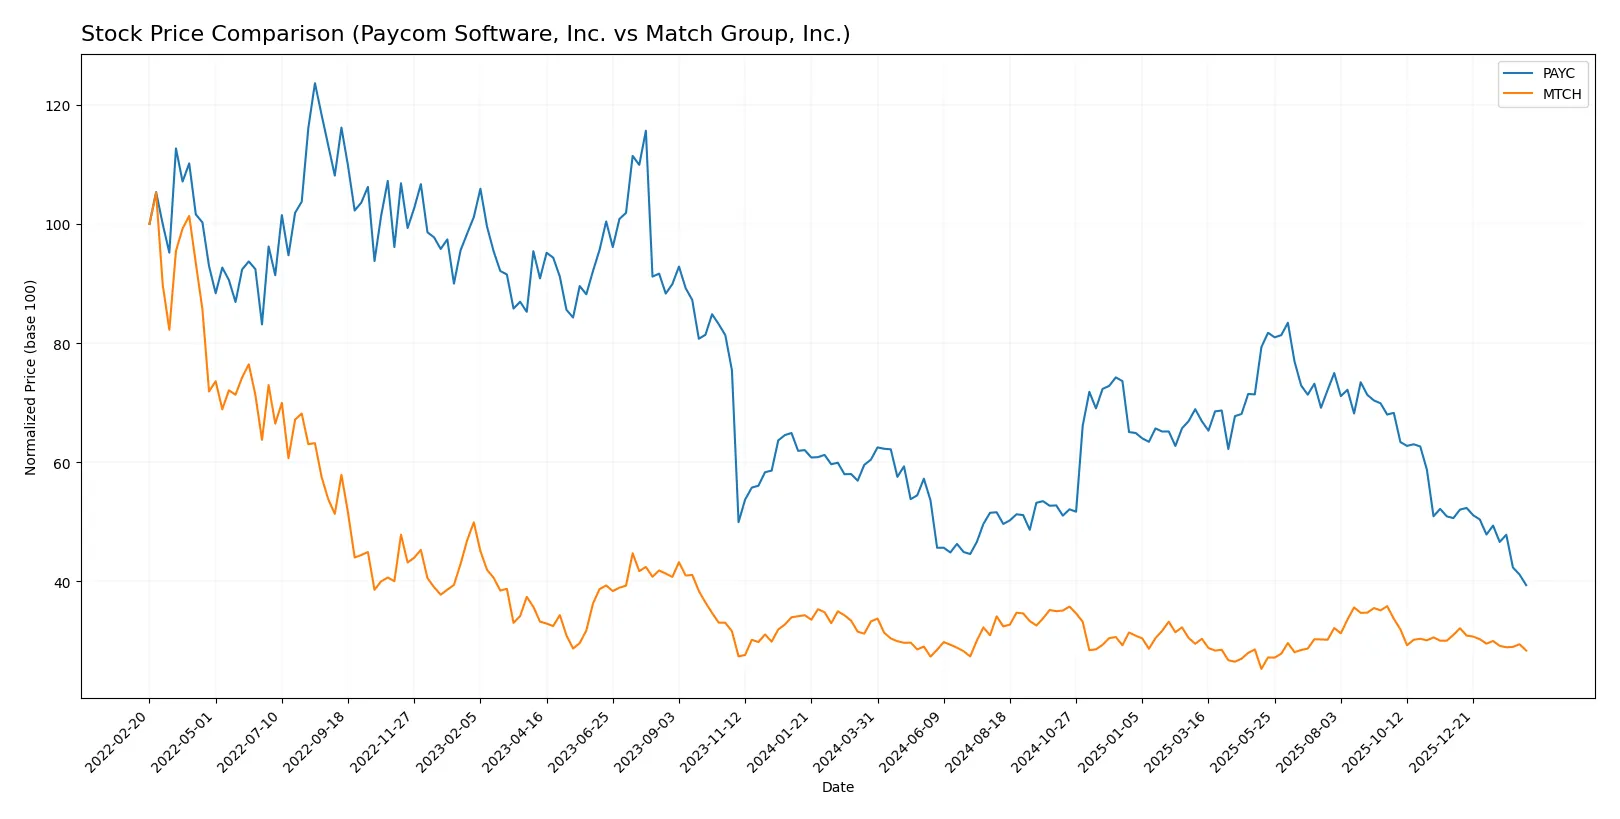
Trend Comparison
Paycom Software, Inc. declined 34.89% over the past 12 months, reflecting a bearish trend with decelerating losses and high volatility, hitting a low of 125.31 from a high of 265.71.
Match Group, Inc. fell 14.69% in the same period, also bearish but with decelerating declines and lower volatility, trading between 27.18 and 38.51.
Match Group’s stock outperformed Paycom’s, delivering a smaller loss and more stable price action over the year.
Target Prices
Analysts present a moderate upside consensus for both Paycom Software and Match Group.
| Company | Target Low | Target High | Consensus |
|---|---|---|---|
| Paycom Software, Inc. | 115 | 210 | 151.82 |
| Match Group, Inc. | 33 | 43 | 36 |
Paycom’s consensus target at $151.82 suggests a 21% upside from its $125.31 price, signaling confidence in its growth. Match Group’s $36 target also implies a roughly 18% gain versus its current $30.50, reflecting cautious optimism.

Don’t Let Luck Decide Your Entry Point
Optimize your entry points with our advanced ProRealTime indicators. You’ll get efficient buy signals with precise price targets for maximum performance. Start outperforming now!
How do institutions grade them?
Institutional grade assessments for Paycom Software, Inc. and Match Group, Inc. are as follows:
Paycom Software, Inc. Grades
Below is a summary of recent institutional grades for Paycom Software, Inc.
| Grading Company | Action | New Grade | Date |
|---|---|---|---|
| Citigroup | Maintain | Neutral | 2026-02-13 |
| BMO Capital | Maintain | Market Perform | 2026-02-12 |
| Guggenheim | Maintain | Buy | 2026-02-12 |
| Keybanc | Maintain | Overweight | 2026-02-12 |
| Mizuho | Maintain | Neutral | 2026-02-12 |
| BTIG | Maintain | Buy | 2026-02-12 |
| Barclays | Maintain | Equal Weight | 2026-02-12 |
| Jefferies | Maintain | Hold | 2026-02-12 |
| Cantor Fitzgerald | Maintain | Neutral | 2026-02-12 |
| Cantor Fitzgerald | Maintain | Neutral | 2026-01-29 |
Match Group, Inc. Grades
The table below shows recent grades issued by institutions for Match Group, Inc.
| Grading Company | Action | New Grade | Date |
|---|---|---|---|
| TD Cowen | Maintain | Buy | 2026-02-05 |
| JP Morgan | Maintain | Neutral | 2026-02-04 |
| Truist Securities | Maintain | Hold | 2026-02-04 |
| Morgan Stanley | Maintain | Equal Weight | 2026-01-13 |
| Wells Fargo | Maintain | Equal Weight | 2025-11-05 |
| Evercore ISI Group | Maintain | In Line | 2025-11-05 |
| Truist Securities | Maintain | Hold | 2025-11-05 |
| Morgan Stanley | Maintain | Equal Weight | 2025-10-20 |
| Susquehanna | Maintain | Positive | 2025-08-07 |
| Evercore ISI Group | Maintain | In Line | 2025-08-06 |
Which company has the best grades?
Paycom Software, Inc. generally receives higher grades, including multiple Buy and Overweight ratings. Match Group, Inc. maintains mostly Neutral, Hold, and Equal Weight grades. This suggests Paycom may be viewed more favorably by analysts, potentially influencing investor confidence.
Risks specific to each company
The following categories identify the critical pressure points and systemic threats facing both firms in the 2026 market environment:
1. Market & Competition
Paycom Software, Inc.
- Faces intense competition in cloud-based HCM with pressure from larger SaaS providers.
Match Group, Inc.
- Operates in a highly competitive online dating market with constant innovation demands.
2. Capital Structure & Debt
Paycom Software, Inc.
- Exhibits a strong balance sheet with low debt, reducing financial risk.
Match Group, Inc.
- High debt-to-assets ratio at 89%, raising concerns about leverage and solvency.
3. Stock Volatility
Paycom Software, Inc.
- Low beta (0.79) indicates lower stock volatility versus the market.
Match Group, Inc.
- Higher beta (1.31) signals greater stock price fluctuations and market sensitivity.
4. Regulatory & Legal
Paycom Software, Inc.
- Subject to data privacy and employment law compliance risks in the US market.
Match Group, Inc.
- Faces regulatory scrutiny on user data privacy and content moderation globally.
5. Supply Chain & Operations
Paycom Software, Inc.
- Relies on cloud infrastructure; operational risks tied to service uptime and security.
Match Group, Inc.
- Dependent on stable platform operations and user engagement to maintain revenue flow.
6. ESG & Climate Transition
Paycom Software, Inc.
- Limited direct climate impact but faces pressure to enhance diversity and governance.
Match Group, Inc.
- Increasing ESG focus on data ethics and social responsibility in digital platforms.
7. Geopolitical Exposure
Paycom Software, Inc.
- Primarily US-focused with minimal geopolitical risk.
Match Group, Inc.
- Global footprint exposes it to regulatory and political risks in multiple jurisdictions.
Which company shows a better risk-adjusted profile?
The biggest risk for Paycom lies in operational vulnerabilities tied to cloud service stability and compliance. Match Group’s critical risk is its heavy leverage, threatening financial flexibility amid market volatility. Despite Match’s stronger profitability metrics, Paycom’s safer balance sheet and lower stock volatility give it a superior risk-adjusted profile. Notably, Match’s Altman Z-Score places it in the distress zone, sharply contrasting Paycom’s robust safe zone score. This underlines my concern about Match’s debt burden and financial health in 2026.
Final Verdict: Which stock to choose?
Paycom Software, Inc. (PAYC) excels as a cash-generating engine with a proven ability to sustain high net margins and robust free cash flows. Its main point of vigilance lies in the recent erosion of operating returns, signaling potential challenges in capital efficiency. PAYC fits portfolios seeking aggressive growth with a focus on operational leverage.
Match Group, Inc. (MTCH) boasts a strategic moat rooted in its dominant digital ecosystem and recurring revenue streams. It offers better financial stability and a favorable capital structure compared to PAYC, despite its heavy intangible asset base. MTCH suits investors prioritizing growth at a reasonable price with a tilt toward income and resilience.
If you prioritize aggressive operational efficiency and cash flow expansion, PAYC is the compelling choice due to its strong margin profile and cash conversion. However, if you seek a more stable growth story backed by a durable competitive moat and safer balance sheet, MTCH offers better stability and a proven value-creating track record.
Disclaimer: Investment carries a risk of loss of initial capital. The past performance is not a reliable indicator of future results. Be sure to understand risks before making an investment decision.
Go Further
I encourage you to read the complete analyses of Paycom Software, Inc. and Match Group, Inc. to enhance your investment decisions: