Investors seeking growth opportunities in the technology sector often face tough choices between innovative companies with distinct market approaches. Match Group, Inc. (MTCH) dominates the global online dating scene with a diverse brand portfolio, while PagerDuty, Inc. (PD) leads in digital operations management using advanced machine learning. Both operate within software applications but serve different core needs, making their comparison essential. In this article, I will analyze which company presents the most compelling investment case for your portfolio.

Table of contents
Companies Overview
I will begin the comparison between Match Group and PagerDuty by providing an overview of these two companies and their main differences.
Match Group Overview
Match Group, Inc. operates globally in the online dating industry, offering a diverse portfolio of brands such as Tinder, Match, and OkCupid. Founded in 1986 and headquartered in Dallas, Texas, the company focuses on connecting people through technology-driven dating products. It is a significant player in the software application sector with a market cap of approximately 7.4B USD.
PagerDuty Overview
PagerDuty, Inc. provides a digital operations management platform that leverages machine learning to monitor and predict issues across software systems. Founded in 2009 and based in San Francisco, California, it serves multiple industries including technology, retail, and financial services. The company has a market cap near 1B USD and specializes in software applications for operational intelligence.
Key similarities and differences
Both companies operate in the software application industry and focus on technology-driven solutions, but their markets differ significantly. Match Group targets consumer dating services worldwide, while PagerDuty focuses on enterprise digital operations management across various industries. Additionally, Match Group has a substantially larger market capitalization and a longer operational history compared to PagerDuty.
Income Statement Comparison
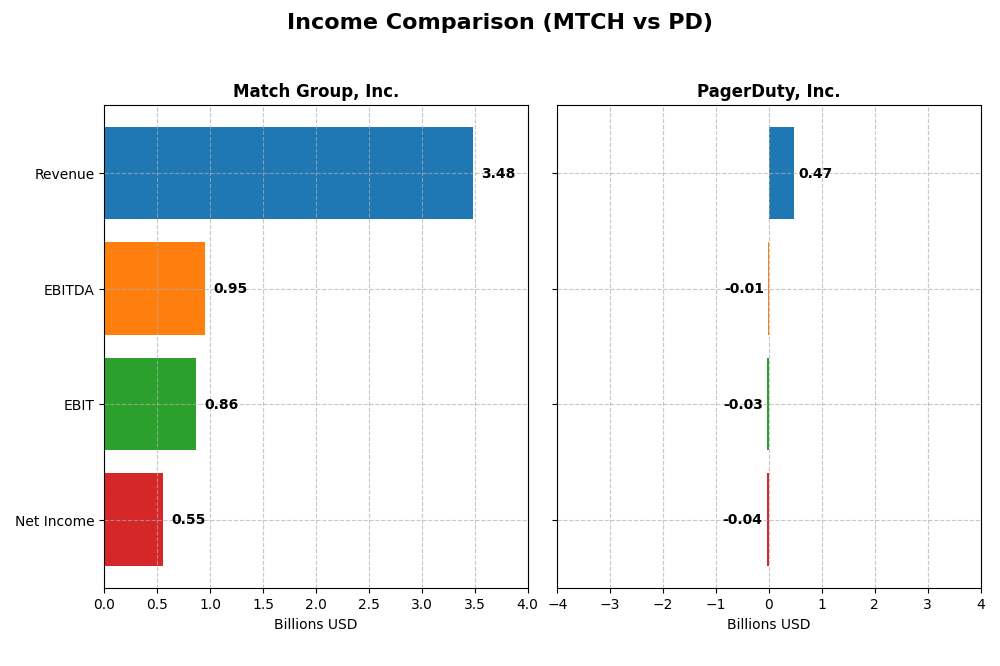
This table compares the key income statement metrics for Match Group, Inc. and PagerDuty, Inc. based on their most recent fiscal year results.
| Metric | Match Group, Inc. (MTCH) | PagerDuty, Inc. (PD) |
|---|---|---|
| Market Cap | 7.4B | 1.0B |
| Revenue | 3.48B | 467.5M |
| EBITDA | 952M | -11.9M |
| EBIT | 864M | -32.5M |
| Net Income | 551.3M | -42.7M |
| EPS | 2.12 | -0.59 |
| Fiscal Year | 2024 | 2025 |
Income Statement Interpretations
Match Group, Inc.
Match Group’s revenue rose steadily from $2.39B in 2020 to $3.48B in 2024, showing a favorable 45.5% growth over five years. Net income surged even more, up 240% over the period, though it declined 15.8% margin-wise in the latest year. The 2024 performance shows moderate revenue growth of 3.4% but weaker EBIT and net margin, signaling margin pressures despite strong top-line expansion.
PagerDuty, Inc.
PagerDuty’s revenue expanded impressively from $213M in 2021 to $467M in 2025, an overall growth of 119%. Despite this, the company is still unprofitable, with negative net margins improving from -40.6% in 2021 to -9.1% in 2025. The latest year saw an 8.5% revenue increase and significant EBIT improvement, reflecting operational leverage gains, though profitability remains elusive.
Which one has the stronger fundamentals?
Match Group exhibits stronger fundamentals with positive net margins, substantial net income growth, and stable gross margins around 71.5%. PagerDuty shows impressive revenue growth and operational improvements but remains unprofitable with negative margins. While both have favorable income statement trends, Match Group’s consistent profitability and margin stability present a more robust financial foundation.
Financial Ratios Comparison
The following table presents a side-by-side comparison of key financial ratios for Match Group, Inc. (MTCH) and PagerDuty, Inc. (PD), based on their most recent fiscal year data.
| Ratios | Match Group, Inc. (2024) | PagerDuty, Inc. (2025) |
|---|---|---|
| ROE | -8.66% | -32.92% |
| ROIC | 16.38% | -9.66% |
| P/E | 15.44 | -39.87 |
| P/B | -133.75 | 13.12 |
| Current Ratio | 2.54 | 1.87 |
| Quick Ratio | 2.54 | 1.87 |
| D/E (Debt to Equity) | -62.09 | 3.57 |
| Debt-to-Assets | 88.51% | 50.00% |
| Interest Coverage | 5.14 | -6.46 |
| Asset Turnover | 0.78 | 0.50 |
| Fixed Asset Turnover | 22.00 | 16.61 |
| Payout Ratio | 0 | 0 |
| Dividend Yield | 0% | 0% |
Interpretation of the Ratios
Match Group, Inc.
Match Group shows generally favorable financial ratios, including a strong net margin of 15.84% and a robust return on invested capital at 16.38%, despite a notably negative return on equity of -865.98%. Its liquidity is solid, with a current ratio of 2.54 and favorable interest coverage of 5.4. The company pays dividends, but with a zero dividend yield, indicating limited shareholder returns currently.
PagerDuty, Inc.
PagerDuty exhibits mostly unfavorable ratios, including a negative net margin of -9.14%, negative ROE of -32.92%, and poor interest coverage at -3.51, reflecting operational challenges. Liquidity ratios are acceptable, with a current ratio of 1.87. The company does not pay dividends, likely due to its negative profitability and focus on reinvestment and growth.
Which one has the best ratios?
Match Group holds the advantage with a majority of favorable ratios, solid profitability, and strong liquidity metrics, despite concerns about return on equity. PagerDuty’s financials are weaker overall, with multiple unfavorable profitability and leverage ratios, reflecting higher risk and operational difficulties in comparison.
Strategic Positioning
This section compares the strategic positioning of Match Group, Inc. and PagerDuty, Inc. across market position, key segments, and exposure to technological disruption:
Match Group, Inc.
- Leading dating app provider with strong market cap and competitive pressure in consumer software.
- Focused on dating products including Tinder, Match, and others, driving revenue from service and product sales.
- Exposure tied to evolving consumer behavior in dating apps, limited info on specific technological disruption.
PagerDuty, Inc.
- Digital operations management platform with smaller market cap, competing in enterprise software.
- Serves multiple industries with machine learning-powered digital operations management platform.
- Uses machine learning for predictive analytics, facing ongoing technological evolution in digital operations.
Match Group, Inc. vs PagerDuty, Inc. Positioning
Match Group maintains a concentrated focus on dating apps with established brands driving revenue, while PagerDuty offers a diversified platform across industries leveraging machine learning. Match Group’s position benefits from scale, whereas PagerDuty’s exposure spans multiple sectors, adding variety but also complexity.
Which has the best competitive advantage?
Match Group shows a slightly favorable moat with value creation despite declining profitability, indicating a sustainable competitive advantage. PagerDuty’s moat is slightly unfavorable, with value destruction but improving profitability, suggesting a weaker but potentially growing advantage.
Stock Comparison
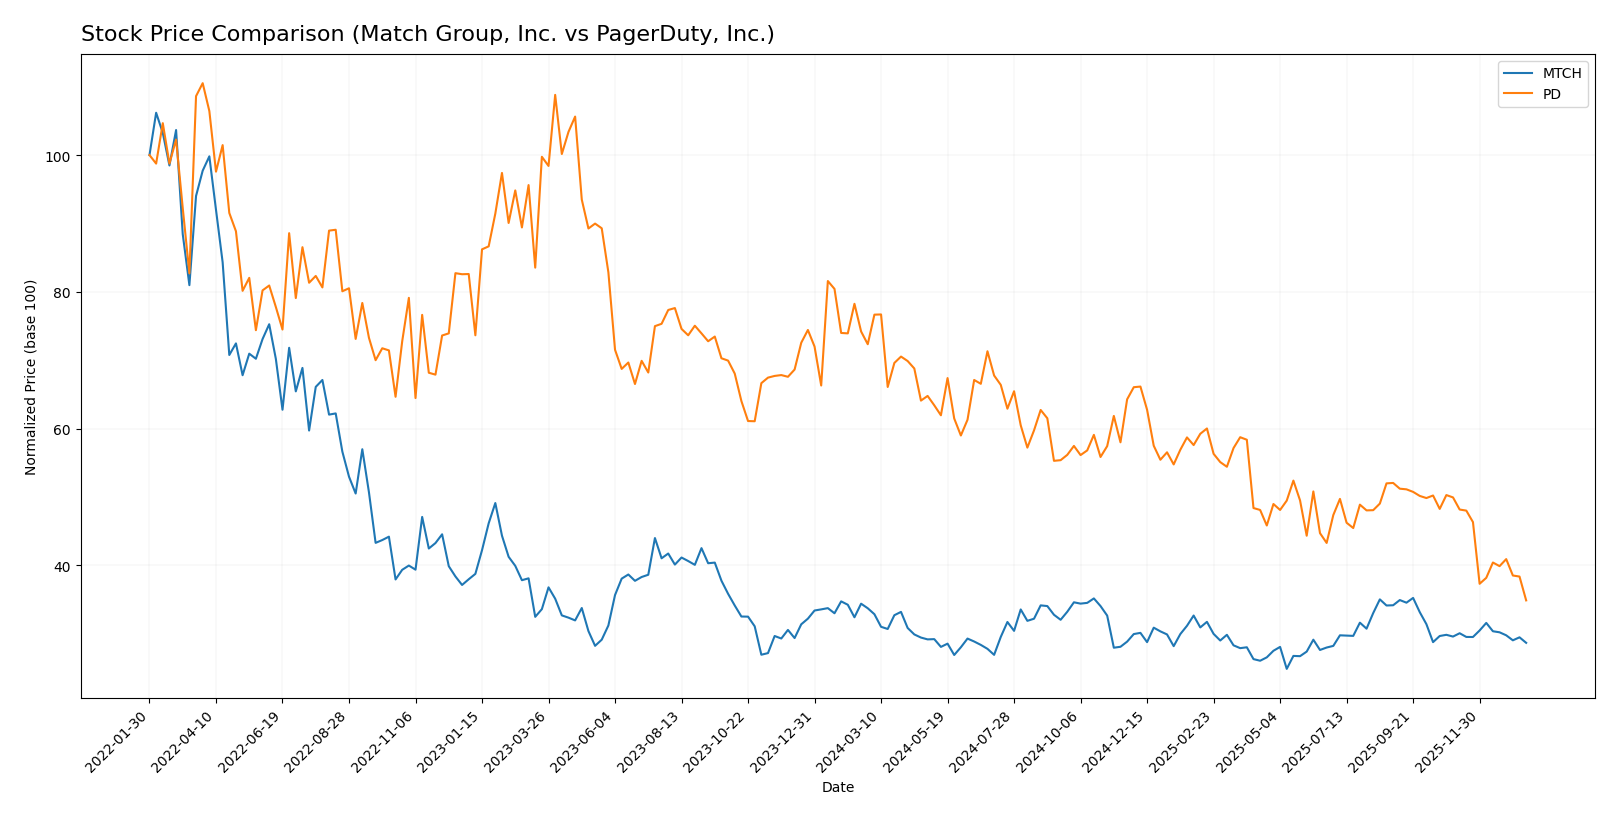
The past 12 months reveal a clear bearish trend for both Match Group, Inc. (MTCH) and PagerDuty, Inc. (PD), with significant price declines and decelerating downward momentum, alongside contrasting volume dynamics.
Trend Analysis
Match Group’s stock declined by 14.98% over the past year, indicating a bearish trend with decelerating negative momentum. The price ranged from a high of 38.51 to a low of 27.18, with moderate volatility (2.64 std deviation).
PagerDuty’s stock showed a sharper 51.76% decrease over the same period, confirming a bearish trend with deceleration. Prices fluctuated between 24.66 and 11.22 with slightly higher volatility (2.92 std deviation).
Comparing the two, Match Group delivered a less severe market performance decline than PagerDuty, which experienced the more pronounced bearish trend among the two stocks.
Target Prices
The current consensus target prices indicate cautious optimism from analysts for Match Group, Inc. and PagerDuty, Inc.
| Company | Target High | Target Low | Consensus |
|---|---|---|---|
| Match Group, Inc. | 43 | 33 | 36.29 |
| PagerDuty, Inc. | 19 | 15 | 16.2 |
Analysts expect Match Group’s stock to modestly outpace its current price of 31.34 USD, while PagerDuty’s consensus target suggests a significant upside from its current price of 11.22 USD.
Analyst Opinions Comparison
This section compares analysts’ ratings and grades for Match Group, Inc. and PagerDuty, Inc.:
Rating Comparison
Match Group Rating
- Rating: B, classified as Very Favorable by analysts.
- Discounted Cash Flow Score: 5, indicating very favorable valuation based on future cash flows.
- ROE Score: 1, indicating very unfavorable efficiency in generating profit from equity.
- ROA Score: 5, very favorable use of assets to generate earnings.
- Debt To Equity Score: 1, very unfavorable financial leverage.
- Overall Score: 3, classified as moderate overall financial standing.
PagerDuty Rating
- Rating: A-, classified as Very Favorable by analysts.
- Discounted Cash Flow Score: 5, also very favorable valuation.
- ROE Score: 5, very favorable efficiency in generating profit.
- ROA Score: 5, also very favorable asset utilization.
- Debt To Equity Score: 1, also very unfavorable financial leverage.
- Overall Score: 4, classified as favorable overall financial standing.
Which one is the best rated?
Based strictly on the provided data, PagerDuty has a higher overall score of 4 compared to Match Group’s 3, and stronger profitability metrics with ROE and ROA scores at 5 versus Match Group’s 1 and 5 respectively, making PagerDuty the better rated company.
Scores Comparison
Here is a comparison of the Altman Z-Score and Piotroski Score for Match Group, Inc. and PagerDuty, Inc.:
Match Group, Inc. Scores
- Altman Z-Score: 0.52, in distress zone indicating high bankruptcy risk.
- Piotroski Score: 8, very strong financial health and value potential.
PagerDuty, Inc. Scores
- Altman Z-Score: 1.26, also in distress zone with elevated bankruptcy risk.
- Piotroski Score: 7, strong financial health but slightly lower than Match Group.
Which company has the best scores?
Match Group shows a lower Altman Z-Score, implying higher bankruptcy risk than PagerDuty, but has a higher Piotroski Score indicating stronger financial health. PagerDuty’s scores indicate distress but slightly less risk of bankruptcy.
Grades Comparison
The grades comparison for Match Group, Inc. and PagerDuty, Inc. is as follows:
Match Group, Inc. Grades
The following table summarizes recent grades issued by verified grading companies for Match Group, Inc.:
| Grading Company | Action | New Grade | Date |
|---|---|---|---|
| Morgan Stanley | Maintain | Equal Weight | 2026-01-13 |
| Truist Securities | Maintain | Hold | 2025-11-05 |
| Evercore ISI Group | Maintain | In Line | 2025-11-05 |
| Wells Fargo | Maintain | Equal Weight | 2025-11-05 |
| Morgan Stanley | Maintain | Equal Weight | 2025-10-20 |
| Susquehanna | Maintain | Positive | 2025-08-07 |
| Evercore ISI Group | Maintain | In Line | 2025-08-06 |
| JP Morgan | Maintain | Neutral | 2025-08-06 |
| UBS | Maintain | Neutral | 2025-07-23 |
| Wells Fargo | Maintain | Equal Weight | 2025-06-27 |
Match Group’s grades predominantly indicate a stable outlook with consistent “Equal Weight,” “Hold,” and neutral ratings from leading financial institutions.
PagerDuty, Inc. Grades
The following table summarizes recent grades issued by verified grading companies for PagerDuty, Inc.:
| Grading Company | Action | New Grade | Date |
|---|---|---|---|
| Truist Securities | Maintain | Buy | 2026-01-07 |
| RBC Capital | Downgrade | Sector Perform | 2026-01-05 |
| TD Cowen | Maintain | Buy | 2025-11-26 |
| Craig-Hallum | Downgrade | Hold | 2025-11-26 |
| Morgan Stanley | Maintain | Equal Weight | 2025-11-26 |
| RBC Capital | Maintain | Outperform | 2025-11-26 |
| Truist Securities | Maintain | Buy | 2025-11-19 |
| Baird | Maintain | Neutral | 2025-09-04 |
| RBC Capital | Maintain | Outperform | 2025-09-04 |
| Canaccord Genuity | Maintain | Buy | 2025-09-04 |
PagerDuty’s ratings show a mix of Buy and Hold opinions with some recent downgrades, reflecting a somewhat more varied analyst sentiment.
Which company has the best grades?
Match Group, Inc. has a consensus “Buy” with more stable “Hold” and “Equal Weight” grades, while PagerDuty, Inc. shows a consensus “Hold” with more mixed ratings including downgrades. Investors might interpret Match Group’s consistent grades as lower short-term uncertainty compared to PagerDuty’s variable outlook.
Strengths and Weaknesses
Below is a comparative table highlighting key strengths and weaknesses of Match Group, Inc. (MTCH) and PagerDuty, Inc. (PD) based on the latest financial and strategic data.
| Criterion | Match Group, Inc. (MTCH) | PagerDuty, Inc. (PD) |
|---|---|---|
| Diversification | Moderate, primarily focused on dating services with some additional segments | Limited product diversification, mainly incident management software |
| Profitability | Strong net margin (15.8%), positive ROIC (16.4%), but declining ROIC trend | Negative net margin (-9.1%), negative ROIC (-9.7%), but improving ROIC trend |
| Innovation | Consistent investment in product and service innovation, stable market presence | Growing innovation with improving ROIC, but still value destructive overall |
| Global presence | Broad international footprint, significant market share in dating apps | Smaller global footprint, focused niche market |
| Market Share | Leading position in online dating market | Emerging player in digital operations management |
Key takeaways: Match Group exhibits strong profitability and market leadership but faces a declining return on invested capital, signaling caution. PagerDuty, while currently unprofitable and value destructive, shows signs of improving efficiency and innovation, suggesting potential growth if trends continue. Risk management favors MTCH for stability but invites monitoring PD’s turnaround.
Risk Analysis
Below is a summary table of key risks for Match Group, Inc. (MTCH) and PagerDuty, Inc. (PD) based on the most recent financial data and market conditions:
| Metric | Match Group, Inc. (MTCH) | PagerDuty, Inc. (PD) |
|---|---|---|
| Market Risk | Beta 1.33 indicates above-average volatility; exposure to competitive tech sector risks | Beta 0.63 shows lower volatility but sensitive to tech market shifts |
| Debt Level | High debt-to-assets at 88.5%, unfavorable leverage poses financial risk | Moderate debt-to-assets at 50%, but unfavorable debt-to-equity ratio (3.57) |
| Regulatory Risk | Moderate, due to global dating platform operations and data privacy laws | Moderate, with international operations requiring compliance in multiple jurisdictions |
| Operational Risk | Dependence on continuous user engagement; platform innovation critical | Platform reliability and machine learning accuracy are key operational challenges |
| Environmental Risk | Low direct exposure; technology sector generally less impacted | Low direct exposure; focus on digital operations limits environmental footprint |
| Geopolitical Risk | Moderate, with some exposure via international user base and data regulations | Moderate, as client base includes global industries sensitive to geopolitical shifts |
The most impactful risks are Match Group’s high leverage, which could strain finances if market conditions worsen, and PagerDuty’s negative profitability combined with unfavorable debt metrics, suggesting operational and financial challenges that investors should monitor closely.
Which Stock to Choose?
Match Group, Inc. (MTCH) shows a favorable income statement with a 15.84% net margin and solid revenue growth of 45.5% over five years. Its financial ratios are mostly favorable, including a strong return on invested capital (16.38%) above WACC (7.93%), indicating value creation despite a declining ROIC trend. MTCH holds a very favorable rating (B) but exhibits some concerns with negative return on equity and high debt-to-assets ratio.
PagerDuty, Inc. (PD) posts a mixed income profile with an 8.54% revenue growth and improving margins, though the net margin remains negative at -9.14%. Financial ratios are predominantly unfavorable, with negative returns on equity and invested capital, and a debt level that raises caution. PD’s ROIC is below WACC, signaling value destruction, but with a slightly improving trend. Its overall rating is very favorable (A-), supported by strong ROE and ROA scores.
For investors prioritizing stable value creation and a strong economic moat, Match Group’s favorable global financial ratios and income statement might appear more reassuring. Conversely, those focused on growth potential and improving profitability could interpret PagerDuty’s improving income trends and higher rating as promising, despite current financial challenges. The choice could depend on the investor’s risk tolerance and strategic focus.
Disclaimer: Investment carries a risk of loss of initial capital. The past performance is not a reliable indicator of future results. Be sure to understand risks before making an investment decision.
Go Further
I encourage you to read the complete analyses of Match Group, Inc. and PagerDuty, Inc. to enhance your investment decisions: