In the fast-evolving software application sector, monday.com Ltd. (MNDY) and Match Group, Inc. (MTCH) stand out as innovative players with distinct market focuses. monday.com excels in cloud-based work management solutions, while Match Group leads in global online dating services. Their shared industry and commitment to technology-driven growth make them compelling choices. This article will help you decide which company offers the most promising investment opportunity in 2026.
Table of contents
Companies Overview
I will begin the comparison between monday.com Ltd. and Match Group, Inc. by providing an overview of these two companies and their main differences.
monday.com Ltd. Overview
monday.com Ltd. is a technology company specializing in cloud-based work operating systems, offering modular software applications and work management tools. Its platform serves diverse sectors including marketing, CRM, project management, and software development. Headquartered in Tel Aviv, Israel, monday.com operates internationally, targeting organizations, educational institutions, and government entities with its visual and customizable software solutions.
Match Group, Inc. Overview
Match Group, Inc. is a U.S.-based technology company focused on dating services worldwide. It manages a portfolio of popular brands such as Tinder, Match, OkCupid, and Hinge. Founded in 1986 and headquartered in Dallas, Texas, Match Group provides digital dating products designed to connect users globally, leveraging its diverse brand presence to maintain a leading position in the online dating industry.
Key similarities and differences
Both companies operate in the technology sector within the software application industry and employ roughly 2,500 full-time staff. monday.com focuses on B2B work management and operational tools, while Match Group centers on consumer-facing dating platforms. Their business models diverge significantly: monday.com provides modular SaaS solutions for organizational productivity, whereas Match Group offers subscription-based and advertising-supported social dating services.
Income Statement Comparison
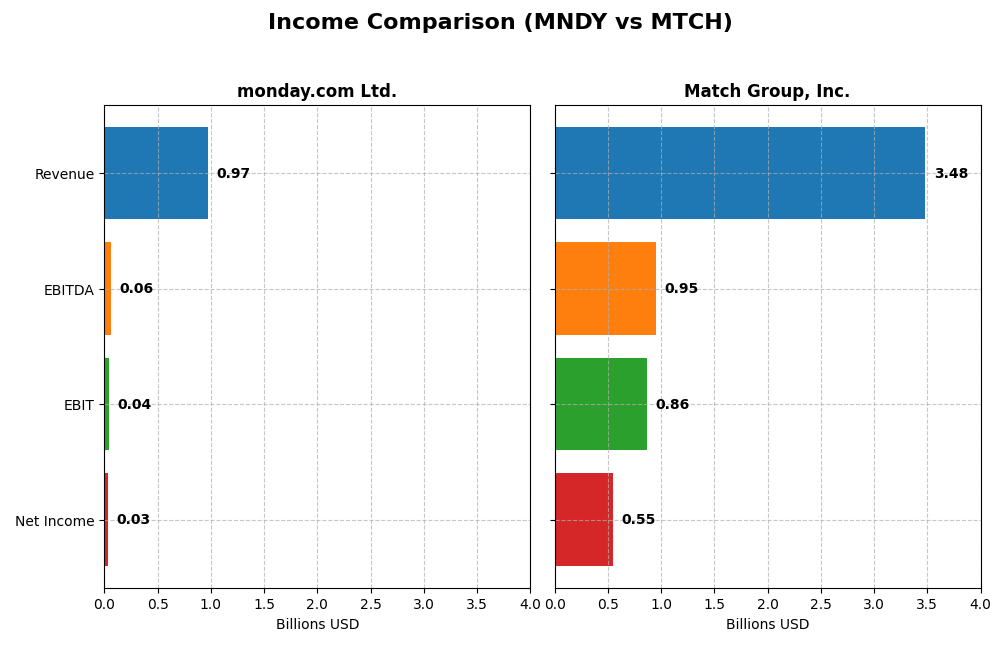
This table compares the key income statement metrics for monday.com Ltd. and Match Group, Inc. for the fiscal year 2024, providing insights into their financial performance.
| Metric | monday.com Ltd. | Match Group, Inc. |
|---|---|---|
| Market Cap | 6.53B | 7.40B |
| Revenue | 972M | 3.48B |
| EBITDA | 58M | 952M |
| EBIT | 40M | 864M |
| Net Income | 32M | 551M |
| EPS | 0.65 | 2.12 |
| Fiscal Year | 2024 | 2024 |
Income Statement Interpretations
monday.com Ltd.
monday.com Ltd. exhibited strong revenue growth from 2020 to 2024, surging from 161M to 972M USD, with net income turning positive in 2024 at 32M USD after several years of losses. Gross margin remained highly favorable at 89.33%, while EBIT and net margins showed neutral but improving trends. The 2024 year saw a significant rebound in profitability, with net income and EPS growth exceeding 1300%.
Match Group, Inc.
Match Group’s revenue increased steadily from 2.39B to 3.48B USD between 2020 and 2024, with net income rising from 162M to 551M USD. Margins stayed favorable, gross margin at 71.51% and net margin at 15.84%. However, 2024 showed a slowdown in growth: revenue growth was neutral at 3.41%, while EBIT and net margin declined, reflecting some operational challenges despite overall profitability.
Which one has the stronger fundamentals?
monday.com presents stronger recent growth momentum and margin improvement, especially with its sharp net income turnaround and expanding gross margin. Match Group maintains higher absolute profitability and stable margins but faces slower growth and margin contractions in 2024. Overall, monday.com’s rapid progress contrasts with Match Group’s more mature but decelerating earnings profile.
Financial Ratios Comparison
This table presents a side-by-side comparison of key financial ratios for monday.com Ltd. (MNDY) and Match Group, Inc. (MTCH) based on their most recent fiscal year data (2024).
| Ratios | monday.com Ltd. (MNDY) | Match Group, Inc. (MTCH) |
|---|---|---|
| ROE | 3.14% | -865.98% |
| ROIC | -1.73% | 16.38% |
| P/E | 363 | 15.44 |
| P/B | 11.41 | -133.75 |
| Current Ratio | 2.66 | 2.54 |
| Quick Ratio | 2.66 | 2.54 |
| D/E (Debt-to-Equity) | 0.10 | -62.09 |
| Debt-to-Assets | 6.29% | 88.51% |
| Interest Coverage | 0 | 5.14 |
| Asset Turnover | 0.58 | 0.78 |
| Fixed Asset Turnover | 7.13 | 22.00 |
| Payout ratio | 0 | 0 |
| Dividend yield | 0 | 0 |
Interpretation of the Ratios
monday.com Ltd.
monday.com Ltd. shows a mixed ratio profile with favorable liquidity and low leverage, as indicated by a current ratio of 2.66 and debt-to-equity of 0.1. However, profitability ratios such as net margin (3.33%) and return on equity (3.14%) are weak, raising concerns about earnings efficiency. The company does not pay dividends, likely focusing on reinvestment and growth, as no distribution or buyback is reported.
Match Group, Inc.
Match Group presents mostly favorable ratios, including a strong net margin of 15.84% and a robust return on invested capital of 16.38%. Despite a high debt-to-assets ratio at 88.51%, its interest coverage is solid at 5.4, supporting debt servicing. Match Group pays a dividend, with a last dividend of $0.76, though the yield is marked unfavorable, suggesting limited income return relative to share price.
Which one has the best ratios?
Match Group has the more favorable ratio profile overall, with higher profitability and efficient capital use balanced by manageable debt costs. monday.com, while financially stable in liquidity and leverage, struggles with profitability and growth metrics. Thus, Match Group’s ratios suggest stronger operational performance compared to monday.com’s mixed results.
Strategic Positioning
This section compares the strategic positioning of monday.com Ltd. and Match Group, Inc., focusing on market position, key segments, and exposure to technological disruption:
monday.com Ltd.
- Competes in software applications with global presence; moderate competitive pressure in cloud-based Work OS market.
- Focuses on Work OS software for work management across marketing, CRM, software development, and education sectors.
- Operates in cloud-based software applications; potential disruption from evolving software platforms and work management tools.
Match Group, Inc.
- Leading dating services provider with diverse brand portfolio; faces competitive pressure in online dating sector.
- Generates revenue mainly from dating products and services, including Tinder and Match; diversified brand portfolio drives business.
- Exposed to technological changes in online dating platforms and digital services innovation.
monday.com Ltd. vs Match Group, Inc. Positioning
monday.com adopts a diversified approach across multiple business functions and sectors through its Work OS platform, while Match Group concentrates on dating services with a broad brand portfolio. Diversification provides monday.com with cross-sector exposure; Match Group benefits from brand specialization but faces sector-specific risks.
Which has the best competitive advantage?
Match Group shows a slightly favorable moat by creating value despite declining ROIC, while monday.com has a slightly unfavorable moat, destroying value though with improving profitability. Match Group currently holds a modest competitive edge based on MOAT evaluation.
Stock Comparison
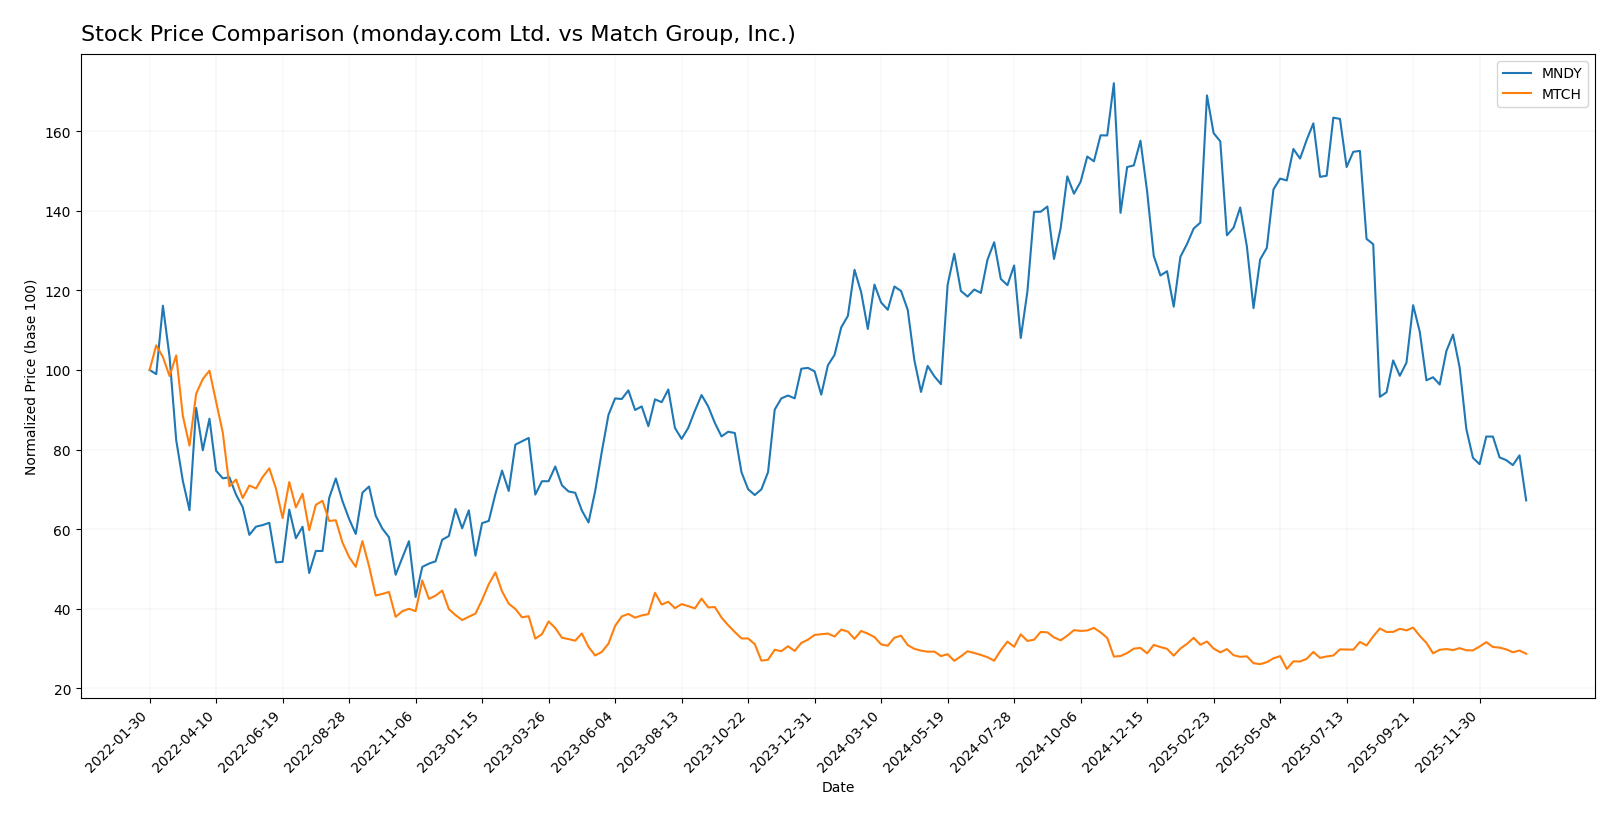
The stock price movements of monday.com Ltd. and Match Group, Inc. over the past year reveal significant declines with distinct volatility profiles and decelerating bearish trends.
Trend Analysis
monday.com Ltd. experienced a 39.06% price decline over the past 12 months, reflecting a bearish trend with decelerating momentum and high volatility, ranging from a high of 324.31 to a low of 126.7.
Match Group, Inc. showed a 14.98% price decrease during the same period, also bearish with deceleration. Its volatility was much lower, with prices fluctuating between 38.51 and 27.18.
Comparing both, monday.com Ltd.’s stock trend showed a larger negative change and higher volatility than Match Group, resulting in the lowest market performance between the two companies.
Target Prices
The current analyst consensus presents a bullish outlook for both monday.com Ltd. and Match Group, Inc.
| Company | Target High | Target Low | Consensus |
|---|---|---|---|
| monday.com Ltd. | 330 | 194 | 264.42 |
| Match Group, Inc. | 43 | 33 | 36.29 |
Analysts expect monday.com’s price to rise significantly from its current 126.7 USD, indicating strong growth potential, while Match Group’s consensus target is moderately above its current 31.34 USD price, suggesting steady appreciation.
Analyst Opinions Comparison
This section compares analysts’ ratings and financial scores for monday.com Ltd. and Match Group, Inc.:
Rating Comparison
monday.com Ltd. Rating
- Rating: B-, considered Very Favorable overall.
- Discounted Cash Flow Score: 4, Favorable valuation.
- ROE Score: 3, Moderate efficiency in equity use.
- ROA Score: 3, Moderate asset utilization.
- Debt To Equity Score: 3, Moderate financial risk.
- Overall Score: 3, Moderate overall performance.
Match Group, Inc. Rating
- Rating: B, also considered Very Favorable overall.
- Discounted Cash Flow Score: 5, Very Favorable valuation.
- ROE Score: 1, Very Unfavorable efficiency in equity use.
- ROA Score: 5, Very Favorable asset utilization.
- Debt To Equity Score: 1, Very Unfavorable financial risk.
- Overall Score: 3, Moderate overall performance.
Which one is the best rated?
Based strictly on the provided data, Match Group holds a higher rating (B vs. B-) and excels in discounted cash flow and asset utilization scores. monday.com shows better scores in return on equity and debt management, but both have a moderate overall score of 3.
Scores Comparison
Here is a comparison of the Altman Z-Score and Piotroski Score for monday.com Ltd. and Match Group, Inc.:
monday.com Ltd. Scores
- Altman Z-Score: 6.33, indicating a safe zone with low bankruptcy risk.
- Piotroski Score: 5, reflecting average financial strength.
Match Group, Inc. Scores
- Altman Z-Score: 0.52, indicating distress zone and high bankruptcy risk.
- Piotroski Score: 8, reflecting very strong financial health.
Which company has the best scores?
monday.com Ltd. shows a significantly stronger Altman Z-Score placing it in the safe zone, while Match Group has a much higher Piotroski Score indicating stronger financial health. The two scores highlight different aspects of financial stability for each company.
Grades Comparison
Here is a detailed comparison of the recent grades assigned to monday.com Ltd. and Match Group, Inc.:
monday.com Ltd. Grades
The table below shows the latest grades given by several reputable grading companies for monday.com Ltd.:
| Grading Company | Action | New Grade | Date |
|---|---|---|---|
| BTIG | Buy | Buy | 2026-01-15 |
| Barclays | Buy | Overweight | 2026-01-12 |
| Jefferies | Buy | Buy | 2026-01-05 |
| Citigroup | Buy | Buy | 2025-12-23 |
| Tigress Financial | Buy | Buy | 2025-12-11 |
| Baird | Buy | Outperform | 2025-11-11 |
| Wells Fargo | Buy | Overweight | 2025-11-11 |
| DA Davidson | Buy | Buy | 2025-11-11 |
| Morgan Stanley | Buy | Overweight | 2025-11-11 |
| Piper Sandler | Buy | Overweight | 2025-11-11 |
monday.com Ltd. shows a consistent pattern of buy or overweight ratings, indicating strong confidence from analysts across multiple firms.
Match Group, Inc. Grades
The following table summarizes the recent grades from recognized grading companies for Match Group, Inc.:
| Grading Company | Action | New Grade | Date |
|---|---|---|---|
| Morgan Stanley | Hold | Equal Weight | 2026-01-13 |
| Truist Securities | Hold | Hold | 2025-11-05 |
| Evercore ISI Group | Hold | In Line | 2025-11-05 |
| Wells Fargo | Hold | Equal Weight | 2025-11-05 |
| Morgan Stanley | Hold | Equal Weight | 2025-10-20 |
| Susquehanna | Buy | Positive | 2025-08-07 |
| Evercore ISI Group | Hold | In Line | 2025-08-06 |
| JP Morgan | Hold | Neutral | 2025-08-06 |
| UBS | Hold | Neutral | 2025-07-23 |
| Wells Fargo | Hold | Equal Weight | 2025-06-27 |
Match Group, Inc. maintains mostly hold or equal weight ratings with occasional positive outlooks, reflecting a more cautious analyst stance.
Which company has the best grades?
monday.com Ltd. has received predominantly buy and outperform grades, suggesting stronger analyst confidence compared to Match Group, Inc., which mostly holds neutral or hold ratings. This difference may influence investors’ perception of growth potential and risk exposure for each stock.
Strengths and Weaknesses
The table below compares key strengths and weaknesses of monday.com Ltd. (MNDY) and Match Group, Inc. (MTCH) based on their recent financial and strategic data.
| Criterion | monday.com Ltd. (MNDY) | Match Group, Inc. (MTCH) |
|---|---|---|
| Diversification | Limited product segmentation; focused on work management software | Diverse portfolio focusing on dating and other services |
| Profitability | Low net margin (3.33%), negative ROIC (-1.73%); shedding value currently | Strong net margin (15.84%), positive ROIC (16.38%); creating value |
| Innovation | Growing ROIC trend indicating improving efficiency | Declining ROIC trend despite value creation; innovation may be challenged |
| Global presence | Moderate with growing market adoption | Strong global presence with large market share in dating services |
| Market Share | Smaller market share in its niche | Leading market share in online dating industry |
Key takeaways: monday.com shows improving profitability trends but currently destroys value with limited diversification. Match Group creates solid value with strong profitability and market presence, though its declining ROIC signals caution on sustained innovation.
Risk Analysis
Below is a comparison of key risks associated with monday.com Ltd. and Match Group, Inc. as of 2024.
| Metric | monday.com Ltd. (MNDY) | Match Group, Inc. (MTCH) |
|---|---|---|
| Market Risk | Beta 1.255, moderate volatility | Beta 1.334, slightly higher volatility |
| Debt level | Low debt-to-equity (0.1), favorable | High debt-to-assets (88.51%), unfavorable |
| Regulatory Risk | Moderate, tech sector regulatory scrutiny | High, due to global privacy and content regulations |
| Operational Risk | Moderate, depends on SaaS platform stability | Moderate, reliant on multiple dating platforms |
| Environmental Risk | Low, primarily software company | Low, service-based company |
| Geopolitical Risk | Based in Israel, some exposure | US-based, less geopolitical risk |
The most impactful risks are Match Group’s high leverage and regulatory challenges in privacy laws worldwide, which could affect profitability. monday.com’s main risk lies in market volatility and valuation concerns despite low debt. Both require monitoring for regulatory changes and operational execution.
Which Stock to Choose?
monday.com Ltd. (MNDY) shows strong income growth with a 33.21% revenue increase in 2024 and favorable margins, but its profitability ratios remain mostly unfavorable, and it is slightly shedding value as ROIC lags behind WACC. Its debt levels are low and well managed, and rating stands at a very favorable B-.
Match Group, Inc. (MTCH) displays moderate income growth and solid profitability metrics, including a 15.84% net margin and favorable ROIC exceeding WACC, signaling value creation despite a declining ROIC trend. The company carries higher debt, reflected in some unfavorable leverage ratios, yet holds a very favorable B rating.
Investors seeking growth might find monday.com’s expanding revenues and improving profitability appealing, while those prioritizing value creation and stable income may view Match Group’s overall favorable ratios and income statement as more suitable. The choice could depend on risk tolerance and investment strategy preferences.
Disclaimer: Investment carries a risk of loss of initial capital. The past performance is not a reliable indicator of future results. Be sure to understand risks before making an investment decision.
Go Further
I encourage you to read the complete analyses of monday.com Ltd. and Match Group, Inc. to enhance your investment decisions: